Special notes of this burst
Image
Pre-slew 15.0-350.0 keV image (Event data)

#   RAcent    DECcent   POSerr    Theta     Phi              Peak Cts       SNR   Name
  207.5151     7.4922   0.0077    10.0972    -1.6013         2.4510182     24.927 TRIG_00302728

Foreground time interval of the image:
  5.160  73.901 (delta_t =  68.741 [sec])
Background time interval of the image:
-132.499   5.160 (delta_t = 137.659 [sec])
Lightcurves
Notes:
- 1) The mask-weighted light curves are using the flight position.
- 2) Multiple plots of different time binning/intervals are shown to cover all scenarios of short/long GRBs, rate/image triggers, and real/false positives.
- 3) For all the mask-weighted lightcurves, the y-axis units are counts/sec/det where a det is 0.4 x 0.4 = 0.16 sq cm.
- 4) The verticle lines correspond to following: green dotted lines are T50 interval, black dotted lines are T90 interval, blue solid line(s) is a spacecraft slew start time, and orange solid line(s) is a spacecraft slew end time.
- 5) Time of each bin is in the middle of the bin.
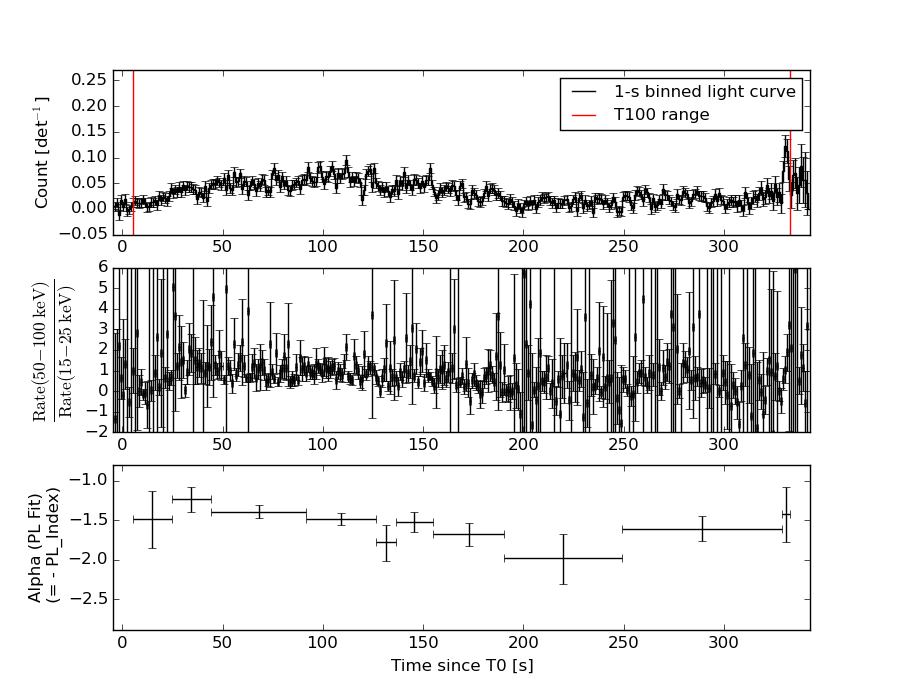
1 s binning
From T0-310 s to T0+310 s

From T100_start - 20 s to T100_end + 30 s
Full time interval
64 ms binning
Full time interval
From T100_start to T100_end
From T0-5 sec to T0+5 sec
16 ms binning
From T100_start-5 s to T100_start+5 s
Blue+Cyan dotted lines: Time interval of the scaled map
From 0.000000 to 64.000000
8 ms binning
From T100_start-3 s to T100_start+3 s
Blue+Cyan dotted lines: Time interval of the scaled map
From 0.000000 to 64.000000
2 ms binning
From T100_start-1 s to T100_start+1 s

Blue+Cyan dotted lines: Time interval of the scaled map
From 0.000000 to 64.000000
SN=5 or 10 sec. binning (whichever binning is satisfied first)

SN=5 or 10 sec. binning (T < 200 sec)

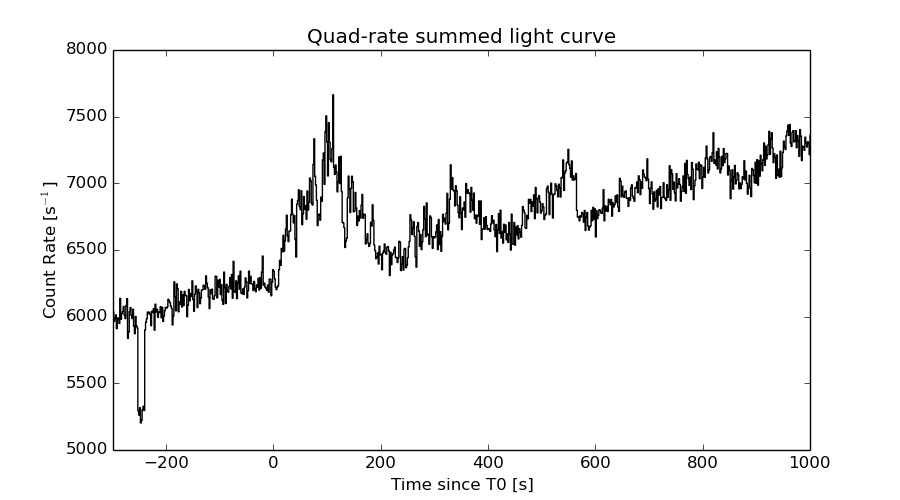
Quad-rate summed light curves (from T0-300s to T0+1000s)
Spectral Evolution
Spectra
Notes:
- 1) The fitting includes the systematic errors.
- 2) When the burst includes telescope slew time periods, the fitting uses an average response file made from multiple 5-s response files through out the slew time plus single time preiod for the non-slew times, and weighted by the total counts in the corresponding time period using addrmf. An average response file is needed becuase a spectral fit using the pre-slew DRM will introduce some errors in both a spectral shape and a normalization if the PHA file contains a lot of the slew/post-slew time interval.
- 3) For fits to more complicated models (e.g. a power-law over a cutoff power-law), the BAT team has decided to require a chi-square improvement of more than 6 for each extra dof.
Time averaged spectrum fit using the average DRM
Power-law model
Time interval is from    5.160 sec. to  332.892 sec.

Spectral model in power-law:
------------------------------------------------------------
Parameters  : value       lower 90%   higher 90%
Photon index: 1.56063     ( -0.0580422   0.0581782 )
Norm@50keV  : 2.07582E-03    ( -6.40214e-05   6.39756e-05 )
------------------------------------------------------------
#Fit statistic : Chi-Squared =          63.51 using 59 PHA bins.
# Reduced chi-squared =          1.114 for     57 degrees of freedom
# Null hypothesis probability =   2.579988e-01

Photon flux (15-150 keV)    in 327.7 sec: 0.263602 ( -0.00865568  0.00867797 ) ph/cm2/s
Energy fluence (15-150 keV)             : 6.39434e-06 ( -2.1087e-07  2.11436e-07 ) ergs/cm2
Cutoff power-law model

Time interval is from    5.160 sec. to  332.892 sec.
Spectral model in the cutoff power-law:
------------------------------------------------------------
Parameters  : value       lower 90%   higher 90%
Photon index: 1.24559     ( -0.243782   0.230913 )
Epeak [keV] : 124.610      ( -32.9227 180.416 )
Norm@50keV  : 2.93960E-03    ( -0.000645791   0.000883942 )
------------------------------------------------------------
#Fit statistic : Chi-Squared =          57.99 using 59 PHA bins.
# Reduced chi-squared =          1.035 for     56 degrees of freedom
# Null hypothesis probability =   4.019365e-01

Photon flux (15-150 keV)    in 327.7 sec: 0.257646 ( -0.009587  0.009614 ) ph/cm2/s
Energy fluence (15-150 keV)             : 6.23338e-06 ( -2.43186e-07  2.42203e-07 ) ergs/cm2
Band function

Time interval is from    5.160 sec. to  332.892 sec.

Spectral model in the Band function:
------------------------------------------------------------
Parameters  : value       lower 90%   higher 90%
alpha       : -1.14532   ( -0.319112   3.40896 )
beta        : -1.77411    ( 1.77261   0.202818 )
Epeak [keV] : 99.4381      ( -71.2399 175.15 )
Norm@50keV   : 3.35658E-03    ( -0.00102316   0.00714598 )
------------------------------------------------------------
#Fit statistic : Chi-Squared =          57.76 using 59 PHA bins.
# Reduced chi-squared =          1.050 for     55 degrees of freedom
# Null hypothesis probability =   3.737917e-01

Photon flux (15-150 keV)    in 327.7 sec: 0.256978 ( 6.74302  -0.009748 ) ph/cm2/s
Energy fluence (15-150 keV)             : 6.2537e-06 ( 0  0 ) ergs/cm2
Single BB

Spectral model blackbody:
------------------------------------------------------------
Parameters  : value    Lower 90%  Upper 90%
kT [keV]    : 15.3509  (  )
R^2/D10^2   : 2.61594E-02  (   )
(R is the radius in km and D10 is the distance to the source in units of 10 kpc)
------------------------------------------------------------
#Fit statistic : Chi-Squared =         256.70 using 59 PHA bins.
# Reduced chi-squared =         4.5036 for     57 degrees of freedom
# Null hypothesis probability =   3.831207e-27

Energy  Fluence     90% Error
[keV]   [erg/cm2]   [erg/cm2]
15- 25  4.212e-07   2.409e-08
25- 50  1.709e-06   7.046e-08
50-150  2.769e-06   1.742e-07
15-150  4.899e-06   1.819e-07
Thermal bremsstrahlung (OTTB)
Spectral model: thermal bremsstrahlung
------------------------------------------------------------
Parameters  : value         Lower 90%    Upper 90%
kT [keV]    : 200.000       (      )
Norm        : 1.06468       (-0.0324351     0.0324351)
------------------------------------------------------------
#Fit statistic : Chi-Squared =          58.05 using 59 PHA bins.
# Reduced chi-squared =          1.019 for     57 degrees of freedom
# Null hypothesis probability =   4.362211e-01

Energy  Fluence     90% Error
[keV]   [erg/cm2]   [erg/cm2]
15- 25  8.696e-07   2.966e-08
25- 50  1.673e-06   5.882e-08
50-150  3.668e-06   1.180e-07
15-150  6.210e-06   2.081e-07
Double BB

Spectral model: bbodyrad<1> + bbodyrad<2>
------------------------------------------------------------
Parameters  : value         Lower 90%    Upper 90%
kT1 [keV]   : 7.20254        (-0.856785      0.936096)
R1^2/D10^2  : 0.238153        (-0.0781087      0.131177)
kT2 [keV]   : 25.6346        (-2.73191      3.81611)
R2^2/D10^2  : 3.40113E-03    (-0.00136005   0.00181373)
------------------------------------------------------------
#Fit statistic : Chi-Squared =          62.22 using 59 PHA bins.
# Reduced chi-squared =          1.131 for     55 degrees of freedom
# Null hypothesis probability =   2.347913e-01

Energy  Fluence     90% Error
[keV]   [erg/cm2]   [erg/cm2]
15- 25  7.948e-07   8.274e-08
25- 50  1.689e-06   1.080e-07
50-150  3.678e-06   3.887e-07
15-150  6.162e-06   5.145e-07
Peak spectrum fit
Power-law model

Time interval is from  330.336 sec. to  331.336 sec.

Spectral model in power-law:
------------------------------------------------------------
Parameters  : value       lower 90%   higher 90%
Photon index: 1.41749     ( -0.485512   0.480682 )
Norm@50keV  : 8.99247E-03    ( -0.0025251   0.00252489 )
------------------------------------------------------------
#Fit statistic : Chi-Squared =          42.66 using 59 PHA bins.
# Reduced chi-squared =         0.7484 for     57 degrees of freedom
# Null hypothesis probability =   9.210333e-01

Photon flux (15-150 keV)    in 1 sec: 1.09967 ( -0.326164  0.329109 ) ph/cm2/s
Energy fluence (15-150 keV)             : 8.65869e-08 ( -2.56351e-08  2.58598e-08 ) ergs/cm2
Cutoff power-law model

Time interval is from  330.336 sec. to  331.336 sec.
Spectral model in the cutoff power-law:
------------------------------------------------------------
Parameters  : value       lower 90%   higher 90%
Photon index: 0.988934     ( -2.66714   1.45598 )
Epeak [keV] : 127.383      ( -127.396 -127.396 )
Norm@50keV  : 1.44246E-02    ( -0.00782789   0.231688 )
------------------------------------------------------------
#Fit statistic : Chi-Squared =          42.50 using 59 PHA bins.
# Reduced chi-squared =         0.7590 for     56 degrees of freedom
# Null hypothesis probability =   9.083438e-01

Photon flux (15-150 keV)    in 1 sec: 1.08315 ( -0.334334  0.3362 ) ph/cm2/s
Energy fluence (15-150 keV)             : 8.51769e-08 ( -2.74174e-08  2.66461e-08 ) ergs/cm2
Band function
Time interval is from  330.336 sec. to  331.336 sec.

Spectral model in the Band function:
------------------------------------------------------------
Parameters  : value       lower 90%   higher 90%
alpha       : 4.10891   ( 0.775158   0.775158 )
beta        : -1.55509    ( 1.70651   0.751225 )
Epeak [keV] : 29.4786      ( -89.2371 -89.2371 )
Norm@50keV   : 83.1287    ( -83.2386   94.776 )
------------------------------------------------------------
#Fit statistic : Chi-Squared =          42.12 using 59 PHA bins.
# Reduced chi-squared =         0.7658 for     55 degrees of freedom
# Null hypothesis probability =   8.988564e-01

Photon flux (15-150 keV)    in 1 sec:  (    ) ph/cm2/s
Energy fluence (15-150 keV)             : 8.48713e-08 ( 0  0 ) ergs/cm2
Single BB

Spectral model blackbody:
------------------------------------------------------------
Parameters  : value    Lower 90%  Upper 90%
kT [keV]    : 16.9785  (-5.20796  7.96643)
R^2/D10^2   : 8.42341E-02  (-0.0839803   0.216585)
(R is the radius in km and D10 is the distance to the source in units of 10 kpc)
------------------------------------------------------------
#Fit statistic : Chi-Squared =          44.94 using 59 PHA bins.
# Reduced chi-squared =         0.7884 for     57 degrees of freedom
# Null hypothesis probability =   8.763585e-01

Energy  Fluence     90% Error
[keV]   [erg/cm2]   [erg/cm2]
15- 25  4.947e-09   3.131e-09
25- 50  2.187e-08   1.310e-08
50-150  4.499e-08   3.021e-08
15-150  7.180e-08   4.047e-08
Thermal bremsstrahlung (OTTB)

Spectral model: thermal bremsstrahlung
------------------------------------------------------------
Parameters  : value         Lower 90%    Upper 90%
kT [keV]    : 199.363       (-118.242      -199.363)
Norm        : 4.60589       (-1.2962     1.2964)
------------------------------------------------------------
#Fit statistic : Chi-Squared =          42.81 using 59 PHA bins.
# Reduced chi-squared =         0.7511 for     57 degrees of freedom
# Null hypothesis probability =   9.184288e-01

Energy  Fluence     90% Error
[keV]   [erg/cm2]   [erg/cm2]
15- 25  1.147e-08   7.000e-09
25- 50  2.206e-08   1.358e-08
50-150  4.839e-08   2.843e-08
15-150  8.192e-08   4.928e-08
Double BB
Spectral model: bbodyrad<1> + bbodyrad<2>
------------------------------------------------------------
Parameters  : value         Lower 90%    Upper 90%
kT1 [keV]   : 7.28324        (-7.44613      -7.44613)
R1^2/D10^2  : 0.860394        (-0.807151      -0.807151)
kT2 [keV]   : 25.8820        (-27.1877      -27.1877)
R2^2/D10^2  : 1.50458E-02    (-0.0128239   0.115821)
------------------------------------------------------------
#Fit statistic : Chi-Squared =          42.59 using 59 PHA bins.
# Reduced chi-squared =         0.7743 for     55 degrees of freedom
# Null hypothesis probability =   8.890731e-01

Energy  Fluence     90% Error
[keV]   [erg/cm2]   [erg/cm2]
15- 25  9.344e-09   5.895e-09
25- 50  2.119e-08   1.167e-08
50-150  5.114e-08   3.295e-08
15-150  8.167e-08   4.570e-08
Pre-slew spectrum (Pre-slew PHA with pre-slew DRM)
Power-law model
Spectral model in power-law:
------------------------------------------------------------
Parameters  : value       lower 90%   higher 90%
Photon index: 1.33326     ( -0.0907183   0.0904045 )
Norm@50keV  : 2.32853E-03    ( -0.000118606   0.000118557 )
------------------------------------------------------------
#Fit statistic : Chi-Squared =          53.08 using 59 PHA bins.
# Reduced chi-squared =         0.9312 for     57 degrees of freedom
# Null hypothesis probability =   6.229082e-01

Photon flux (15-150 keV)    in 68.74 sec: 0.279574 ( -0.0146478  0.0146666 ) ph/cm2/s
Energy fluence (15-150 keV)             : 1.56927e-06 ( -8.88698e-08  8.93104e-08 ) ergs/cm2
Cutoff power-law model
Spectral model in the cutoff power-law:
------------------------------------------------------------
Parameters  : value       lower 90%   higher 90%
Photon index: 0.955745     ( -0.380002   0.34841 )
Epeak [keV] : 144.319      ( -47.7329 751.907 )
Norm@50keV  : 3.54954E-03    ( -0.00111733   0.0018029 )
------------------------------------------------------------
#Fit statistic : Chi-Squared =          49.62 using 59 PHA bins.
# Reduced chi-squared =         0.8861 for     56 degrees of freedom
# Null hypothesis probability =   7.134071e-01

Photon flux (15-150 keV)    in 68.74 sec: 0.274111 ( -0.015491  0.015474 ) ph/cm2/s
Energy fluence (15-150 keV)             : 1.52505e-06 ( -9.88275e-08  9.85732e-08 ) ergs/cm2
Band function

Spectral model in the Band function:
------------------------------------------------------------
Parameters  : value       lower 90%   higher 90%
alpha       : -0.958875   ( -0.345114   0.233569 )
beta        : -7.01254    ( 4.59903   14.599 )
Epeak [keV] : 145.052      ( -108.887 700.9 )
Norm@50keV   : 3.53720E-03    ( -0.000385067   0.000641114 )
------------------------------------------------------------
#Fit statistic : Chi-Squared =          49.62 using 59 PHA bins.
# Reduced chi-squared =         0.9023 for     55 degrees of freedom
# Null hypothesis probability =   6.794535e-01

Photon flux (15-150 keV)    in 68.74 sec:  (    ) ph/cm2/s
Energy fluence (15-150 keV)             : 0 ( 0  0 ) ergs/cm2
S(25-50 keV) vs. S(50-100 keV) plot

S(25-50 keV)  = 1.63e-06
S(50-100 keV) = 2.21e-06
T90 vs. Hardness ratio plot
T90                                   = 292.460000008345 sec.
Hardness ratio (energy fluence ratio) = 1.35583
Color vs. Color plot

Count Ratio  (25-50 keV) / (15-25 keV) = 1.31717
Count Ratio (50-100 keV) / (15-25 keV) = 0.951998
Mask shadow pattern
IMX = 1.780072672979531E-01, IMY = 4.976312632555476E-03
TIME vs. PHA plot around the trigger time
Blue+Cyan dotted lines: Time interval of the scaled map
From 0.000000 to 64.000000
TIME vs. DetID plot around the trigger time

Blue+Cyan dotted lines: Time interval of the scaled map
From 0.000000 to 64.000000
100 us light curve (15-350 keV)

Blue+Cyan dotted lines: Time interval of the scaled map
From 0.000000 to 64.000000
Spacecraft aspect plot
Bright source in the pre-burst/pre-slew/post-slew images
Pre-burst image of 15-350 keV band
Time interval of the image:
-132.499410 5.160000

# RAcent  DECcent POSerr Theta    Phi  PeakCts   SNR AngSep     Name
#  [deg]    [deg]    ['] [deg]  [deg]                   [']
195.1665 -18.7174    2.3  38.1   20.0   0.9055   5.0 ------	UNKNOWN
230.1360  48.8030    2.5  36.5 -152.4   0.7072   4.7 ------	UNKNOWN
230.0218  27.7371    2.2  23.6 -117.9   0.6990   5.2 ------	UNKNOWN
Pre-slew background subtracted image of 15-350 keV band
Time interval of the image:
5.160000 73.900590

# RAcent  DECcent POSerr Theta    Phi  PeakCts   SNR AngSep     Name
#  [deg]    [deg]    ['] [deg]  [deg]                   [']
173.9871  14.1515    2.2  31.8   90.4   0.9860   5.3 ------	UNKNOWN
207.5151   7.4923    0.5  10.1   -1.6   2.4510  24.9 ------	UNKNOWN
242.9278   3.0138    2.1  38.2  -70.0   1.2185   5.5 ------	UNKNOWN
Post-slew image of 15-350 keV band
Time interval of the image:
112.100600 194.900590

# RAcent  DECcent POSerr Theta    Phi  PeakCts   SNR AngSep     Name
#  [deg]    [deg]    ['] [deg]  [deg]                   [']
254.4207  35.2741    5.1  51.1 -143.2  -0.7884  -2.2    4.5	Her X-1
174.0160  34.5251    3.5  41.0  122.9   1.1335   3.3 ------	UNKNOWN
171.3349  -3.9961    2.0  37.9   60.3   1.5004   5.8 ------	UNKNOWN
207.5084   7.4818    0.3   0.0  -28.9   3.3205  34.7 ------	UNKNOWN
208.5433 -45.3028    2.0  52.8  -14.1   1.5424   5.8 ------	UNKNOWN
227.6220 -39.2160    2.3  50.3  -33.5   1.4511   5.1 ------	UNKNOWN
248.2060   2.2147    2.4  40.9  -97.9   2.0214   4.9 ------	UNKNOWN
Plot creation:
Sun May 31 08:25:04 EDT 2015