Click here for the BAT GCN circular template
Image
Pre-slew 15.0-350.0 keV image (Event data)

#   RAcent    DECcent   POSerr    Theta     Phi              Peak Cts       SNR   Name
  355.9557    12.1667   0.0207    47.3763   -36.1005         1.1956267      9.300 TRIG_00303609

Foreground time interval of the image:
-12.352  12.752 (delta_t =  25.104 [sec])
Background time interval of the image:
-662.175 -617.301 (delta_t =  44.875 [sec])
-239.376 -12.352 (delta_t = 227.024 [sec])
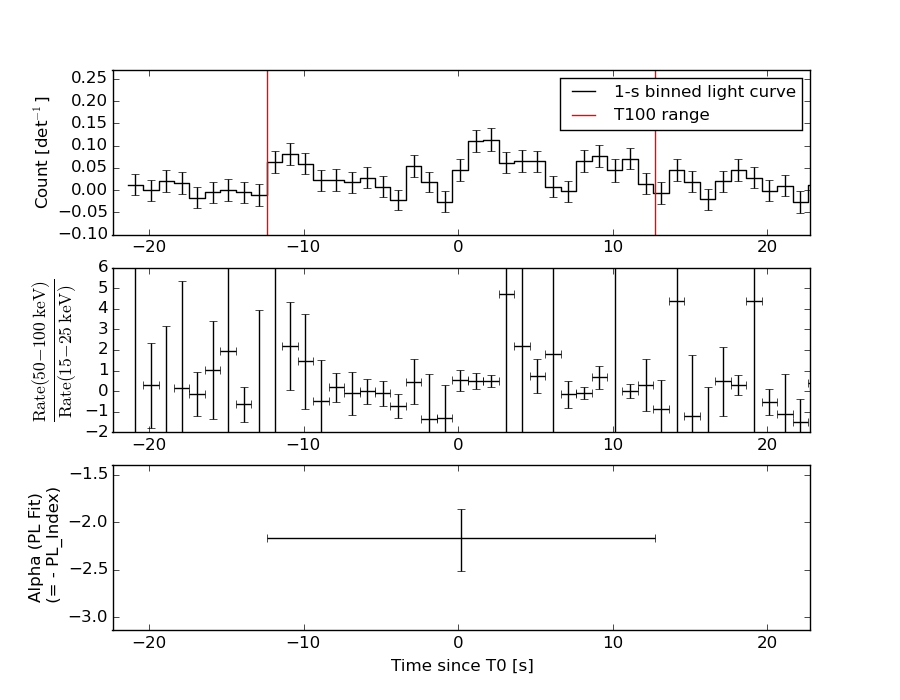
Lightcurves
Notes:
- 1) The mask-weighted light curves are using the flight position.
- 2) Multiple plots of different time binning/intervals are shown to cover all scenarios of short/long GRBs, rate/image triggers, and real/false positives.
- 3) For all the mask-weighted lightcurves, the y-axis units are counts/sec/det where a det is 0.4 x 0.4 = 0.16 sq cm.
- 4) The verticle lines correspond to following: green dotted lines are T50 interval, black dotted lines are T90 interval, blue solid line(s) is a spacecraft slew start time, and orange solid line(s) is a spacecraft slew end time.
- 5) Time of each bin is in the middle of the bin.
1 s binning
From T0-310 s to T0+310 s
From T100_start - 20 s to T100_end + 30 s
Full time interval
64 ms binning
Full time interval
From T100_start to T100_end
From T0-5 sec to T0+5 sec

16 ms binning
From T100_start-5 s to T100_start+5 s

Blue+Cyan dotted lines: Time interval of the scaled map
From 0.000000 to 4.096000
8 ms binning
From T100_start-3 s to T100_start+3 s
Blue+Cyan dotted lines: Time interval of the scaled map
From 0.000000 to 4.096000
2 ms binning
From T100_start-1 s to T100_start+1 s

Blue+Cyan dotted lines: Time interval of the scaled map
From 0.000000 to 4.096000
SN=5 or 10 sec. binning (whichever binning is satisfied first)

SN=5 or 10 sec. binning (T < 200 sec)
Quad-rate summed light curves (from T0-300s to T0+1000s)

Spectral Evolution
Spectra
Notes:
- 1) The fitting includes the systematic errors.
- 2) When the burst includes telescope slew time periods, the fitting uses an average response file made from multiple 5-s response files through out the slew time plus single time preiod for the non-slew times, and weighted by the total counts in the corresponding time period using addrmf. An average response file is needed becuase a spectral fit using the pre-slew DRM will introduce some errors in both a spectral shape and a normalization if the PHA file contains a lot of the slew/post-slew time interval.
- 3) For fits to more complicated models (e.g. a power-law over a cutoff power-law), the BAT team has decided to require a chi-square improvement of more than 6 for each extra dof.
Time averaged spectrum fit using the average DRM
Power-law model
Time interval is from  -12.352 sec. to   12.752 sec.

Spectral model in power-law:
------------------------------------------------------------
Parameters  : value       lower 90%   higher 90%
Photon index: 2.16724     ( -0.303714   0.341298 )
Norm@50keV  : 2.63522E-03    ( -0.00062305   0.000604668 )
------------------------------------------------------------
#Fit statistic : Chi-Squared =          50.97 using 59 PHA bins.
# Reduced chi-squared =         0.8942 for     57 degrees of freedom
# Null hypothesis probability =   6.994214e-01

Photon flux (15-150 keV)    in 25.1 sec: 0.428894 ( -0.0738856  0.0738965 ) ph/cm2/s
Energy fluence (15-150 keV)             : 6.19167e-07 ( -1.2623e-07  1.30832e-07 ) ergs/cm2
Cutoff power-law model

Time interval is from  -12.352 sec. to   12.752 sec.
Spectral model in the cutoff power-law:
------------------------------------------------------------
Parameters  : value       lower 90%   higher 90%
Photon index: 0.696266     ( -2.22071   1.30733 )
Epeak [keV] : 35.5381      (   )
Norm@50keV  : 1.95230E-02    (     )
------------------------------------------------------------
#Fit statistic : Chi-Squared =          47.72 using 59 PHA bins.
# Reduced chi-squared =         0.8521 for     56 degrees of freedom
# Null hypothesis probability =   7.766134e-01

Photon flux (15-150 keV)    in 25.1 sec: 0.413402 ( -0.074969  0.075097 ) ph/cm2/s
Energy fluence (15-150 keV)             : 5.59838e-07 ( -1.23326e-07  1.38191e-07 ) ergs/cm2
Band function
Time interval is from  -12.352 sec. to   12.752 sec.

Spectral model in the Band function:
------------------------------------------------------------
Parameters  : value       lower 90%   higher 90%
alpha       : -0.696148   ( -0.822249   2.7608 )
beta        : -10.0000    ( 10   5.32907e-15 )
Epeak [keV] : 35.5309      ( -20.9314 14.8951 )
Norm@50keV   : 1.95268E-02    ( -0.0195267   0.432347 )
------------------------------------------------------------
#Fit statistic : Chi-Squared =          47.72 using 59 PHA bins.
# Reduced chi-squared =         0.8676 for     55 degrees of freedom
# Null hypothesis probability =   7.463357e-01

Photon flux (15-150 keV)    in 25.1 sec: 0.414154 ( 6.58585  -0.074582 ) ph/cm2/s
Energy fluence (15-150 keV)             : 5.58922e-07 ( -5.58746e-07  -1.22817e-07 ) ergs/cm2
Single BB
Spectral model blackbody:
------------------------------------------------------------
Parameters  : value    Lower 90%  Upper 90%
kT [keV]    : 9.24988  (-1.58218  1.89342)
R^2/D10^2   : 0.276281  (-0.143162   0.29765)
(R is the radius in km and D10 is the distance to the source in units of 10 kpc)
------------------------------------------------------------
#Fit statistic : Chi-Squared =          50.57 using 59 PHA bins.
# Reduced chi-squared =         0.8872 for     57 degrees of freedom
# Null hypothesis probability =   7.133084e-01

Energy  Fluence     90% Error
[keV]   [erg/cm2]   [erg/cm2]
15- 25  1.171e-07   3.596e-08
25- 50  2.596e-07   6.534e-08
50-150  1.076e-07   5.028e-08
15-150  4.843e-07   1.396e-07
Thermal bremsstrahlung (OTTB)
Spectral model: thermal bremsstrahlung
------------------------------------------------------------
Parameters  : value         Lower 90%    Upper 90%
kT [keV]    : 50.1545       (-17.5026      33.127)
Norm        : 2.46415       (-0.621863     0.890241)
------------------------------------------------------------
#Fit statistic : Chi-Squared =          48.17 using 59 PHA bins.
# Reduced chi-squared =         0.8450 for     57 degrees of freedom
# Null hypothesis probability =   7.913574e-01

Energy  Fluence     90% Error
[keV]   [erg/cm2]   [erg/cm2]
15- 25  1.513e-07   3.327e-08
25- 50  2.176e-07   5.243e-08
50-150  2.119e-07   1.032e-07
15-150  5.808e-07   1.529e-07
Double BB
Spectral model: bbodyrad<1> + bbodyrad<2>
------------------------------------------------------------
Parameters  : value         Lower 90%    Upper 90%
kT1 [keV]   : 3.75145        (-3.75302      -3.75302)
R1^2/D10^2  : 4.34789        (-4.33716      -4.33716)
kT2 [keV]   : 11.3962        (-2.96984      -11.3996)
R2^2/D10^2  : 0.103592    (-0.103436   0.280247)
------------------------------------------------------------
#Fit statistic : Chi-Squared =          47.98 using 59 PHA bins.
# Reduced chi-squared =         0.8724 for     55 degrees of freedom
# Null hypothesis probability =   7.375083e-01

Energy  Fluence     90% Error
[keV]   [erg/cm2]   [erg/cm2]
15- 25  1.431e-07   7.548e-08
25- 50  2.315e-07   1.299e-07
50-150  1.583e-07   9.740e-08
15-150  5.329e-07   2.764e-07
Peak spectrum fit
Power-law model

Time interval is from    1.220 sec. to    2.220 sec.

Spectral model in power-law:
------------------------------------------------------------
Parameters  : value       lower 90%   higher 90%
Photon index: 2.39286     ( -0.553013   0.711955 )
Norm@50keV  : 7.79252E-03    ( -0.00352909   0.00332343 )
------------------------------------------------------------
#Fit statistic : Chi-Squared =          43.12 using 59 PHA bins.
# Reduced chi-squared =         0.7565 for     57 degrees of freedom
# Null hypothesis probability =   9.129956e-01

Photon flux (15-150 keV)    in 1 sec: 1.43581 ( -0.39237  0.39237 ) ph/cm2/s
Energy fluence (15-150 keV)             : 7.58913e-08 ( -2.53349e-08  2.7038e-08 ) ergs/cm2
Cutoff power-law model
Time interval is from    1.220 sec. to    2.220 sec.
Spectral model in the cutoff power-law:
------------------------------------------------------------
Parameters  : value       lower 90%   higher 90%
Photon index: 1.98172     (     )
Epeak [keV] : 1.77581      (   )
Norm@50keV  : 1.36829E-02    (     )
------------------------------------------------------------
#Fit statistic : Chi-Squared =          43.34 using 59 PHA bins.
# Reduced chi-squared =         0.7740 for     56 degrees of freedom
# Null hypothesis probability =   8.917357e-01

Photon flux (15-150 keV)    in 1 sec: 1.43649 ( -0.39365  0.39102 ) ph/cm2/s
Energy fluence (15-150 keV)             : 7.60429e-08 ( -2.95402e-08  2.64191e-08 ) ergs/cm2
Band function

Time interval is from    1.220 sec. to    2.220 sec.

Spectral model in the Band function:
------------------------------------------------------------
Parameters  : value       lower 90%   higher 90%
alpha       : -1.63589   ( 1.62835   1.62835 )
beta        : -2.59636    ( 2.59556   0.749535 )
Epeak [keV] : 14.9785      ( -15.2016 -15.2016 )
Norm@50keV   : 2.54199E-02    ( -0.0256814   6.65286e+06 )
------------------------------------------------------------
#Fit statistic : Chi-Squared =          43.06 using 59 PHA bins.
# Reduced chi-squared =         0.7829 for     55 degrees of freedom
# Null hypothesis probability =   8.786376e-01

Photon flux (15-150 keV)    in 1 sec:  (    ) ph/cm2/s
Energy fluence (15-150 keV)             : 0 ( 0  0 ) ergs/cm2
Single BB

Spectral model blackbody:
------------------------------------------------------------
Parameters  : value    Lower 90%  Upper 90%
kT [keV]    : 7.18901  (-1.81041  2.32014)
R^2/D10^2   : 2.44305  (-2.44305   5.75543)
(R is the radius in km and D10 is the distance to the source in units of 10 kpc)
------------------------------------------------------------
#Fit statistic : Chi-Squared =          44.97 using 59 PHA bins.
# Reduced chi-squared =         0.7889 for     57 degrees of freedom
# Null hypothesis probability =   8.757955e-01

Energy  Fluence     90% Error
[keV]   [erg/cm2]   [erg/cm2]
15- 25  2.084e-08   1.270e-08
25- 50  3.003e-08   1.789e-08
50-150  5.474e-09   4.537e-09
15-150  5.634e-08   3.505e-08
Thermal bremsstrahlung (OTTB)

Spectral model: thermal bremsstrahlung
------------------------------------------------------------
Parameters  : value         Lower 90%    Upper 90%
kT [keV]    : 34.4948       (-17.6747      55.208)
Norm        : 10.2507       (-4.72544     10.7244)
------------------------------------------------------------
#Fit statistic : Chi-Squared =          43.75 using 59 PHA bins.
# Reduced chi-squared =         0.7675 for     57 degrees of freedom
# Null hypothesis probability =   9.013511e-01

Energy  Fluence     90% Error
[keV]   [erg/cm2]   [erg/cm2]
15- 25  2.226e-08   1.062e-08
25- 50  2.735e-08   1.445e-08
50-150  1.785e-08   1.345e-08
15-150  6.747e-08   3.735e-08
Double BB
------------------------------------------------------------
Parameters  : value         Lower 90%    Upper 90%
kT1 [keV]   : 1.01651        (-1.28059      2.35474)
R1^2/D10^2  : 1.02014E+06        (      )
kT2 [keV]   : 7.83051        (-2.09304      3.74891)
R2^2/D10^2  : 1.60112    (-1.602   2.47411)
------------------------------------------------------------
#Fit statistic : Chi-Squared =          43.02 using 59 PHA bins.
#Fit statistic : Chi-Squared =          42.78 using 59 PHA bins.
# Reduced chi-squared =         0.7822 for     55 degrees of freedom
# Reduced chi-squared =         0.7778 for     55 degrees of freedom
# Null hypothesis probability =   8.795810e-01
# Null hypothesis probability =   8.849351e-01

Energy  Fluence     90% Error
[keV]   [erg/cm2]   [erg/cm2]
15- 25  2.112e-08   1.116e-08
25- 50  2.924e-08   1.835e-08
50-150  7.508e-09   5.570e-09
15-150  5.788e-08   3.410e-08
Pre-slew spectrum (Pre-slew PHA with pre-slew DRM)
Power-law model

Spectral model in power-law:
------------------------------------------------------------
Parameters  : value       lower 90%   higher 90%
Photon index: 2.16724     ( -0.303714   0.341298 )
Norm@50keV  : 2.63522E-03    ( -0.00062305   0.000604668 )
------------------------------------------------------------
#Fit statistic : Chi-Squared =          50.97 using 59 PHA bins.
# Reduced chi-squared =         0.8942 for     57 degrees of freedom
# Null hypothesis probability =   6.994214e-01

Photon flux (15-150 keV)    in 25.1 sec: 0.428894 ( -0.0738856  0.0738965 ) ph/cm2/s
Energy fluence (15-150 keV)             : 6.19167e-07 ( -1.2623e-07  1.30832e-07 ) ergs/cm2
Cutoff power-law model

Spectral model in the cutoff power-law:
------------------------------------------------------------
Parameters  : value       lower 90%   higher 90%
Photon index: 0.696266     ( -2.22071   1.30733 )
Epeak [keV] : 35.5381      (   )
Norm@50keV  : 1.95230E-02    (     )
------------------------------------------------------------
#Fit statistic : Chi-Squared =          47.72 using 59 PHA bins.
# Reduced chi-squared =         0.8521 for     56 degrees of freedom
# Null hypothesis probability =   7.766134e-01

Photon flux (15-150 keV)    in 25.1 sec: 0.413402 ( -0.074969  0.075097 ) ph/cm2/s
Energy fluence (15-150 keV)             : 5.59838e-07 ( -1.23326e-07  1.38191e-07 ) ergs/cm2
Band function

Spectral model in the Band function:
------------------------------------------------------------
Parameters  : value       lower 90%   higher 90%
alpha       : -0.696148   ( -0.822249   2.7608 )
beta        : -10.0000    ( 10   1.95399e-14 )
Epeak [keV] : 35.5309      ( -20.9314 14.8951 )
Norm@50keV   : 1.95268E-02    ( -0.0195267   0.432347 )
------------------------------------------------------------
#Fit statistic : Chi-Squared =          47.72 using 59 PHA bins.
# Reduced chi-squared =         0.8676 for     55 degrees of freedom
# Null hypothesis probability =   7.463357e-01

Photon flux (15-150 keV)    in 25.1 sec: 0.414154 ( 6.58585  -0.074582 ) ph/cm2/s
Energy fluence (15-150 keV)             : 5.58922e-07 ( -5.58746e-07  -1.22817e-07 ) ergs/cm2
S(25-50 keV) vs. S(50-100 keV) plot
S(25-50 keV)  = 1.95e-07
S(50-100 keV) = 1.73e-07
T90 vs. Hardness ratio plot

T90                                   = 22.7999999523163 sec.
Hardness ratio (energy fluence ratio) = 0.887179
Color vs. Color plot
Count Ratio  (25-50 keV) / (15-25 keV) = 1.25574
Count Ratio (50-100 keV) / (15-25 keV) = 0.529285
Mask shadow pattern
IMX = 8.779473014463297E-01, IMY = 6.402230271866078E-01
TIME vs. PHA plot around the trigger time
Blue+Cyan dotted lines: Time interval of the scaled map
From 0.000000 to 4.096000
TIME vs. DetID plot around the trigger time

Blue+Cyan dotted lines: Time interval of the scaled map
From 0.000000 to 4.096000
100 us light curve (15-350 keV)

Blue+Cyan dotted lines: Time interval of the scaled map
From 0.000000 to 4.096000
Spacecraft aspect plot

Bright source in the pre-burst/pre-slew/post-slew images
Pre-burst image of 15-350 keV band
Time interval of the image:
-662.175400 -617.300800
-239.376000 -12.352000

# RAcent  DECcent POSerr Theta    Phi  PeakCts   SNR AngSep     Name
#  [deg]    [deg]    ['] [deg]  [deg]                   [']
 59.2396 -34.8281    2.6  29.4  129.0   1.3014   4.5 ------	UNKNOWN
  9.4609  19.4772    2.6  46.5  -15.7   1.6275   4.4 ------	UNKNOWN
  1.3495  25.1147    3.2  54.9  -21.0   2.6406   3.6 ------	UNKNOWN
Pre-slew background subtracted image of 15-350 keV band
Time interval of the image:
-12.352000 12.752000

# RAcent  DECcent POSerr Theta    Phi  PeakCts   SNR AngSep     Name
#  [deg]    [deg]    ['] [deg]  [deg]                   [']
355.9556  12.1667    1.2  47.4  -36.1   1.1959   9.3 ------	UNKNOWN
Post-slew image of 15-350 keV band
Time interval of the image:
862.924590 962.697800

# RAcent  DECcent POSerr Theta    Phi  PeakCts   SNR AngSep     Name
#  [deg]    [deg]    ['] [deg]  [deg]                   [']
135.5362 -40.5620    0.7  19.8 -145.2   1.5956  15.6    0.6	Vela X-1
170.3680 -60.7354   30.5  49.0 -148.0  -0.1004  -0.4    6.9	Cen X-3
186.4928 -62.6947    7.9  56.8 -149.3  -0.9623  -1.5    6.4	GX 301-2
126.4117 -68.2525    2.9  45.3 -121.3   1.6407   4.0 ------	UNKNOWN
Plot creation:
Sun May 31 08:19:14 EDT 2015