Special notes of this burst
Image
Pre-slew 15.0-350.0 keV image (Event data)

#   RAcent    DECcent   POSerr    Theta     Phi              Peak Cts       SNR   Name
  220.0414    -0.1646   0.0103    27.7807   158.1826         2.2877529     18.593 TRIG_00305288

Foreground time interval of the image:
-52.979  18.421 (delta_t =  71.400 [sec])
Background time interval of the image:
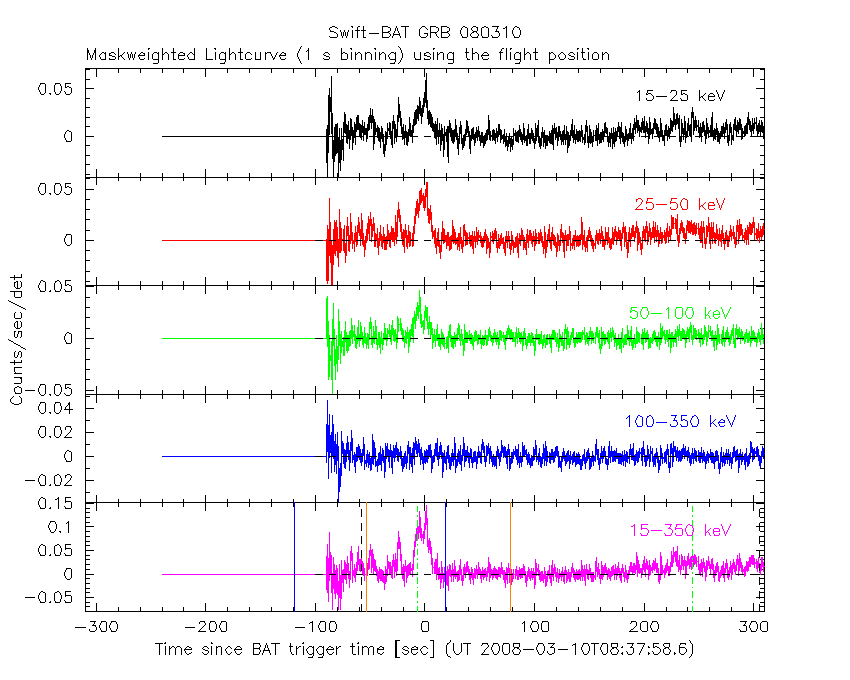
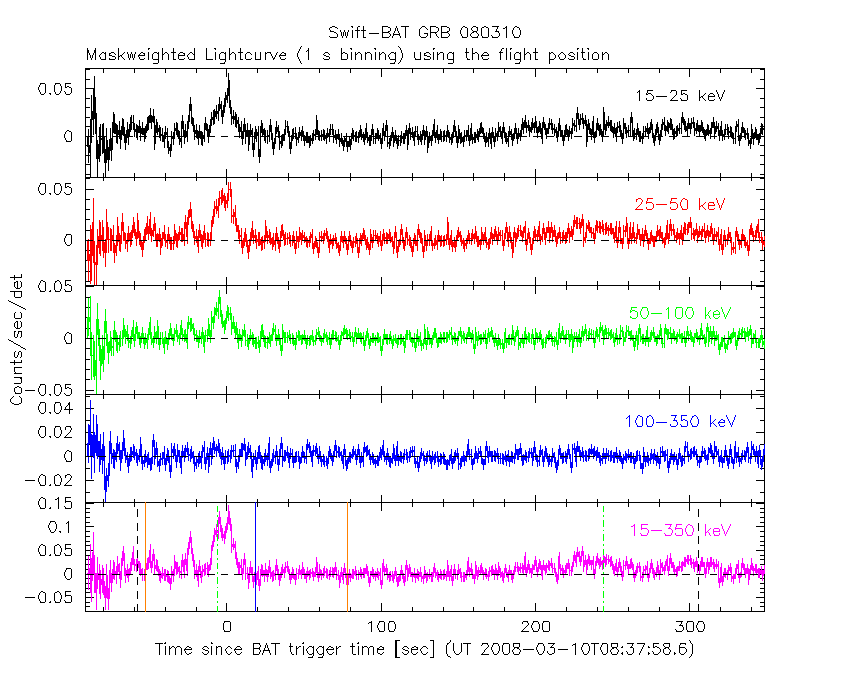
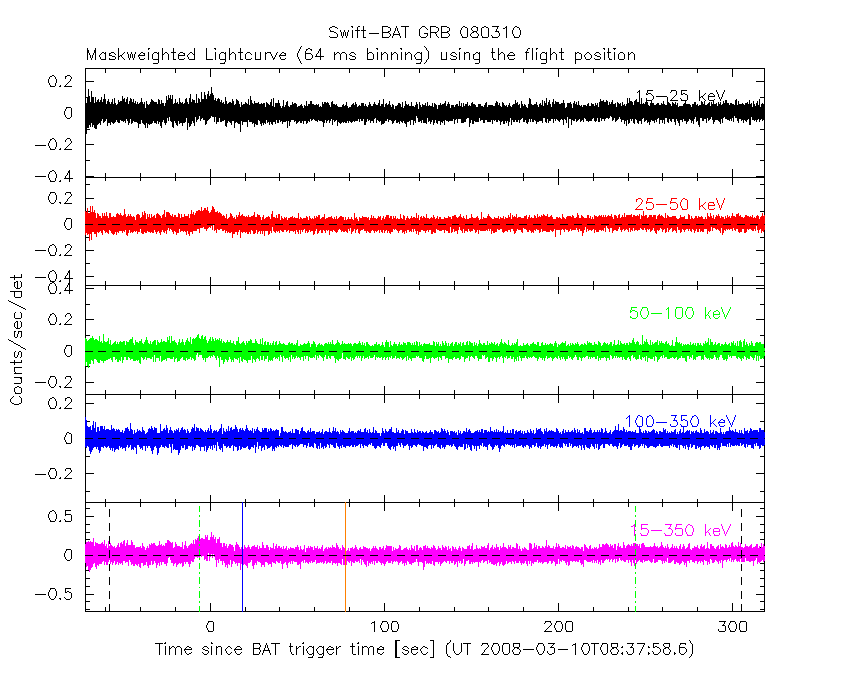
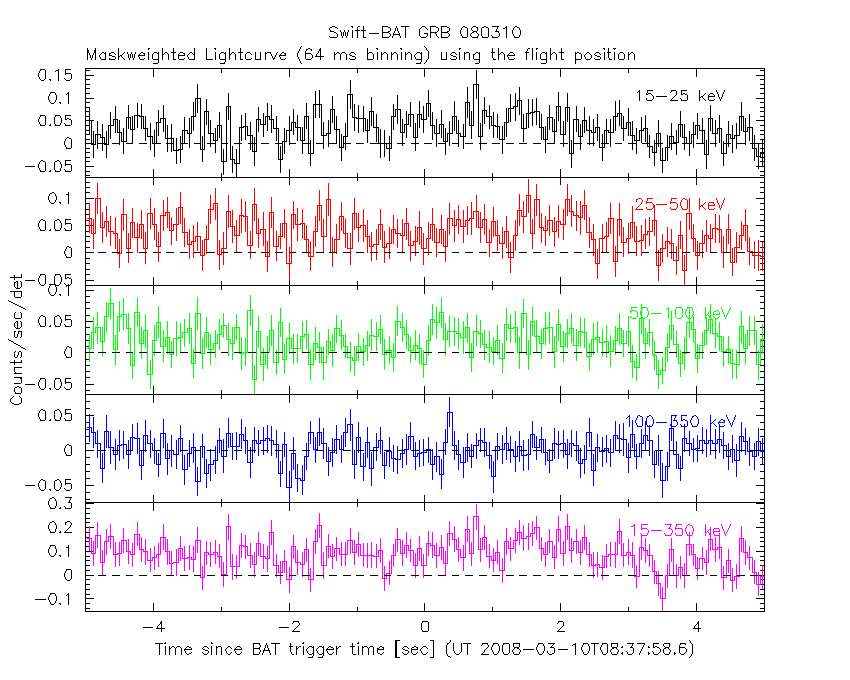
Lightcurves
Notes:
- 1) The mask-weighted light curves are using the flight position.
- 2) Multiple plots of different time binning/intervals are shown to cover all scenarios of short/long GRBs, rate/image triggers, and real/false positives.
- 3) For all the mask-weighted lightcurves, the y-axis units are counts/sec/det where a det is 0.4 x 0.4 = 0.16 sq cm.
- 4) The verticle lines correspond to following: green dotted lines are T50 interval, black dotted lines are T90 interval, blue solid line(s) is a spacecraft slew start time, and orange solid line(s) is a spacecraft slew end time.
- 5) Time of each bin is in the middle of the bin.
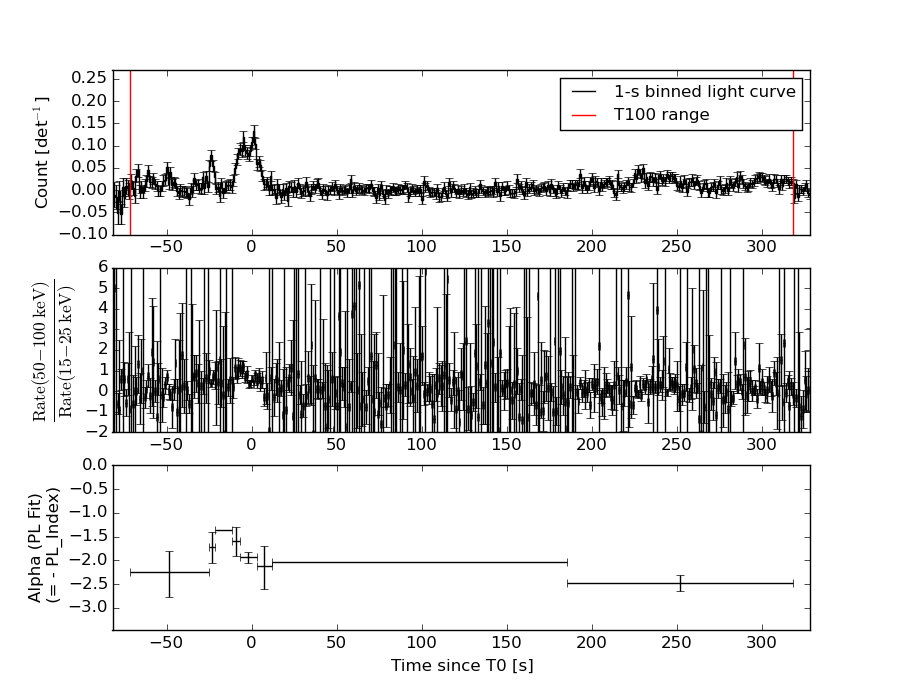
1 s binning
From T0-310 s to T0+310 s
From T100_start - 20 s to T100_end + 30 s
Full time interval

64 ms binning
Full time interval

From T100_start to T100_end
From T0-5 sec to T0+5 sec
16 ms binning
From T100_start-5 s to T100_start+5 s
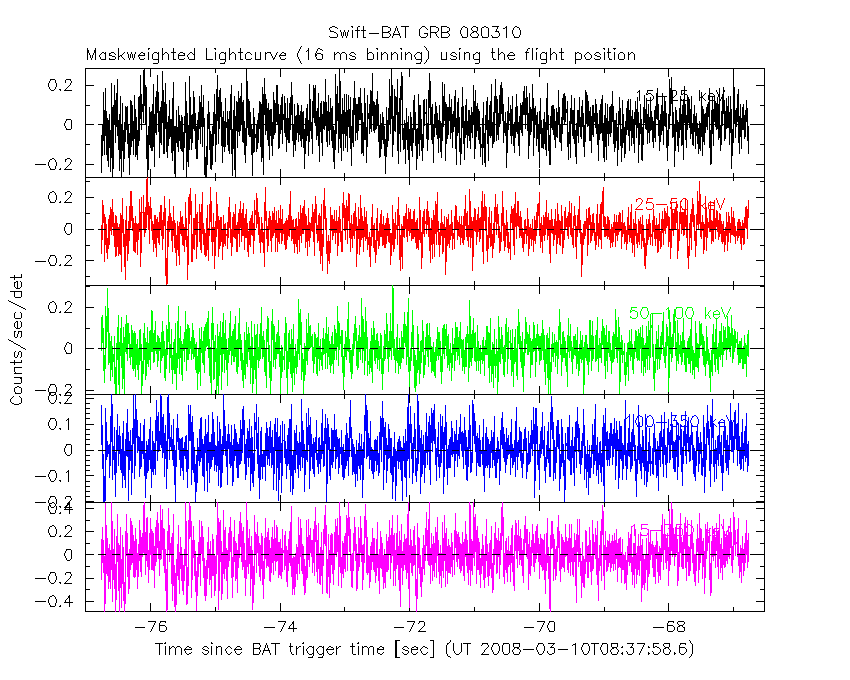
Blue+Cyan dotted lines: Time interval of the scaled map
From 0.000000 to 1.024000
8 ms binning
From T100_start-3 s to T100_start+3 s
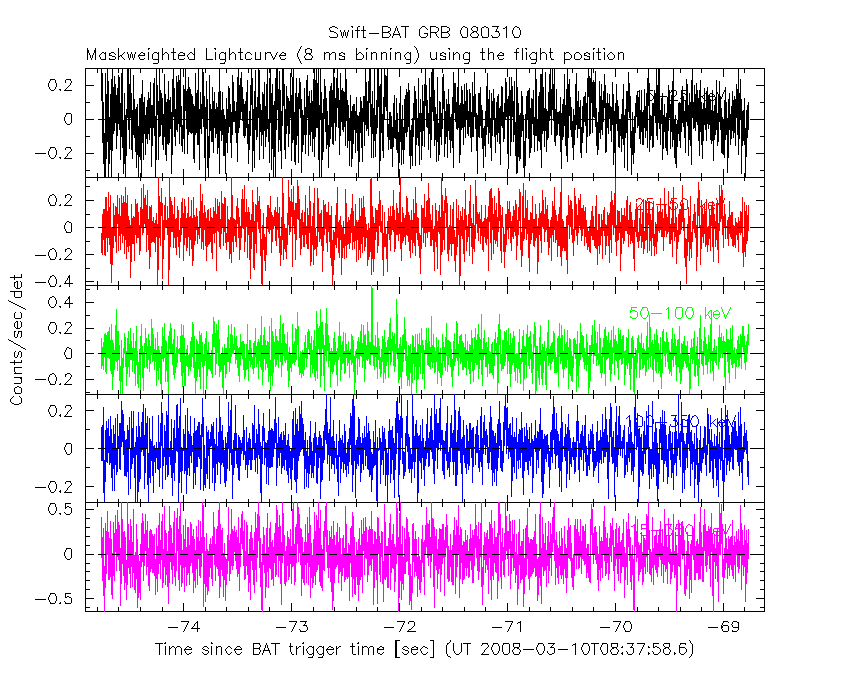
Blue+Cyan dotted lines: Time interval of the scaled map
From 0.000000 to 1.024000
2 ms binning
From T100_start-1 s to T100_start+1 s

Blue+Cyan dotted lines: Time interval of the scaled map
From 0.000000 to 1.024000
SN=5 or 10 sec. binning (whichever binning is satisfied first)
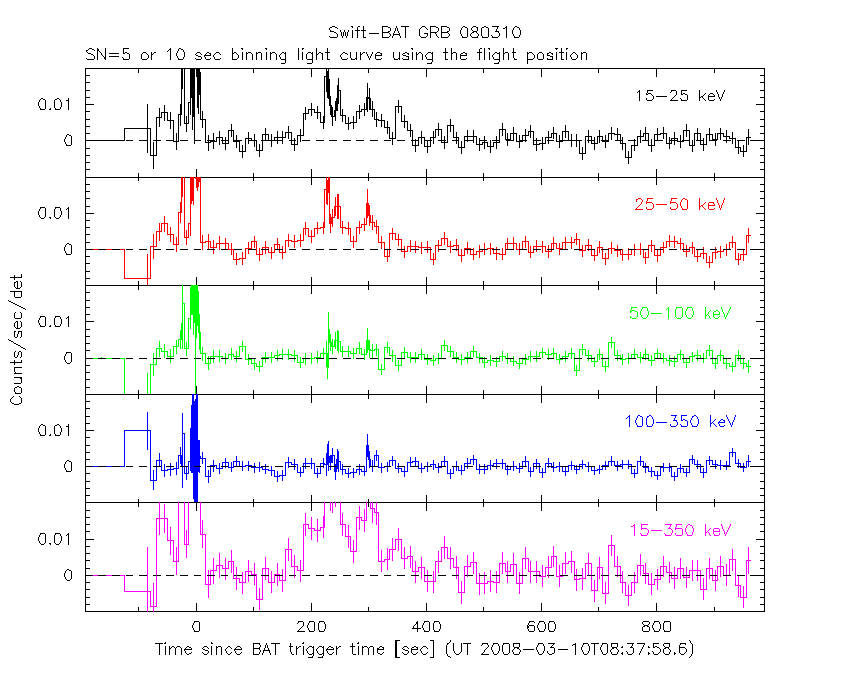
SN=5 or 10 sec. binning (T < 200 sec)

Quad-rate summed light curves (from T0-300s to T0+1000s)

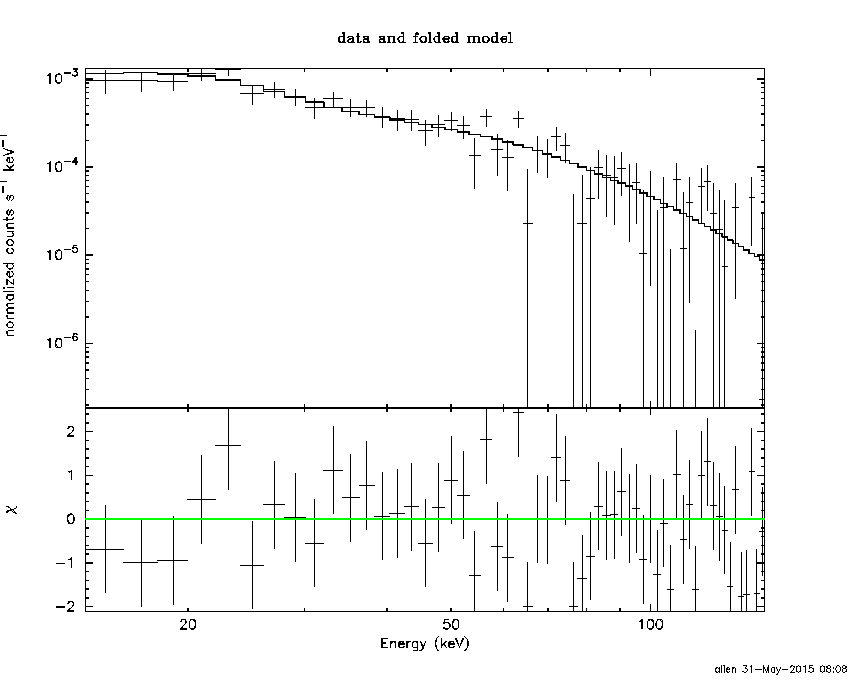
Spectral Evolution
Spectra
Notes:
- 1) The fitting includes the systematic errors.
- 2) When the burst includes telescope slew time periods, the fitting uses an average response file made from multiple 5-s response files through out the slew time plus single time preiod for the non-slew times, and weighted by the total counts in the corresponding time period using addrmf. An average response file is needed becuase a spectral fit using the pre-slew DRM will introduce some errors in both a spectral shape and a normalization if the PHA file contains a lot of the slew/post-slew time interval.
- 3) For fits to more complicated models (e.g. a power-law over a cutoff power-law), the BAT team has decided to require a chi-square improvement of more than 6 for each extra dof.
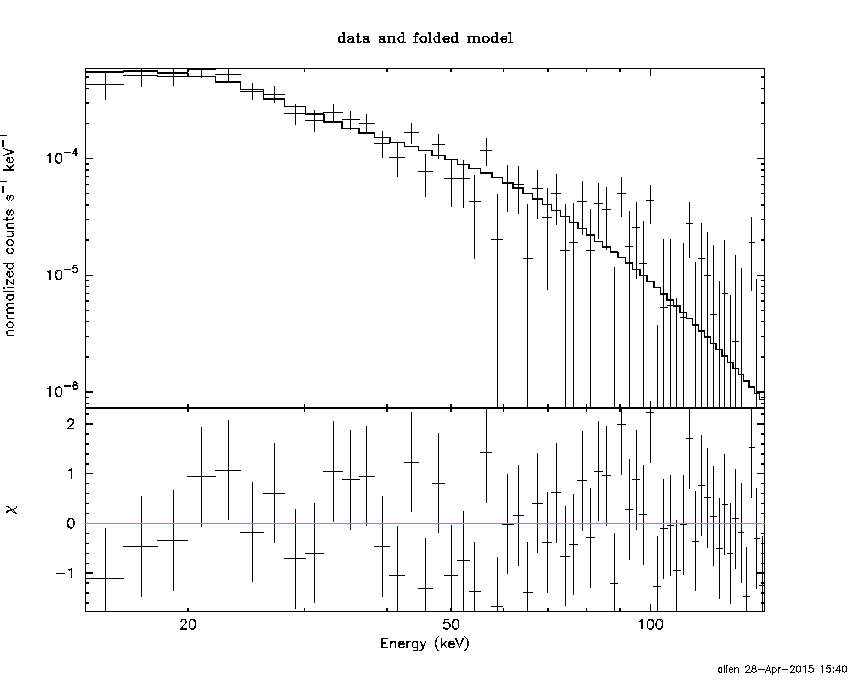
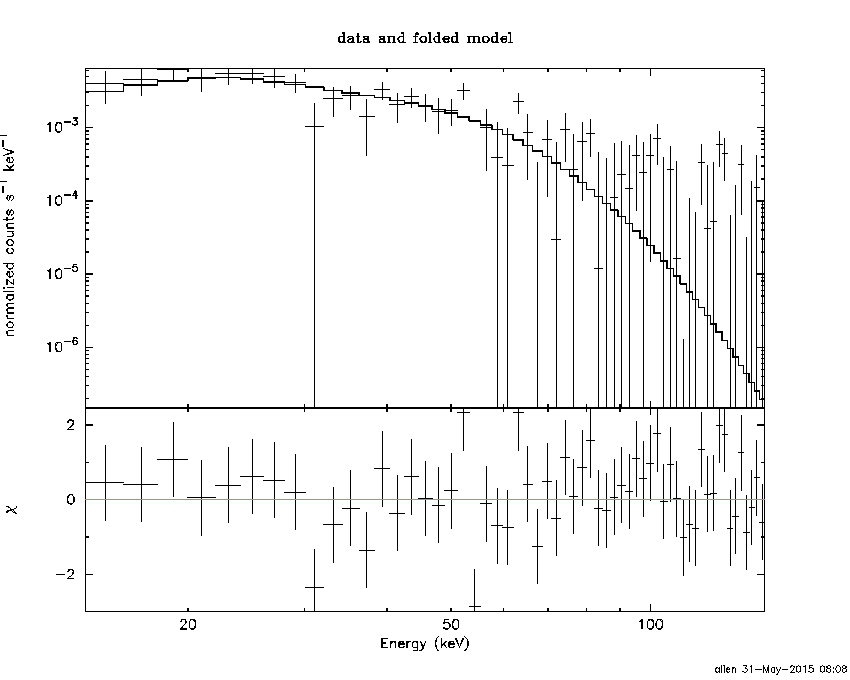
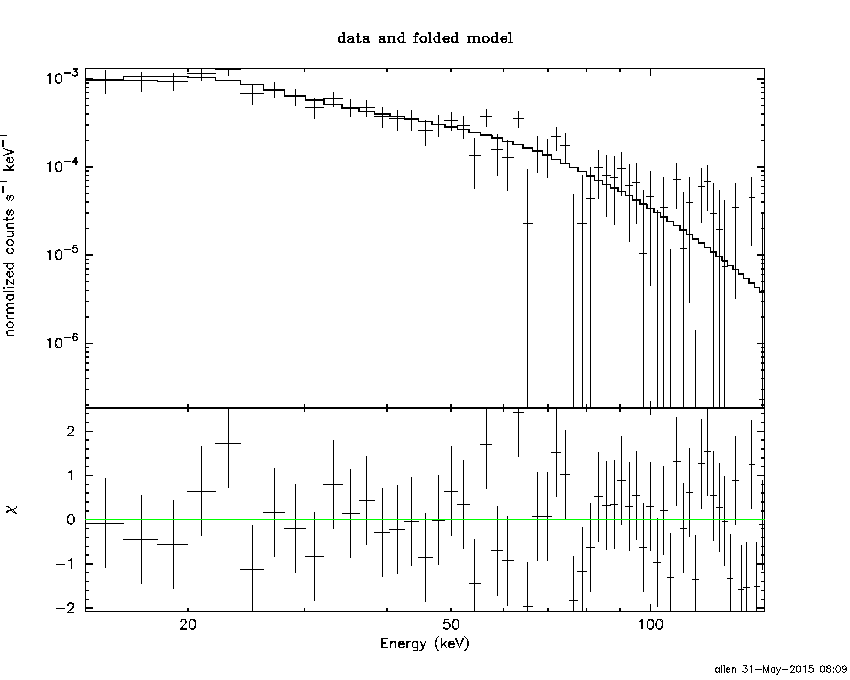
Time averaged spectrum fit using the average DRM
Power-law model

Time interval is from  -71.764 sec. to  318.396 sec.

Spectral model in power-law:
------------------------------------------------------------
Parameters  : value       lower 90%   higher 90%
Photon index: 2.21769     ( -0.143073   0.148643 )
Norm@50keV  : 6.27201E-04    ( -6.1967e-05   6.12051e-05 )
------------------------------------------------------------
#Fit statistic : Chi-Squared =          54.52 using 59 PHA bins.
# Reduced chi-squared =         0.9565 for     57 degrees of freedom
# Null hypothesis probability =   5.686496e-01

Photon flux (15-150 keV)    in 390.2 sec: 0.104811 ( -0.00744758  0.00745144 ) ph/cm2/s
Energy fluence (15-150 keV)             : 2.3069e-06 ( -1.93304e-07  1.96934e-07 ) ergs/cm2
Cutoff power-law model
Time interval is from  -71.764 sec. to  318.396 sec.
Spectral model in the cutoff power-law:
------------------------------------------------------------
Parameters  : value       lower 90%   higher 90%
Photon index: 1.64949     ( -0.753899   0.355382 )
Epeak [keV] : 23.3019      ( -21.5723 11.3558 )
Norm@50keV  : 1.39310E-03    ( -0.000606137   0.00269357 )
------------------------------------------------------------
#Fit statistic : Chi-Squared =          51.93 using 59 PHA bins.
# Reduced chi-squared =         0.9273 for     56 degrees of freedom
# Null hypothesis probability =   6.297710e-01

Photon flux (15-150 keV)    in 390.2 sec: 0.102044 ( -0.0079718  0.007972 ) ph/cm2/s
Energy fluence (15-150 keV)             : 2.14558e-06 ( -2.42018e-07  2.56408e-07 ) ergs/cm2
Band function

Time interval is from  -71.764 sec. to  318.396 sec.

Spectral model in the Band function:
------------------------------------------------------------
Parameters  : value       lower 90%   higher 90%
alpha       : -1.65351   ( 1.70188   0.268192 )
beta        : -10.0000    ( 10   3.55271e-15 )
Epeak [keV] : 23.2450      ( -10.9978 11.4153 )
Norm@50keV   : 1.38350E-03    ( -0.000606405   0.00270555 )
------------------------------------------------------------
#Fit statistic : Chi-Squared =          51.93 using 59 PHA bins.
# Reduced chi-squared =         0.9441 for     55 degrees of freedom
# Null hypothesis probability =   5.928107e-01

Photon flux (15-150 keV)    in 390.2 sec:  (    ) ph/cm2/s
Energy fluence (15-150 keV)             : 2.21306e-06 ( -2.21033e-06  -2.07032e-07 ) ergs/cm2
Single BB
Spectral model blackbody:
------------------------------------------------------------
Parameters  : value    Lower 90%  Upper 90%
kT [keV]    : 8.19710  (-0.643809  0.70828)
R^2/D10^2   : 0.101087  (-0.0291169   0.040529)
(R is the radius in km and D10 is the distance to the source in units of 10 kpc)
------------------------------------------------------------
#Fit statistic : Chi-Squared =          78.85 using 59 PHA bins.
# Reduced chi-squared =          1.383 for     57 degrees of freedom
# Null hypothesis probability =   2.924935e-02

Energy  Fluence     90% Error
[keV]   [erg/cm2]   [erg/cm2]
15- 25  4.877e-07   5.424e-08
25- 50  8.900e-07   7.745e-08
50-150  2.530e-07   5.781e-08
15-150  1.631e-06   1.426e-07
Thermal bremsstrahlung (OTTB)
Spectral model: thermal bremsstrahlung
------------------------------------------------------------
Parameters  : value         Lower 90%    Upper 90%
kT [keV]    : 44.8161       (-8.15695      11.3333)
Norm        : 0.624090       (-0.0853242     0.102215)
------------------------------------------------------------
#Fit statistic : Chi-Squared =          52.38 using 59 PHA bins.
# Reduced chi-squared =         0.9190 for     57 degrees of freedom
# Null hypothesis probability =   6.487165e-01

Energy  Fluence     90% Error
[keV]   [erg/cm2]   [erg/cm2]
15- 25  5.791e-07   5.521e-08
25- 50  7.984e-07   5.736e-08
50-150  6.964e-07   1.551e-07
15-150  2.074e-06   1.846e-07
Double BB

Spectral model: bbodyrad<1> + bbodyrad<2>
------------------------------------------------------------
Parameters  : value         Lower 90%    Upper 90%
kT1 [keV]   : 6.25886        (-0.953828      0.896356)
R1^2/D10^2  : 0.250886        (-0.0981616      0.179129)
kT2 [keV]   : 23.6024        (-7.34327      14.7065)
R2^2/D10^2  : 9.15596E-04    (-0.000735566   0.00310936)
------------------------------------------------------------
#Fit statistic : Chi-Squared =          47.63 using 59 PHA bins.
# Reduced chi-squared =         0.8659 for     55 degrees of freedom
# Null hypothesis probability =   7.495029e-01

Energy  Fluence     90% Error
[keV]   [erg/cm2]   [erg/cm2]
15- 25  5.757e-07   1.073e-07
25- 50  7.857e-07   1.576e-07
50-150  8.785e-07   4.625e-07
15-150  2.240e-06   6.278e-07
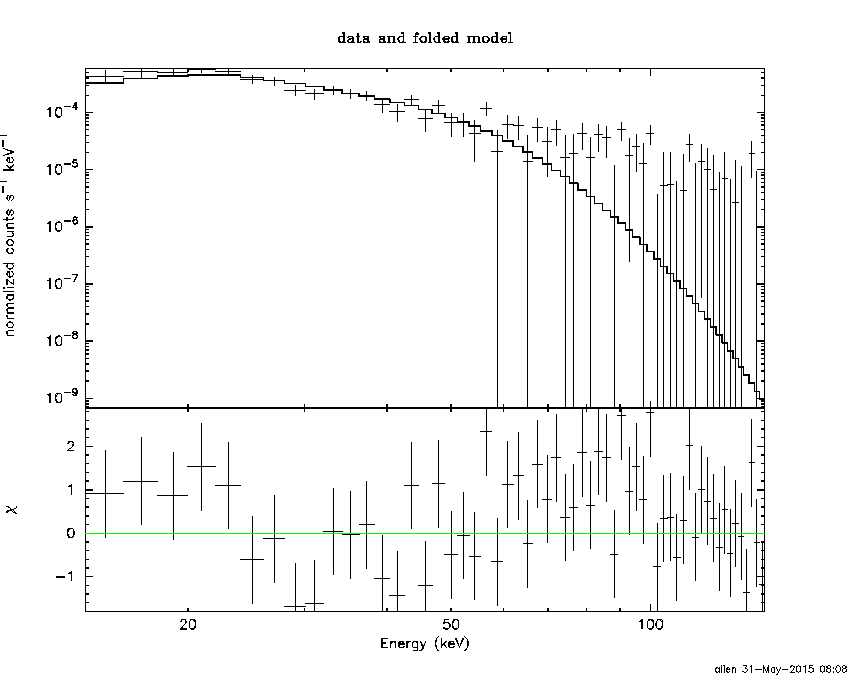
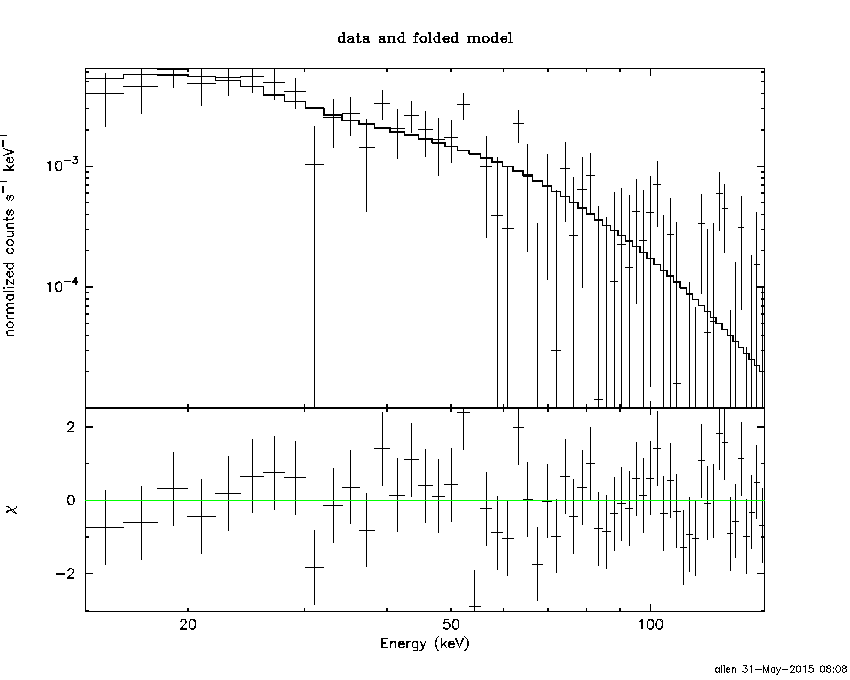
Peak spectrum fit
Power-law model

Time interval is from    1.272 sec. to    2.272 sec.

Spectral model in power-law:
------------------------------------------------------------
Parameters  : value       lower 90%   higher 90%
Photon index: 1.91347     ( -0.225619   0.239108 )
Norm@50keV  : 9.16071E-03    ( -0.00146898   0.00143629 )
------------------------------------------------------------
#Fit statistic : Chi-Squared =          58.39 using 59 PHA bins.
# Reduced chi-squared =          1.024 for     57 degrees of freedom
# Null hypothesis probability =   4.240407e-01

Photon flux (15-150 keV)    in 1 sec: 1.32223 ( -0.174685  0.174736 ) ph/cm2/s
Energy fluence (15-150 keV)             : 8.42345e-08 ( -1.30272e-08  1.33243e-08 ) ergs/cm2
Cutoff power-law model

Time interval is from    1.272 sec. to    2.272 sec.
Spectral model in the cutoff power-law:
------------------------------------------------------------
Parameters  : value       lower 90%   higher 90%
Photon index: 0.718411     ( -1.57435   1.10878 )
Epeak [keV] : 43.8149      ( -11.6548 43.8068 )
Norm@50keV  : 4.58292E-02    ( -0.0458618   0.356413 )
------------------------------------------------------------
#Fit statistic : Chi-Squared =          54.96 using 59 PHA bins.
# Reduced chi-squared =         0.9813 for     56 degrees of freedom
# Null hypothesis probability =   5.144269e-01

Photon flux (15-150 keV)    in 1 sec: 1.27429 ( -0.17872  0.18041 ) ph/cm2/s
Energy fluence (15-150 keV)             : 7.52084e-08 ( -1.40005e-08  1.54991e-08 ) ergs/cm2
Band function
Time interval is from    1.272 sec. to    2.272 sec.

Spectral model in the Band function:
------------------------------------------------------------
Parameters  : value       lower 90%   higher 90%
alpha       : -0.272514   ( -1.40835   0.252156 )
beta        : -2.60450    ( 2.60945   0.697876 )
Epeak [keV] : 39.5757      ( -16.6717 18.0519 )
Norm@50keV   : 9.14630E-02    ( -0.109074   435.058 )
------------------------------------------------------------
#Fit statistic : Chi-Squared =          54.13 using 59 PHA bins.
# Reduced chi-squared =         0.9841 for     55 degrees of freedom
# Null hypothesis probability =   5.079905e-01

Photon flux (15-150 keV)    in 1 sec:  (    ) ph/cm2/s
Energy fluence (15-150 keV)             : 7.74631e-08 ( -7.74561e-08  -1.40834e-08 ) ergs/cm2
Single BB
Spectral model blackbody:
------------------------------------------------------------
Parameters  : value    Lower 90%  Upper 90%
kT [keV]    : 10.1864  (-1.34981  1.57968)
R^2/D10^2   : 0.597838  (-0.254439   0.430692)
(R is the radius in km and D10 is the distance to the source in units of 10 kpc)
------------------------------------------------------------
#Fit statistic : Chi-Squared =          59.99 using 59 PHA bins.
# Reduced chi-squared =          1.052 for     57 degrees of freedom
# Null hypothesis probability =   3.679016e-01

Energy  Fluence     90% Error
[keV]   [erg/cm2]   [erg/cm2]
15- 25  1.271e-08   2.859e-09
25- 50  3.243e-08   5.525e-09
50-150  1.785e-08   6.574e-09
15-150  6.299e-08   1.140e-08
Thermal bremsstrahlung (OTTB)
Spectral model: thermal bremsstrahlung
------------------------------------------------------------
Parameters  : value         Lower 90%    Upper 90%
kT [keV]    : 72.7104       (-23.9794      46.1942)
Norm        : 6.48855       (-1.21354     1.48574)
------------------------------------------------------------
#Fit statistic : Chi-Squared =          55.58 using 59 PHA bins.
# Reduced chi-squared =         0.9751 for     57 degrees of freedom
# Null hypothesis probability =   5.285459e-01

Energy  Fluence     90% Error
[keV]   [erg/cm2]   [erg/cm2]
15- 25  1.671e-08   3.165e-09
25- 50  2.686e-08   4.130e-09
50-150  3.547e-08   1.595e-08
15-150  7.904e-08   1.503e-08
Double BB
Spectral model: bbodyrad<1> + bbodyrad<2>
------------------------------------------------------------
Parameters  : value         Lower 90%    Upper 90%
kT1 [keV]   : 8.10322        (-5.04219      2.33672)
R1^2/D10^2  : 1.16427        (-0.565302      22.9107)
kT2 [keV]   : 27.4887        (-13.438      -28.6503)
R2^2/D10^2  : 6.57590E-03    (-0.00565697   0.407591)
------------------------------------------------------------
#Fit statistic : Chi-Squared =          54.54 using 59 PHA bins.
# Reduced chi-squared =         0.9917 for     55 degrees of freedom
# Null hypothesis probability =   4.921198e-01

Energy  Fluence     90% Error
[keV]   [erg/cm2]   [erg/cm2]
15- 25  1.477e-08   7.929e-09
25- 50  2.983e-08   1.490e-08
50-150  3.356e-08   1.918e-08
15-150  7.817e-08   3.780e-08
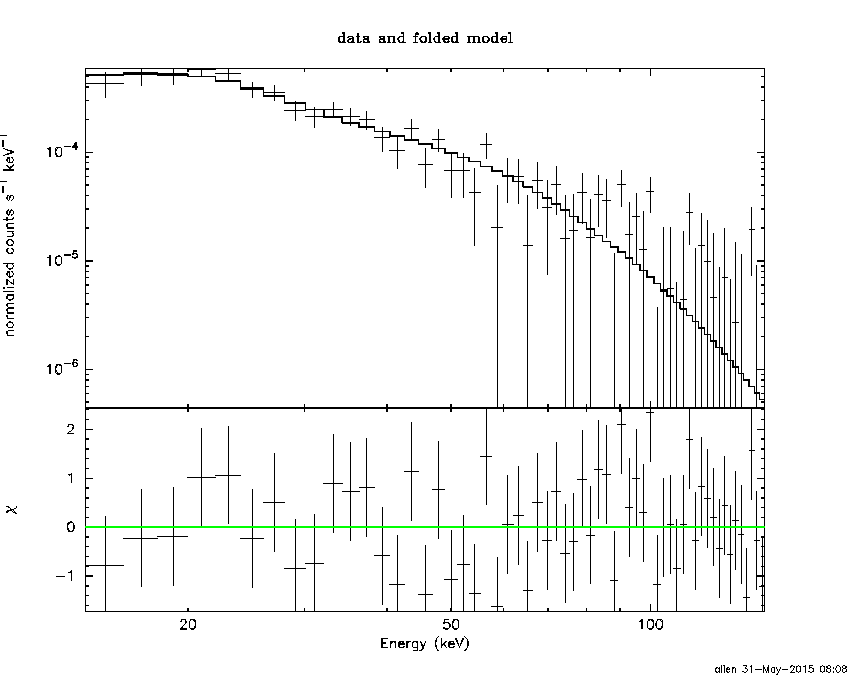
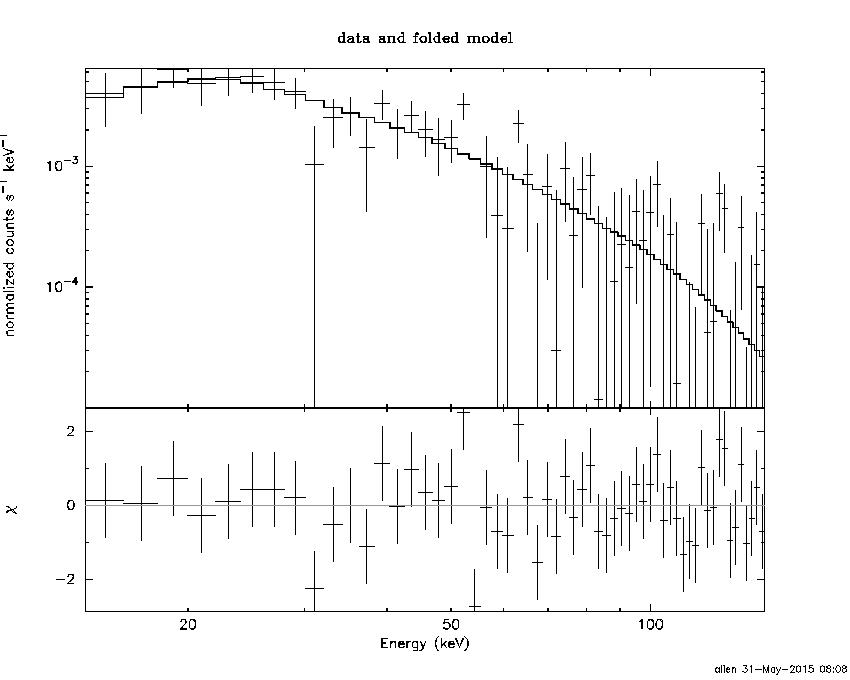
Pre-slew spectrum (Pre-slew PHA with pre-slew DRM)
Power-law model
Spectral model in power-law:
------------------------------------------------------------
Parameters  : value       lower 90%   higher 90%
Photon index: 1.91413     ( -0.143621   0.148152 )
Norm@50keV  : 1.77398E-03    ( -0.00016398   0.000161585 )
------------------------------------------------------------
#Fit statistic : Chi-Squared =          61.28 using 59 PHA bins.
# Reduced chi-squared =          1.075 for     57 degrees of freedom
# Null hypothesis probability =   3.252721e-01

Photon flux (15-150 keV)    in 71.4 sec: 0.256126 ( -0.0200259  0.0200444 ) ph/cm2/s
Energy fluence (15-150 keV)             : 1.16467e-06 ( -1.04697e-07  1.06223e-07 ) ergs/cm2
Cutoff power-law model

Spectral model in the cutoff power-law:
------------------------------------------------------------
Parameters  : value       lower 90%   higher 90%
Photon index: 1.23226     ( -0.693647   0.589504 )
Epeak [keV] : 48.6086      ( -11.2904 38.808 )
Norm@50keV  : 4.27189E-03    ( -0.00223582   0.00614066 )
------------------------------------------------------------
#Fit statistic : Chi-Squared =          57.28 using 59 PHA bins.
# Reduced chi-squared =          1.023 for     56 degrees of freedom
# Null hypothesis probability =   4.275346e-01

Photon flux (15-150 keV)    in 71.4 sec: 0.247718 ( -0.021224  0.021231 ) ph/cm2/s
Energy fluence (15-150 keV)             : 1.08585e-06 ( -1.19709e-07  1.24036e-07 ) ergs/cm2
Band function
Spectral model in the Band function:
------------------------------------------------------------
Parameters  : value       lower 90%   higher 90%
alpha       : -1.23223   ( -0.498323   0.792744 )
beta        : -10.0000    ( 10   1.77636e-15 )
Epeak [keV] : 48.5989      ( -11.2865 26.4298 )
Norm@50keV   : 4.27161E-03    ( -0.00198177   0.00615209 )
------------------------------------------------------------
#Fit statistic : Chi-Squared =          57.28 using 59 PHA bins.
# Reduced chi-squared =          1.041 for     55 degrees of freedom
# Null hypothesis probability =   3.906768e-01

Photon flux (15-150 keV)    in 71.4 sec: 0.248958 (    ) ph/cm2/s
Energy fluence (15-150 keV)             : 1.08715e-06 ( 0  0 ) ergs/cm2
S(25-50 keV) vs. S(50-100 keV) plot
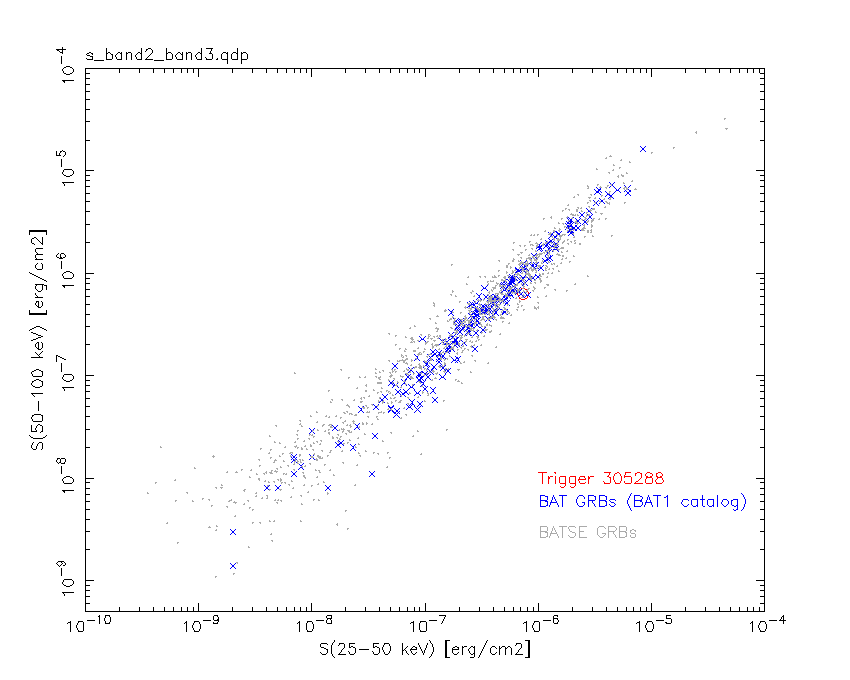
S(25-50 keV)  = 7.33e-07
S(50-100 keV) = 6.31e-07
T90 vs. Hardness ratio plot
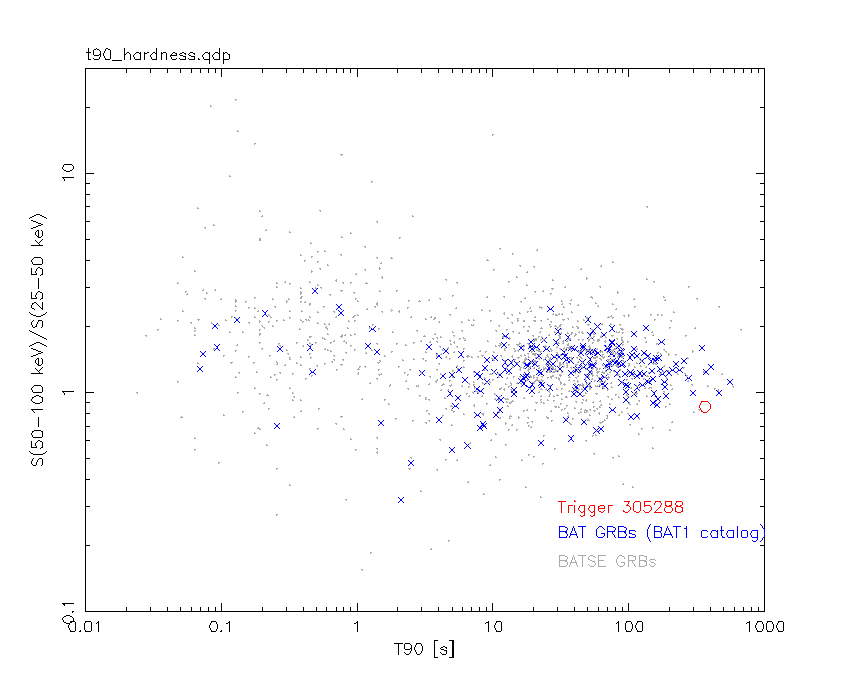
T90                                   = 363.212000012398 sec.
Hardness ratio (energy fluence ratio) = 0.860846
Color vs. Color plot
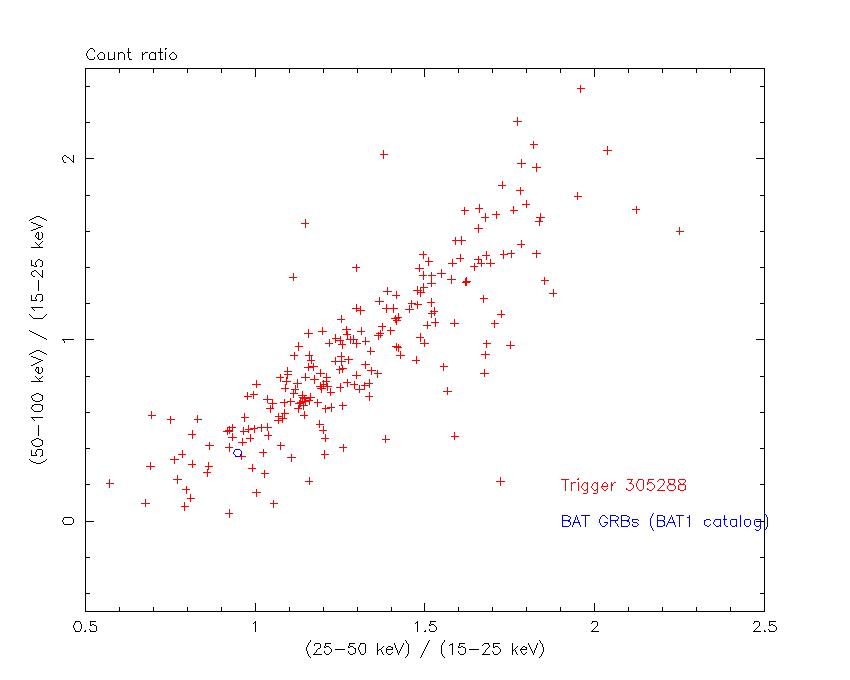
Count Ratio  (25-50 keV) / (15-25 keV) = 0.947645
Count Ratio (50-100 keV) / (15-25 keV) = 0.376563
Mask shadow pattern
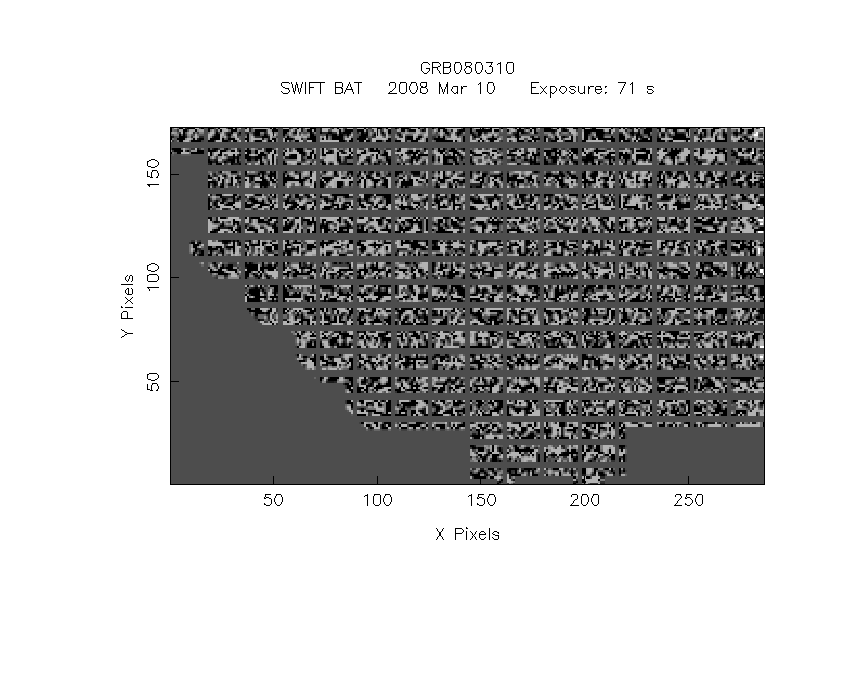
IMX = -4.890763693368319E-01, IMY = -1.957889539151486E-01
TIME vs. PHA plot around the trigger time
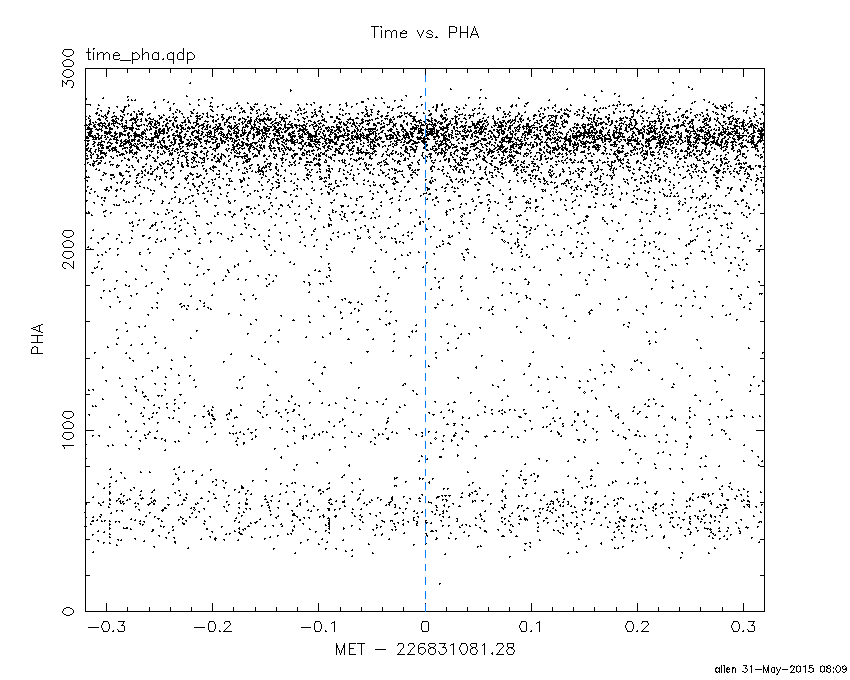
Blue+Cyan dotted lines: Time interval of the scaled map
From 0.000000 to 1.024000
TIME vs. DetID plot around the trigger time
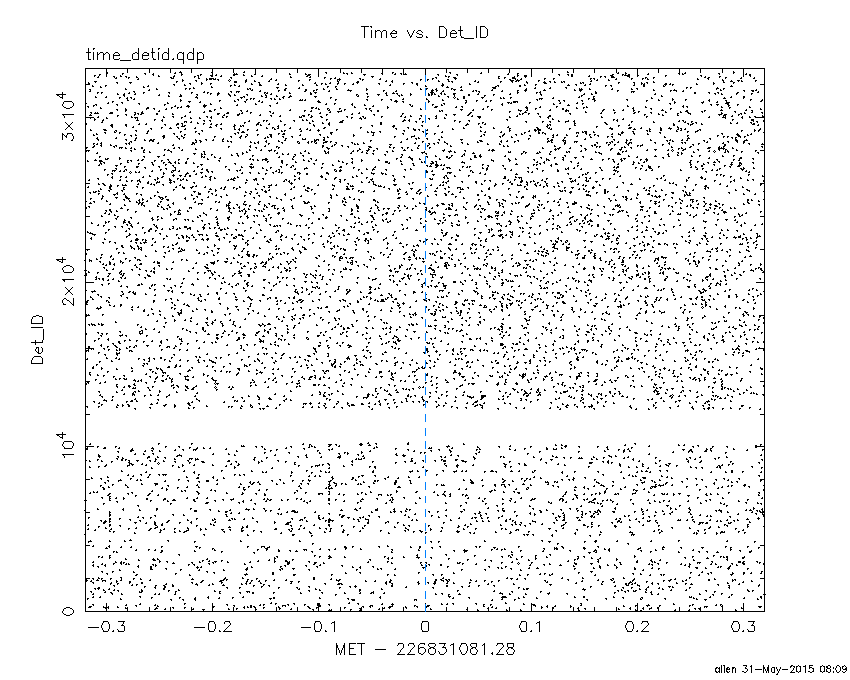
Blue+Cyan dotted lines: Time interval of the scaled map
From 0.000000 to 1.024000
100 us light curve (15-350 keV)

Blue+Cyan dotted lines: Time interval of the scaled map
From 0.000000 to 1.024000
Spacecraft aspect plot

Bright source in the pre-burst/pre-slew/post-slew images
Pre-burst image of 15-350 keV band
Time interval of the image:
Pre-slew background subtracted image of 15-350 keV band
Time interval of the image:
-52.979410 18.420600

# RAcent  DECcent POSerr Theta    Phi  PeakCts   SNR AngSep     Name
#  [deg]    [deg]    ['] [deg]  [deg]                   [']
170.2158 -60.7081    7.0  44.2   -8.3   0.2835   1.7    5.9	Cen X-3
187.0917 -62.7880    5.3  39.5  -18.4   0.3002   2.2   12.0	GX 301-2
244.9760 -15.6467    0.3  31.7 -141.5   4.0246  34.3    0.4	Sco X-1
256.0170 -37.9750    6.0  37.4  -98.9   0.4711   1.9    8.0	4U 1700-377
256.2837 -36.2926    5.7  37.5 -101.7   0.5144   2.0   10.7	GX 349+2
263.0094 -24.7461   78.5  44.6 -118.2  -0.0566  -0.1    0.0	GX 1+4
220.0414  -0.1646    0.6  27.8  158.2   2.2880  18.6 ------	UNKNOWN
226.0544   2.7072    2.2  32.3  167.9   0.6764   5.3 ------	UNKNOWN
248.8935 -69.3576    2.7  47.1  -53.2   1.7976   4.3 ------	UNKNOWN
263.4887 -18.9675    2.4  46.8 -125.7   1.9235   4.7 ------	UNKNOWN
Post-slew image of 15-350 keV band
Time interval of the image:
77.820590 962.786400

# RAcent  DECcent POSerr Theta    Phi  PeakCts   SNR AngSep     Name
#  [deg]    [deg]    ['] [deg]  [deg]                   [']
244.9716 -15.6393    0.2  29.0  -61.7  51.3216  70.9    0.5	Sco X-1
254.4613  35.2392    5.0  47.8 -146.6   3.1228   2.3    6.2	Her X-1
256.0191 -37.8089    3.5  50.1  -42.3   7.4219   3.3    2.6	4U 1700-377
256.4638 -36.4250    9.8  49.5  -44.0   2.5532   1.2    1.4	GX 349+2
189.4888  25.4800    4.4  39.1  128.2   4.3322   2.6 ------	UNKNOWN
220.1032  -0.1698    1.9   0.0 -131.1   3.1295   6.1 ------	UNKNOWN
229.4442 -58.2514    2.3  58.5  -10.8  15.2502   5.0 ------	UNKNOWN
261.0784  -1.7162    3.0  41.0  -92.7  10.2816   3.9 ------	UNKNOWN
Plot creation:
Sun May 31 08:10:05 EDT 2015