Click here for the BAT GCN circular template
Image
Pre-slew 15.0-350.0 keV image (Event data)

#   RAcent    DECcent   POSerr    Theta     Phi              Peak Cts       SNR   Name
  206.3437    44.0743   0.0101    52.8353    14.9556         6.2527644     18.978 TRIG_00306754

Foreground time interval of the image:
 -0.376  49.000 (delta_t =  49.376 [sec])
Background time interval of the image:
-239.704 -177.664 (delta_t =  62.040 [sec])
-119.704  -0.376 (delta_t = 119.328 [sec])
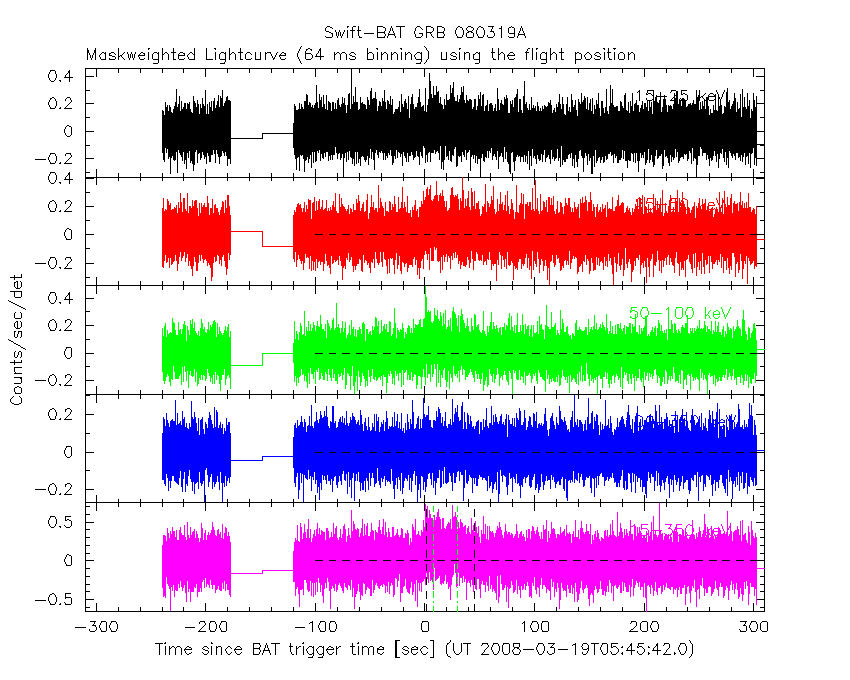
Lightcurves
Notes:
- 1) The mask-weighted light curves are using the flight position.
- 2) Multiple plots of different time binning/intervals are shown to cover all scenarios of short/long GRBs, rate/image triggers, and real/false positives.
- 3) For all the mask-weighted lightcurves, the y-axis units are counts/sec/det where a det is 0.4 x 0.4 = 0.16 sq cm.
- 4) The verticle lines correspond to following: green dotted lines are T50 interval, black dotted lines are T90 interval, blue solid line(s) is a spacecraft slew start time, and orange solid line(s) is a spacecraft slew end time.
- 5) Time of each bin is in the middle of the bin.
1 s binning
From T0-310 s to T0+310 s

From T100_start - 20 s to T100_end + 30 s

Full time interval

64 ms binning
Full time interval
From T100_start to T100_end

From T0-5 sec to T0+5 sec

16 ms binning
From T100_start-5 s to T100_start+5 s

Blue+Cyan dotted lines: Time interval of the scaled map
From 0.000000 to 12.160000
8 ms binning
From T100_start-3 s to T100_start+3 s

Blue+Cyan dotted lines: Time interval of the scaled map
From 0.000000 to 12.160000
2 ms binning
From T100_start-1 s to T100_start+1 s

Blue+Cyan dotted lines: Time interval of the scaled map
From 0.000000 to 12.160000
SN=5 or 10 sec. binning (whichever binning is satisfied first)

SN=5 or 10 sec. binning (T < 200 sec)

Quad-rate summed light curves (from T0-300s to T0+1000s)

Spectral Evolution

Spectra
Notes:
- 1) The fitting includes the systematic errors.
- 2) When the burst includes telescope slew time periods, the fitting uses an average response file made from multiple 5-s response files through out the slew time plus single time preiod for the non-slew times, and weighted by the total counts in the corresponding time period using addrmf. An average response file is needed becuase a spectral fit using the pre-slew DRM will introduce some errors in both a spectral shape and a normalization if the PHA file contains a lot of the slew/post-slew time interval.
- 3) For fits to more complicated models (e.g. a power-law over a cutoff power-law), the BAT team has decided to require a chi-square improvement of more than 6 for each extra dof.
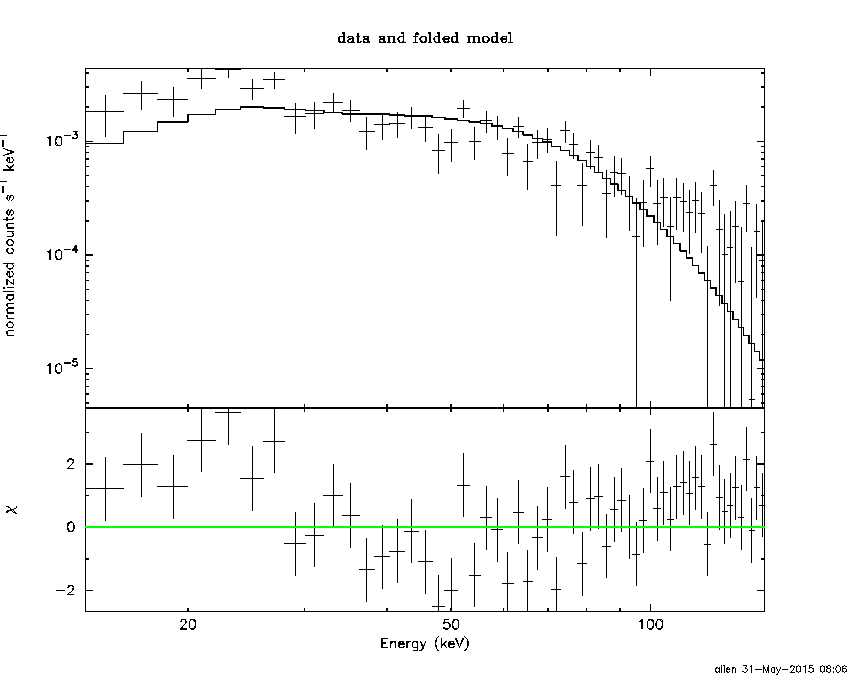
Time averaged spectrum fit using the average DRM
Power-law model

Time interval is from   -0.376 sec. to   49.000 sec.

Spectral model in power-law:
------------------------------------------------------------
Parameters  : value       lower 90%   higher 90%
Photon index: 1.54288     ( -0.115603   0.1157 )
Norm@50keV  : 9.56213E-03    ( -0.000641406   0.000641074 )
------------------------------------------------------------
#Fit statistic : Chi-Squared =          54.31 using 59 PHA bins.
# Reduced chi-squared =         0.9529 for     57 degrees of freedom
# Null hypothesis probability =   5.764778e-01

Photon flux (15-150 keV)    in 49.38 sec: 1.20803 ( -0.0878058  0.0881178 ) ph/cm2/s
Energy fluence (15-150 keV)             : 4.4497e-06 ( -3.11928e-07  3.12488e-07 ) ergs/cm2
Cutoff power-law model

Time interval is from   -0.376 sec. to   49.000 sec.
Spectral model in the cutoff power-law:
------------------------------------------------------------
Parameters  : value       lower 90%   higher 90%
Photon index: 1.32411     ( -0.478443   0.279839 )
Epeak [keV] : 167.665      (   )
Norm@50keV  : 1.21459E-02    (     )
------------------------------------------------------------
#Fit statistic : Chi-Squared =          53.60 using 59 PHA bins.
# Reduced chi-squared =         0.9572 for     56 degrees of freedom
# Null hypothesis probability =   5.662317e-01

Photon flux (15-150 keV)    in 49.38 sec: 1.19535 ( -0.09123  0.09145 ) ph/cm2/s
Energy fluence (15-150 keV)             : 4.41085e-06 ( -3.25548e-07  3.23834e-07 ) ergs/cm2
Band function

Time interval is from   -0.376 sec. to   49.000 sec.

Spectral model in the Band function:
------------------------------------------------------------
Parameters  : value       lower 90%   higher 90%
alpha       : 4.92366   ( -4.92366   -4.92366 )
beta        : -1.60495    ( -0.131225   0.128019 )
Epeak [keV] : 24.9039      ( -7.27013 4.052 )
Norm@50keV   : 926.698    ( -61.8906   4.38e+06 )
------------------------------------------------------------
#Fit statistic : Chi-Squared =          52.03 using 59 PHA bins.
# Reduced chi-squared =         0.9461 for     55 degrees of freedom
# Null hypothesis probability =   5.887163e-01

Photon flux (15-150 keV)    in 49.38 sec:  (    ) ph/cm2/s
Energy fluence (15-150 keV)             : 0 ( 0  0 ) ergs/cm2
Single BB
Spectral model blackbody:
------------------------------------------------------------
Parameters  : value    Lower 90%  Upper 90%
kT [keV]    : 16.5719  (-1.36076  1.49736)
R^2/D10^2   : 9.51989E-02  (-0.0254738   0.0343353)
(R is the radius in km and D10 is the distance to the source in units of 10 kpc)
------------------------------------------------------------
#Fit statistic : Chi-Squared =         108.53 using 59 PHA bins.
# Reduced chi-squared =         1.9041 for     57 degrees of freedom
# Null hypothesis probability =   4.632752e-05

Energy  Fluence     90% Error
[keV]   [erg/cm2]   [erg/cm2]
15- 25  2.647e-07   3.266e-08
25- 50  1.147e-06   1.084e-07
50-150  2.230e-06   2.429e-07
15-150  3.642e-06   3.029e-07
Thermal bremsstrahlung (OTTB)

Spectral model: thermal bremsstrahlung
------------------------------------------------------------
Parameters  : value         Lower 90%    Upper 90%
kT [keV]    : 200.000       (      )
Norm        : 4.93554       (-0.331289     0.33129)
------------------------------------------------------------
#Fit statistic : Chi-Squared =          54.06 using 59 PHA bins.
# Reduced chi-squared =         0.9485 for     57 degrees of freedom
# Null hypothesis probability =   5.860137e-01

Energy  Fluence     90% Error
[keV]   [erg/cm2]   [erg/cm2]
15- 25  6.086e-07   5.136e-08
25- 50  1.171e-06   9.432e-08
50-150  2.568e-06   5.121e-07
15-150  4.347e-06   6.691e-07
Double BB

Spectral model: bbodyrad<1> + bbodyrad<2>
------------------------------------------------------------
Parameters  : value         Lower 90%    Upper 90%
kT1 [keV]   : 6.50557        (-1.36967      1.85568)
R1^2/D10^2  : 1.63095        (-0.937751      2.38158)
kT2 [keV]   : 25.4688        (-4.02117      7.31659)
R2^2/D10^2  : 1.70444E-02    (-0.0102471   0.0156043)
------------------------------------------------------------
#Fit statistic : Chi-Squared =          54.49 using 59 PHA bins.
# Reduced chi-squared =         0.9907 for     55 degrees of freedom
# Null hypothesis probability =   4.941000e-01

Energy  Fluence     90% Error
[keV]   [erg/cm2]   [erg/cm2]
15- 25  5.981e-07   2.137e-07
25- 50  1.134e-06   2.849e-07
50-150  2.654e-06   6.777e-07
15-150  4.387e-06   8.960e-07
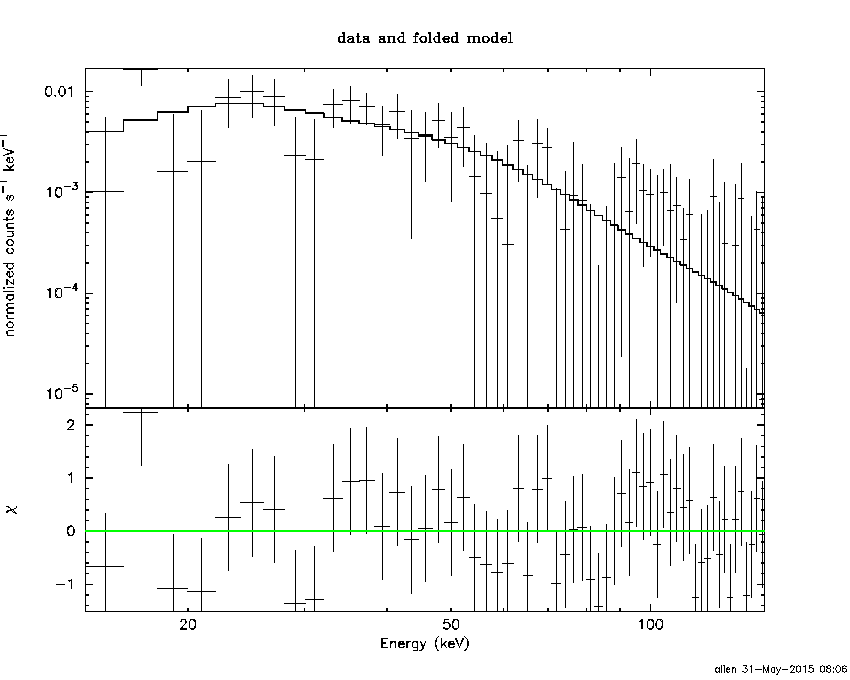
Peak spectrum fit
Power-law model

Time interval is from    4.156 sec. to    5.156 sec.

Spectral model in power-law:
------------------------------------------------------------
Parameters  : value       lower 90%   higher 90%
Photon index: 1.95824     ( -0.337845   0.367016 )
Norm@50keV  : 1.76300E-02    ( -0.00442197   0.00433613 )
------------------------------------------------------------
#Fit statistic : Chi-Squared =          44.13 using 59 PHA bins.
# Reduced chi-squared =         0.7741 for     57 degrees of freedom
# Null hypothesis probability =   8.938020e-01

Photon flux (15-150 keV)    in 1 sec: 2.59514 ( -0.617219  0.620181 ) ph/cm2/s
Energy fluence (15-150 keV)             : 1.6228e-07 ( -3.93353e-08  3.96696e-08 ) ergs/cm2
Cutoff power-law model

Time interval is from    4.156 sec. to    5.156 sec.
Spectral model in the cutoff power-law:
------------------------------------------------------------
Parameters  : value       lower 90%   higher 90%
Photon index: -1.32714     ( -7.43098   2.68737 )
Epeak [keV] : 44.8104      ( -8.20303 15.9463 )
Norm@50keV  : 1.09736    ( -1.44139   14161.2 )
------------------------------------------------------------
#Fit statistic : Chi-Squared =          38.67 using 59 PHA bins.
# Reduced chi-squared =         0.6906 for     56 degrees of freedom
# Null hypothesis probability =   9.624759e-01

Photon flux (15-150 keV)    in 1 sec: 2.39587 ( -0.68388  0.66271 ) ph/cm2/s
Energy fluence (15-150 keV)             : 1.43149e-07 ( -4.0629e-08  4.4553e-08 ) ergs/cm2
Band function

Time interval is from    4.156 sec. to    5.156 sec.

Spectral model in the Band function:
------------------------------------------------------------
Parameters  : value       lower 90%   higher 90%
alpha       : 4.47171   ( -5.10745   -4.47171 )
beta        : -3.45257    ( 3.45257   1.03877 )
Epeak [keV] : 40.7894      ( -6.3907 6.74989 )
Norm@50keV   : 74.9220    ( -16.2081   559.378 )
------------------------------------------------------------
#Fit statistic : Chi-Squared =          37.28 using 59 PHA bins.
# Reduced chi-squared =         0.6779 for     55 degrees of freedom
# Null hypothesis probability =   9.677989e-01

Photon flux (15-150 keV)    in 1 sec:  (    ) ph/cm2/s
Energy fluence (15-150 keV)             : 1.51431e-07 ( 0  0 ) ergs/cm2
Single BB

Spectral model blackbody:
------------------------------------------------------------
Parameters  : value    Lower 90%  Upper 90%
kT [keV]    : 11.3907  (-2.047  2.46781)
R^2/D10^2   : 0.848356  (-0.460219   0.945164)
(R is the radius in km and D10 is the distance to the source in units of 10 kpc)
------------------------------------------------------------
#Fit statistic : Chi-Squared =          38.70 using 59 PHA bins.
# Reduced chi-squared =         0.6789 for     57 degrees of freedom
# Null hypothesis probability =   9.697794e-01

Energy  Fluence     90% Error
[keV]   [erg/cm2]   [erg/cm2]
15- 25  2.314e-08   8.665e-09
25- 50  6.838e-08   2.637e-08
50-150  5.144e-08   2.519e-08
15-150  1.430e-07   5.260e-08
Thermal bremsstrahlung (OTTB)

Spectral model: thermal bremsstrahlung
------------------------------------------------------------
Parameters  : value         Lower 90%    Upper 90%
kT [keV]    : 73.5293       (-30.2634      73.9861)
Norm        : 13.0541       (-3.79068     5.05403)
------------------------------------------------------------
#Fit statistic : Chi-Squared =          41.47 using 59 PHA bins.
# Reduced chi-squared =         0.7276 for     57 degrees of freedom
# Null hypothesis probability =   9.392189e-01

Energy  Fluence     90% Error
[keV]   [erg/cm2]   [erg/cm2]
15- 25  3.365e-08   1.109e-08
25- 50  5.425e-08   1.529e-08
50-150  7.222e-08   4.919e-08
15-150  1.601e-07   5.904e-08
Double BB
------------------------------------------------------------
#Fit statistic : Chi-Squared =          38.70 using 59 PHA bins.
#Fit statistic : Chi-Squared =          38.66 using 59 PHA bins.
#Fit statistic : Chi-Squared =          38.56 using 59 PHA bins.
#Fit statistic : Chi-Squared =          37.66 using 59 PHA bins.
# Reduced chi-squared =         0.7036 for     55 degrees of freedom
# Reduced chi-squared =         0.7029 for     55 degrees of freedom
# Reduced chi-squared =         0.7011 for     55 degrees of freedom
# Reduced chi-squared =         0.6847 for     55 degrees of freedom
# Null hypothesis probability =   9.531255e-01
# Null hypothesis probability =   9.536244e-01
# Null hypothesis probability =   9.547603e-01
# Null hypothesis probability =   9.643263e-01

Energy  Fluence     90% Error
[keV]   [erg/cm2]   [erg/cm2]
15- 25  0.000e+00   0.000e+00
25- 50  0.000e+00   0.000e+00
50-150  0.000e+00   0.000e+00
15-150  0.000e+00   0.000e+00
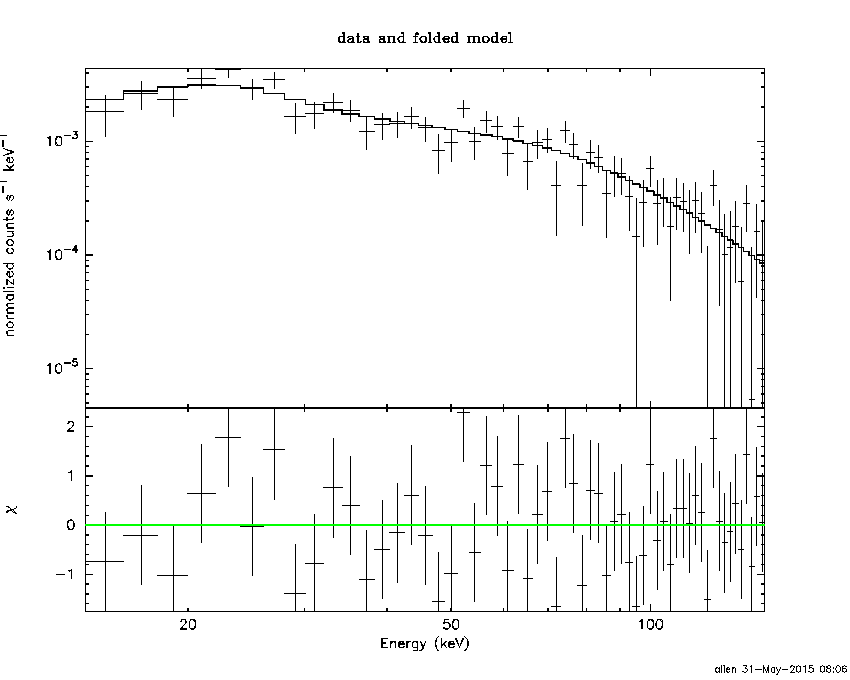
Pre-slew spectrum (Pre-slew PHA with pre-slew DRM)
Power-law model

Spectral model in power-law:
------------------------------------------------------------
Parameters  : value       lower 90%   higher 90%
Photon index: 1.54288     ( -0.115603   0.1157 )
Norm@50keV  : 9.56213E-03    ( -0.000641406   0.000641074 )
------------------------------------------------------------
#Fit statistic : Chi-Squared =          54.31 using 59 PHA bins.
# Reduced chi-squared =         0.9529 for     57 degrees of freedom
# Null hypothesis probability =   5.764778e-01

Photon flux (15-150 keV)    in 49.38 sec: 1.20803 ( -0.0878058  0.0881178 ) ph/cm2/s
Energy fluence (15-150 keV)             : 4.4497e-06 ( -3.11928e-07  3.12488e-07 ) ergs/cm2
Cutoff power-law model
Spectral model in the cutoff power-law:
------------------------------------------------------------
Parameters  : value       lower 90%   higher 90%
Photon index: 1.32411     ( -0.478443   0.279839 )
Epeak [keV] : 167.665      (   )
Norm@50keV  : 1.21459E-02    (     )
------------------------------------------------------------
#Fit statistic : Chi-Squared =          53.60 using 59 PHA bins.
# Reduced chi-squared =         0.9572 for     56 degrees of freedom
# Null hypothesis probability =   5.662317e-01

Photon flux (15-150 keV)    in 49.38 sec: 1.19535 ( -0.09123  0.09145 ) ph/cm2/s
Energy fluence (15-150 keV)             : 4.41085e-06 ( -3.25548e-07  3.23834e-07 ) ergs/cm2
Band function

Spectral model in the Band function:
------------------------------------------------------------
Parameters  : value       lower 90%   higher 90%
alpha       : 4.92366   ( -4.92366   -4.92366 )
beta        : -1.60495    ( -0.131225   0.128019 )
Epeak [keV] : 24.9039      ( -7.3073 4.05198 )
Norm@50keV   : 926.698    ( -61.8906   4.38032e+06 )
------------------------------------------------------------
#Fit statistic : Chi-Squared =          52.03 using 59 PHA bins.
# Reduced chi-squared =         0.9461 for     55 degrees of freedom
# Null hypothesis probability =   5.887163e-01

Photon flux (15-150 keV)    in 49.38 sec:  (    ) ph/cm2/s
Energy fluence (15-150 keV)             : 0 ( 0  0 ) ergs/cm2
S(25-50 keV) vs. S(50-100 keV) plot
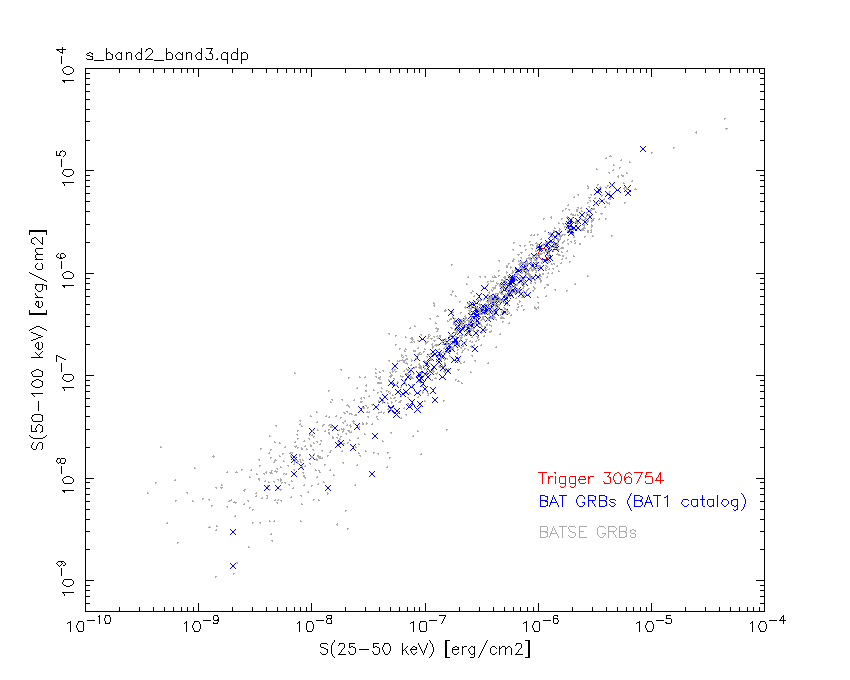
S(25-50 keV)  = 1.12e-06
S(50-100 keV) = 1.54e-06
T90 vs. Hardness ratio plot

T90                                   = 43.6159999668598 sec.
Hardness ratio (energy fluence ratio) = 1.375
Color vs. Color plot

Count Ratio  (25-50 keV) / (15-25 keV) = 1.48546
Count Ratio (50-100 keV) / (15-25 keV) = 1.33336
Mask shadow pattern

IMX = 1.274452504749787E+00, IMY = -3.404304836468816E-01
TIME vs. PHA plot around the trigger time

Blue+Cyan dotted lines: Time interval of the scaled map
From 0.000000 to 12.160000
TIME vs. DetID plot around the trigger time

Blue+Cyan dotted lines: Time interval of the scaled map
From 0.000000 to 12.160000
100 us light curve (15-350 keV)

Blue+Cyan dotted lines: Time interval of the scaled map
From 0.000000 to 12.160000
Spacecraft aspect plot

Bright source in the pre-burst/pre-slew/post-slew images
Pre-burst image of 15-350 keV band
Time interval of the image:
-239.704000 -177.664300
-119.704000 -0.376000

# RAcent  DECcent POSerr Theta    Phi  PeakCts   SNR AngSep     Name
#  [deg]    [deg]    ['] [deg]  [deg]                   [']
 83.6304  22.0150    0.7  47.8 -133.9   7.5070  16.2    0.2	Crab
178.7476  29.4985    2.6  35.8   44.2   0.9348   4.4 ------	UNKNOWN
119.0681 -11.0036    2.2  49.1  160.3   2.0252   5.3 ------	UNKNOWN
165.7920  35.1868    2.6  23.8   38.6   0.6028   4.4 ------	UNKNOWN
200.6181  49.0104    2.2  48.0    9.8   1.4508   5.1 ------	UNKNOWN
138.4723  28.6295    2.5   6.7  123.2   0.5460   4.6 ------	UNKNOWN
 86.5605  -0.8268    3.4  58.9 -159.2   3.0364   3.5 ------	UNKNOWN
Pre-slew background subtracted image of 15-350 keV band
Time interval of the image:
-0.376000 49.000000

# RAcent  DECcent POSerr Theta    Phi  PeakCts   SNR AngSep     Name
#  [deg]    [deg]    ['] [deg]  [deg]                   [']
 83.5115  22.2139    0.0  47.8 -133.6  -0.4482  -1.8   13.7	Crab
206.3436  44.0742    0.6  52.8   15.0   6.2531  19.0 ------	UNKNOWN
Post-slew image of 15-350 keV band
Time interval of the image:
540.796600 662.377100
720.296000 962.303800

# RAcent  DECcent POSerr Theta    Phi  PeakCts   SNR AngSep     Name
#  [deg]    [deg]    ['] [deg]  [deg]                   [']
254.4551  35.3396   38.5  37.5  -40.0  -0.0958  -0.3    0.2	Her X-1
195.5884  52.3229    3.4  10.9 -163.7   0.6481   3.4 ------	UNKNOWN
269.9378  31.2048    2.9  50.7  -44.6   5.3199   4.0 ------	UNKNOWN
Plot creation:
Sun May 31 08:07:23 EDT 2015