Special notes of this burst
Image
Pre-slew 15.0-350.0 keV image (Event data)
#   RAcent    DECcent   POSerr    Theta     Phi              Peak Cts       SNR   Name
  217.9192    36.2999   0.0014    11.7371     0.8665        25.3558505    140.157 TRIG_00306757

Foreground time interval of the image:
 -3.844  13.797 (delta_t =  17.641 [sec])
Background time interval of the image:
-239.904  -3.844 (delta_t = 236.060 [sec])
Lightcurves
Notes:
- 1) The mask-weighted light curves are using the flight position.
- 2) Multiple plots of different time binning/intervals are shown to cover all scenarios of short/long GRBs, rate/image triggers, and real/false positives.
- 3) For all the mask-weighted lightcurves, the y-axis units are counts/sec/det where a det is 0.4 x 0.4 = 0.16 sq cm.
- 4) The verticle lines correspond to following: green dotted lines are T50 interval, black dotted lines are T90 interval, blue solid line(s) is a spacecraft slew start time, and orange solid line(s) is a spacecraft slew end time.
- 5) Time of each bin is in the middle of the bin.
1 s binning
From T0-310 s to T0+310 s
From T100_start - 20 s to T100_end + 30 s
Full time interval
64 ms binning
Full time interval
From T100_start to T100_end
From T0-5 sec to T0+5 sec
16 ms binning
From T100_start-5 s to T100_start+5 s
Blue+Cyan dotted lines: Time interval of the scaled map
From 0.000000 to 1.024000
8 ms binning
From T100_start-3 s to T100_start+3 s
Blue+Cyan dotted lines: Time interval of the scaled map
From 0.000000 to 1.024000
2 ms binning
From T100_start-1 s to T100_start+1 s
Blue+Cyan dotted lines: Time interval of the scaled map
From 0.000000 to 1.024000
SN=5 or 10 sec. binning (whichever binning is satisfied first)
SN=5 or 10 sec. binning (T < 200 sec)
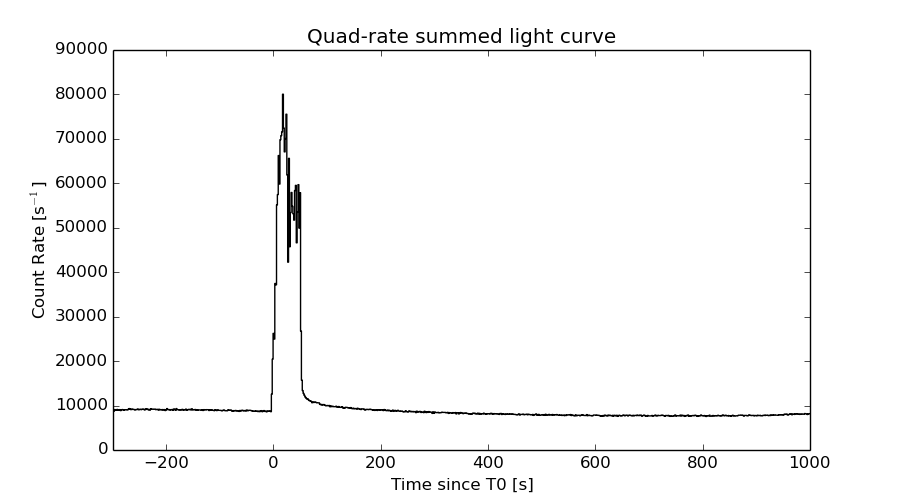
Quad-rate summed light curves (from T0-300s to T0+1000s)
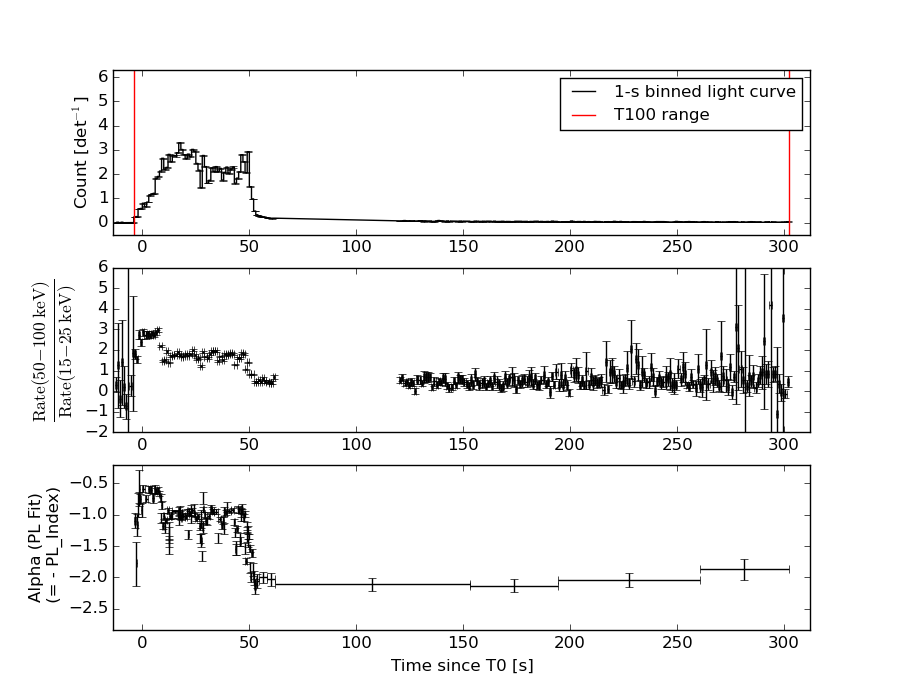
Spectral Evolution
Spectra
Notes:
- 1) The fitting includes the systematic errors.
- 2) When the burst includes telescope slew time periods, the fitting uses an average response file made from multiple 5-s response files through out the slew time plus single time preiod for the non-slew times, and weighted by the total counts in the corresponding time period using addrmf. An average response file is needed becuase a spectral fit using the pre-slew DRM will introduce some errors in both a spectral shape and a normalization if the PHA file contains a lot of the slew/post-slew time interval.
- 3) For fits to more complicated models (e.g. a power-law over a cutoff power-law), the BAT team has decided to require a chi-square improvement of more than 6 for each extra dof.
Time averaged spectrum fit using the average DRM
Power-law model

Multiple GTIs in the spectrum
tstart tstop
-3.844000 62.196000
120.096000 302.048000

Spectral model in power-law:
------------------------------------------------------------
Parameters  : value       lower 90%   higher 90%
Photon index: 1.03879     ( -0.0193978   0.0192978 )
Norm@50keV  : 3.23134E-02    ( -0.000403656   0.000401333 )
------------------------------------------------------------
#Fit statistic : Chi-Squared =          39.72 using 59 PHA bins.
# Reduced chi-squared =         0.6969 for     57 degrees of freedom
# Null hypothesis probability =   9.602986e-01

Photon flux (15-150 keV)    in 248 sec: 3.72905 ( -0.0495915  0.0499229 ) ph/cm2/s
Energy fluence (15-150 keV)             : 8.54953e-05 ( -8.355e-07  8.35624e-07 ) ergs/cm2
Cutoff power-law model
Multiple GTIs in the spectrum
tstart tstop
-3.844000 62.196000
120.096000 302.048000
Spectral model in the cutoff power-law:
------------------------------------------------------------
Parameters  : value       lower 90%   higher 90%
Photon index: 1.03184     ( -0.0203756   0.0225957 )
Epeak [keV] : 9996.10      (   )
Norm@50keV  : 3.24907E-02    ( -0.000349141   0.000257516 )
------------------------------------------------------------
#Fit statistic : Chi-Squared =          41.10 using 59 PHA bins.
# Reduced chi-squared =         0.7340 for     56 degrees of freedom
# Null hypothesis probability =   9.321325e-01

Photon flux (15-150 keV)    in 248 sec: 3.72628 ( -0.04964  0.04979 ) ph/cm2/s
Energy fluence (15-150 keV)             : 8.55456e-05 ( -8.494e-07  8.30552e-07 ) ergs/cm2
Band function
Multiple GTIs in the spectrum
tstart tstop
-3.844000 62.196000
120.096000 302.048000

Spectral model in the Band function:
------------------------------------------------------------
Parameters  : value       lower 90%   higher 90%
alpha       : -0.788419   ( 0.788419   0.788419 )
beta        : -1.03879    ( -0.0192992   0.0193964 )
Epeak [keV] : 53.7504      ( -53.7504 -53.7504 )
Norm@50keV   : 6.04925E-02    ( -0.0271139   0 )
------------------------------------------------------------
#Fit statistic : Chi-Squared =          39.72 using 59 PHA bins.
# Reduced chi-squared =         0.7223 for     55 degrees of freedom
# Null hypothesis probability =   9.398327e-01

Photon flux (15-150 keV)    in 248 sec:  (    ) ph/cm2/s
Energy fluence (15-150 keV)             : 0 ( 0  0 ) ergs/cm2
Single BB
Spectral model blackbody:
------------------------------------------------------------
Parameters  : value    Lower 90%  Upper 90%
kT [keV]    : 29.2326  (  )
R^2/D10^2   : 5.32803E-02  (   )
(R is the radius in km and D10 is the distance to the source in units of 10 kpc)
------------------------------------------------------------
#Fit statistic : Chi-Squared =        1871.67 using 59 PHA bins.
# Reduced chi-squared =        32.8363 for     57 degrees of freedom
# Null hypothesis probability =   0.000000e+00

Energy  Fluence     90% Error
[keV]   [erg/cm2]   [erg/cm2]
15- 25  1.795e-06   4.352e-08
25- 50  1.095e-05   2.108e-07
50-150  6.675e-05   6.944e-07
15-150  7.949e-05   8.060e-07
Thermal bremsstrahlung (OTTB)
Spectral model: thermal bremsstrahlung
------------------------------------------------------------
Parameters  : value         Lower 90%    Upper 90%
kT [keV]    : 199.363       (      )
Norm        : 18.1090       (     )
------------------------------------------------------------
#Fit statistic : Chi-Squared =        2959.36 using 59 PHA bins.
# Reduced chi-squared =        51.9186 for     57 degrees of freedom
# Null hypothesis probability =   0.000000e+00

Energy  Fluence     90% Error
[keV]   [erg/cm2]   [erg/cm2]
15- 25  1.118e-05   1.352e-07
25- 50  2.151e-05   2.517e-07
50-150  4.718e-05   5.828e-07
15-150  7.988e-05   9.796e-07
Double BB
Spectral model: bbodyrad<1> + bbodyrad<2>
------------------------------------------------------------
Parameters  : value         Lower 90%    Upper 90%
kT1 [keV]   : 8.87304        (-0.401889      0.420979)
R1^2/D10^2  : 1.40614        (-0.209565      0.252196)
kT2 [keV]   : 42.2751        (-1.46957      1.65423)
R2^2/D10^2  : 1.52149E-02    (-0.00168275   0.00176053)
------------------------------------------------------------
#Fit statistic : Chi-Squared =          32.11 using 59 PHA bins.
# Reduced chi-squared =         0.5838 for     55 degrees of freedom
# Null hypothesis probability =   9.942054e-01

Energy  Fluence     90% Error
[keV]   [erg/cm2]   [erg/cm2]
15- 25  6.141e-06   3.174e-07
25- 50  1.682e-05   3.472e-07
50-150  6.319e-05   8.928e-07
15-150  8.615e-05   9.920e-07
Peak spectrum fit
Power-law model
Time interval is from   16.872 sec. to   17.872 sec.

Spectral model in power-law:
------------------------------------------------------------
Parameters  : value       lower 90%   higher 90%
Photon index: 0.989220     ( -0.0341892   0.0339992 )
Norm@50keV  : 0.217868    ( -0.00392163   0.003911 )
------------------------------------------------------------
#Fit statistic : Chi-Squared =          37.51 using 59 PHA bins.
# Reduced chi-squared =         0.6580 for     57 degrees of freedom
# Null hypothesis probability =   9.785322e-01

Photon flux (15-150 keV)    in 1 sec: 25.0712 ( -0.464589  0.463933 ) ph/cm2/s
Energy fluence (15-150 keV)             : 2.36477e-06 ( -4.32133e-08  4.3618e-08 ) ergs/cm2
Cutoff power-law model

Time interval is from   16.872 sec. to   17.872 sec.
Spectral model in the cutoff power-law:
------------------------------------------------------------
Parameters  : value       lower 90%   higher 90%
Photon index: 0.984843     ( -0.0660786   0.0325163 )
Epeak [keV] : 9999.36      ( -9999.36 -9999.36 )
Norm@50keV  : 0.219225    ( -0.00398767   0.00851834 )
------------------------------------------------------------
#Fit statistic : Chi-Squared =          37.75 using 59 PHA bins.
# Reduced chi-squared =         0.6741 for     56 degrees of freedom
# Null hypothesis probability =   9.708501e-01

Photon flux (15-150 keV)    in 1 sec: 25.0572 ( -0.464  0.4645 ) ph/cm2/s
Energy fluence (15-150 keV)             : 2.36317e-06 ( 0  0 ) ergs/cm2
Band function

Time interval is from   16.872 sec. to   17.872 sec.

Spectral model in the Band function:
------------------------------------------------------------
Parameters  : value       lower 90%   higher 90%
alpha       : -0.823875   ( 0.823875   0.823875 )
beta        : -0.989221    ( -0.0340258   0.0341345 )
Epeak [keV] : 47.4925      ( -47.4925 -47.4925 )
Norm@50keV   : 0.358577    ( -0.143872   0 )
------------------------------------------------------------
#Fit statistic : Chi-Squared =          37.51 using 59 PHA bins.
# Reduced chi-squared =         0.6819 for     55 degrees of freedom
# Null hypothesis probability =   9.657521e-01

Photon flux (15-150 keV)    in 1 sec:  (    ) ph/cm2/s
Energy fluence (15-150 keV)             : 0 ( 0  0 ) ergs/cm2
Single BB
Spectral model blackbody:
------------------------------------------------------------
Parameters  : value    Lower 90%  Upper 90%
kT [keV]    : 24.7615  (  )
R^2/D10^2   : 0.611716  (   )
(R is the radius in km and D10 is the distance to the source in units of 10 kpc)
------------------------------------------------------------
#Fit statistic : Chi-Squared =         624.60 using 59 PHA bins.
# Reduced chi-squared =         10.958 for     57 degrees of freedom
# Null hypothesis probability =   1.784816e-96

Energy  Fluence     90% Error
[keV]   [erg/cm2]   [erg/cm2]
15- 25  6.548e-08   2.485e-09
25- 50  3.697e-07   9.750e-09
50-150  1.683e-06   4.450e-08
15-150  2.118e-06   4.550e-08
Thermal bremsstrahlung (OTTB)
Spectral model: thermal bremsstrahlung
------------------------------------------------------------
Parameters  : value         Lower 90%    Upper 90%
kT [keV]    : 199.363       (      )
Norm        : 106.627       (     )
------------------------------------------------------------
#Fit statistic : Chi-Squared =         861.13 using 59 PHA bins.
# Reduced chi-squared =         15.108 for     57 degrees of freedom
# Null hypothesis probability =  5.177556e-144

Energy  Fluence     90% Error
[keV]   [erg/cm2]   [erg/cm2]
15- 25  2.655e-07   5.100e-09
25- 50  5.108e-07   9.900e-09
50-150  1.120e-06   2.050e-08
15-150  1.896e-06   3.500e-08
Double BB
Spectral model: bbodyrad<1> + bbodyrad<2>
------------------------------------------------------------
Parameters  : value         Lower 90%    Upper 90%
kT1 [keV]   : 7.90372        (-0.597072      0.647543)
R1^2/D10^2  : 12.4482        (-2.899      3.96392)
kT2 [keV]   : 37.7568        (-2.25154      2.71076)
R2^2/D10^2  : 0.152513    (-0.028425   0.0312082)
------------------------------------------------------------
#Fit statistic : Chi-Squared =          28.41 using 59 PHA bins.
# Reduced chi-squared =         0.5165 for     55 degrees of freedom
# Null hypothesis probability =   9.988733e-01

Energy  Fluence     90% Error
[keV]   [erg/cm2]   [erg/cm2]
15- 25  1.686e-07   1.205e-08
25- 50  4.347e-07   1.510e-08
50-150  1.800e-06   6.100e-08
15-150  2.404e-06   6.950e-08
Pre-slew spectrum (Pre-slew PHA with pre-slew DRM)
Power-law model

Spectral model in power-law:
------------------------------------------------------------
Parameters  : value       lower 90%   higher 90%
Photon index: 0.824707     ( -0.0224547   0.022346 )
Norm@50keV  : 9.10852E-02    ( -0.00123028   0.00122262 )
------------------------------------------------------------
#Fit statistic : Chi-Squared =          49.48 using 59 PHA bins.
# Reduced chi-squared =         0.8680 for     57 degrees of freedom
# Null hypothesis probability =   7.501485e-01

Photon flux (15-150 keV)    in 17.64 sec: 10.4608 ( -0.137336  0.137882 ) ph/cm2/s
Energy fluence (15-150 keV)             : 1.85841e-05 ( -2.06543e-07  2.0655e-07 ) ergs/cm2
Cutoff power-law model
Spectral model in the cutoff power-law:
------------------------------------------------------------
Parameters  : value       lower 90%   higher 90%
Photon index: 0.816468     ( -0.0266811   0.0192344 )
Epeak [keV] : 1.00000E+04      (   )
Norm@50keV  : 9.16995E-02    ( -0.00123069   0.00100994 )
------------------------------------------------------------
#Fit statistic : Chi-Squared =          50.98 using 59 PHA bins.
# Reduced chi-squared =         0.9104 for     56 degrees of freedom
# Null hypothesis probability =   6.647939e-01

Photon flux (15-150 keV)    in 17.64 sec: 10.4554 ( -0.1375  0.1375 ) ph/cm2/s
Energy fluence (15-150 keV)             : 1.8591e-05 ( 0  0 ) ergs/cm2
Band function
Spectral model in the Band function:
------------------------------------------------------------
Parameters  : value       lower 90%   higher 90%
alpha       : -0.793254   ( 0.793308   0.793308 )
beta        : -0.824707    ( -0.0223463   0.0224546 )
Epeak [keV] : 12.8767      ( -12.8767 9987.09 )
Norm@50keV   : 0.144334    ( -0.0384201   2.20863e+06 )
------------------------------------------------------------
#Fit statistic : Chi-Squared =          49.48 using 59 PHA bins.
# Reduced chi-squared =         0.8996 for     55 degrees of freedom
# Null hypothesis probability =   6.847805e-01

Photon flux (15-150 keV)    in 17.64 sec:  (    ) ph/cm2/s
Energy fluence (15-150 keV)             : 0 ( 0  0 ) ergs/cm2
S(25-50 keV) vs. S(50-100 keV) plot
S(25-50 keV)  = 1.62e-05
S(50-100 keV) = 3.16e-05
T90 vs. Hardness ratio plot
T90                                   = 124.859999984503 sec.
Hardness ratio (energy fluence ratio) = 1.95062
Color vs. Color plot
Count Ratio  (25-50 keV) / (15-25 keV) = 1.53459
Count Ratio (50-100 keV) / (15-25 keV) = 1.55107
Mask shadow pattern
IMX = 2.077416231864064E-01, IMY = -3.142059531047589E-03
TIME vs. PHA plot around the trigger time
Blue+Cyan dotted lines: Time interval of the scaled map
From 0.000000 to 1.024000
TIME vs. DetID plot around the trigger time
Blue+Cyan dotted lines: Time interval of the scaled map
From 0.000000 to 1.024000
100 us light curve (15-350 keV)
Blue+Cyan dotted lines: Time interval of the scaled map
From 0.000000 to 1.024000
Spacecraft aspect plot
Bright source in the pre-burst/pre-slew/post-slew images
Pre-burst image of 15-350 keV band
Time interval of the image:
-239.904000 -3.844000

# RAcent  DECcent POSerr Theta    Phi  PeakCts   SNR AngSep     Name
#  [deg]    [deg]    ['] [deg]  [deg]                   [']
254.4537  35.3407   29.1  37.5  -40.0  -0.1019  -0.4    0.2	Her X-1
236.2848   8.3961    2.6  44.1    8.3   1.3487   4.5 ------	UNKNOWN
256.3129   5.1754    2.5  58.5  -10.0   4.2496   4.5 ------	UNKNOWN
256.0041  44.3895    2.6  35.0  -55.0   1.2310   4.4 ------	UNKNOWN
113.6178  72.3511    3.1  49.3 -150.1   1.5634   3.7 ------	UNKNOWN
Pre-slew background subtracted image of 15-350 keV band
Time interval of the image:
-3.844000 13.796600

# RAcent  DECcent POSerr Theta    Phi  PeakCts   SNR AngSep     Name
#  [deg]    [deg]    ['] [deg]  [deg]                   [']
254.3551  35.1419    0.0  37.5  -39.7   0.8176   2.7   13.0	Her X-1
185.4138  28.7862    2.6  22.6  108.0   1.0222   4.4 ------	UNKNOWN
133.7403  46.1668    2.6  49.4  173.0   2.2404   4.4 ------	UNKNOWN
217.9192  36.2999    0.1  11.7    0.9  25.3554 140.2 ------	UNKNOWN
211.2773  63.7210    3.7  19.9 -120.2   0.6723   3.2 ------	UNKNOWN
263.6960  30.6157    2.3  46.5  -40.0   2.3559   5.0 ------	UNKNOWN
265.0908  31.4628    3.0  47.1  -41.8   2.0031   3.9 ------	UNKNOWN
Post-slew image of 15-350 keV band
Time interval of the image:
49.396590 62.196000
120.096000 302.186000
660.096000 782.176000

# RAcent  DECcent POSerr Theta    Phi  PeakCts   SNR AngSep     Name
#  [deg]    [deg]    ['] [deg]  [deg]                   [']
254.4578  35.3424  907.8  29.5  -63.0   0.0039   0.0    0.0	Her X-1
217.9468  36.2851    0.2   0.0  -37.9  14.6950  68.9 ------	UNKNOWN
Plot creation:
Sun May 31 08:05:31 EDT 2015