Special notes of this burst
Image
Pre-slew 15.0-350.0 keV image (Event data)

#   RAcent    DECcent   POSerr    Theta     Phi              Peak Cts       SNR   Name
  259.0081    55.3913   0.0056    33.6705  -101.4636         5.3084307     34.430 TRIG_00306778

Foreground time interval of the image:
 -0.328  43.420 (delta_t =  43.748 [sec])
Background time interval of the image:
-132.915  -0.328 (delta_t = 132.587 [sec])
Lightcurves
Notes:
- 1) The mask-weighted light curves are using the flight position.
- 2) Multiple plots of different time binning/intervals are shown to cover all scenarios of short/long GRBs, rate/image triggers, and real/false positives.
- 3) For all the mask-weighted lightcurves, the y-axis units are counts/sec/det where a det is 0.4 x 0.4 = 0.16 sq cm.
- 4) The verticle lines correspond to following: green dotted lines are T50 interval, black dotted lines are T90 interval, blue solid line(s) is a spacecraft slew start time, and orange solid line(s) is a spacecraft slew end time.
- 5) Time of each bin is in the middle of the bin.
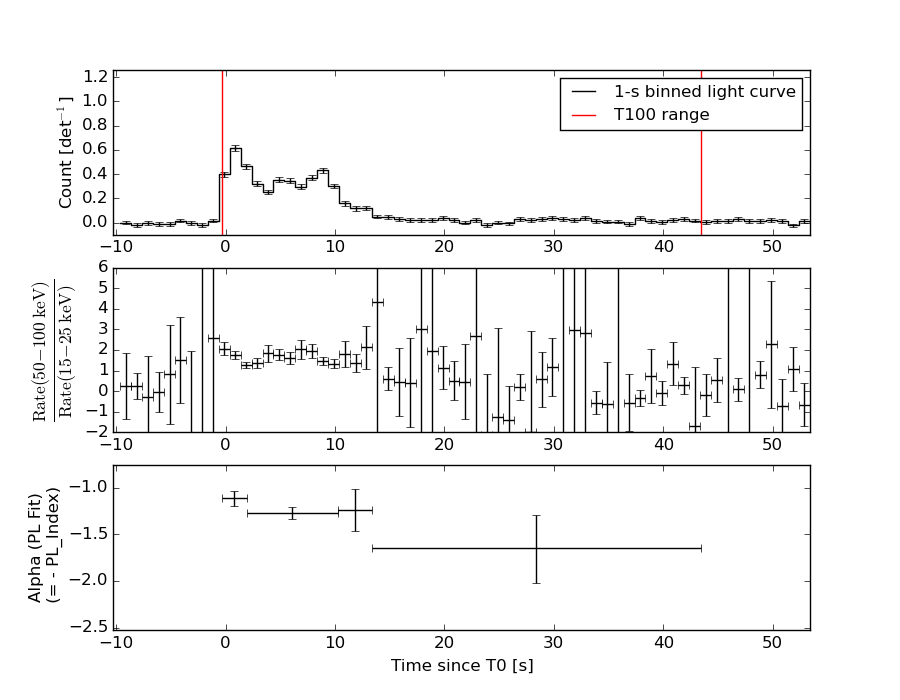
1 s binning
From T0-310 s to T0+310 s
From T100_start - 20 s to T100_end + 30 s

Full time interval
64 ms binning
Full time interval

From T100_start to T100_end

From T0-5 sec to T0+5 sec
16 ms binning
From T100_start-5 s to T100_start+5 s
Blue+Cyan dotted lines: Time interval of the scaled map
From 0.000000 to 1.024000
8 ms binning
From T100_start-3 s to T100_start+3 s

Blue+Cyan dotted lines: Time interval of the scaled map
From 0.000000 to 1.024000
2 ms binning
From T100_start-1 s to T100_start+1 s
Blue+Cyan dotted lines: Time interval of the scaled map
From 0.000000 to 1.024000
SN=5 or 10 sec. binning (whichever binning is satisfied first)

SN=5 or 10 sec. binning (T < 200 sec)
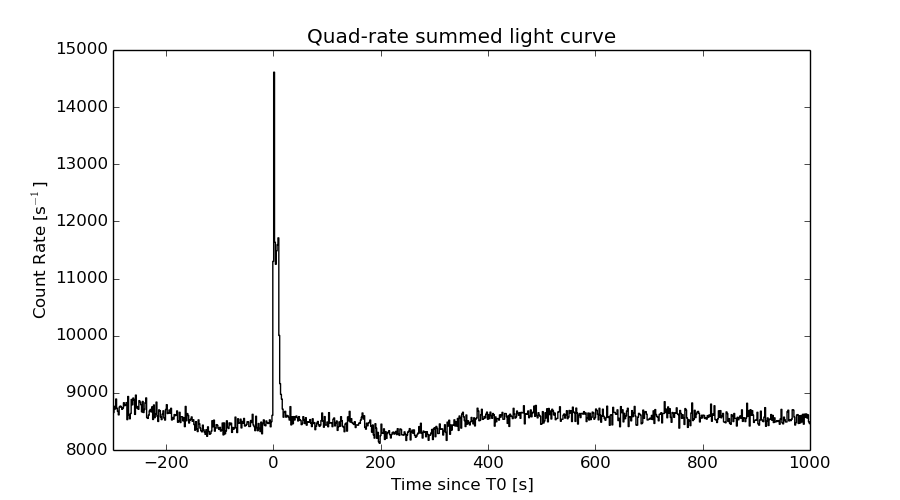
Quad-rate summed light curves (from T0-300s to T0+1000s)
Spectral Evolution
Spectra
Notes:
- 1) The fitting includes the systematic errors.
- 2) When the burst includes telescope slew time periods, the fitting uses an average response file made from multiple 5-s response files through out the slew time plus single time preiod for the non-slew times, and weighted by the total counts in the corresponding time period using addrmf. An average response file is needed becuase a spectral fit using the pre-slew DRM will introduce some errors in both a spectral shape and a normalization if the PHA file contains a lot of the slew/post-slew time interval.
- 3) For fits to more complicated models (e.g. a power-law over a cutoff power-law), the BAT team has decided to require a chi-square improvement of more than 6 for each extra dof.
Time averaged spectrum fit using the average DRM
Power-law model

Time interval is from   -0.328 sec. to   43.420 sec.

Spectral model in power-law:
------------------------------------------------------------
Parameters  : value       lower 90%   higher 90%
Photon index: 1.28538     ( -0.0683079   0.0680927 )
Norm@50keV  : 8.09523E-03    ( -0.000302179   0.000302175 )
------------------------------------------------------------
#Fit statistic : Chi-Squared =          48.77 using 59 PHA bins.
# Reduced chi-squared =         0.8556 for     57 degrees of freedom
# Null hypothesis probability =   7.728952e-01

Photon flux (15-150 keV)    in 43.75 sec: 0.963229 ( -0.0379726  0.0380417 ) ph/cm2/s
Energy fluence (15-150 keV)             : 3.51246e-06 ( -1.42884e-07  1.43262e-07 ) ergs/cm2
Cutoff power-law model

Time interval is from   -0.328 sec. to   43.420 sec.
Spectral model in the cutoff power-law:
------------------------------------------------------------
Parameters  : value       lower 90%   higher 90%
Photon index: 1.01850     ( -0.284828   0.270553 )
Epeak [keV] : 201.644      ( -76.5348 4400.55 )
Norm@50keV  : 1.07586E-02    ( -0.00239626   0.00369611 )
------------------------------------------------------------
#Fit statistic : Chi-Squared =          45.87 using 59 PHA bins.
# Reduced chi-squared =         0.8191 for     56 degrees of freedom
# Null hypothesis probability =   8.309642e-01

Photon flux (15-150 keV)    in 43.75 sec: 0.948728 ( -0.040475  0.040522 ) ph/cm2/s
Energy fluence (15-150 keV)             : 3.4542e-06 ( -1.56796e-07  1.55838e-07 ) ergs/cm2
Band function

Time interval is from   -0.328 sec. to   43.420 sec.

Spectral model in the Band function:
------------------------------------------------------------
Parameters  : value       lower 90%   higher 90%
alpha       : -0.102485   ( -0.829158   3.56467 )
beta        : -1.38910    ( 1.38741   0.108004 )
Epeak [keV] : 57.9467      ( -26.7881 214.417 )
Norm@50keV   : 4.14738E-02    ( -0.0430121   9.75889 )
------------------------------------------------------------
#Fit statistic : Chi-Squared =          43.60 using 59 PHA bins.
# Reduced chi-squared =         0.7926 for     55 degrees of freedom
# Null hypothesis probability =   8.661597e-01

Photon flux (15-150 keV)    in 43.75 sec:  (    ) ph/cm2/s
Energy fluence (15-150 keV)             : 0 ( 0  0 ) ergs/cm2
Single BB
Spectral model blackbody:
------------------------------------------------------------
Parameters  : value    Lower 90%  Upper 90%
kT [keV]    : 18.1731  (  )
R^2/D10^2   : 5.86106E-02  (   )
(R is the radius in km and D10 is the distance to the source in units of 10 kpc)
------------------------------------------------------------
#Fit statistic : Chi-Squared =         170.23 using 59 PHA bins.
# Reduced chi-squared =         2.9865 for     57 degrees of freedom
# Null hypothesis probability =   3.294946e-13

Energy  Fluence     90% Error
[keV]   [erg/cm2]   [erg/cm2]
15- 25  1.690e-07   1.391e-08
25- 50  7.873e-07   4.156e-08
50-150  1.892e-06   1.339e-07
15-150  2.848e-06   1.277e-07
Thermal bremsstrahlung (OTTB)

Spectral model: thermal bremsstrahlung
------------------------------------------------------------
Parameters  : value         Lower 90%    Upper 90%
kT [keV]    : 200.000       (      )
Norm        : 4.03470       (-0.152345     0.152297)
------------------------------------------------------------
#Fit statistic : Chi-Squared =          91.59 using 59 PHA bins.
# Reduced chi-squared =          1.607 for     57 degrees of freedom
# Null hypothesis probability =   2.485055e-03

Energy  Fluence     90% Error
[keV]   [erg/cm2]   [erg/cm2]
15- 25  4.397e-07   1.645e-08
25- 50  8.458e-07   3.369e-08
50-150  1.855e-06   7.131e-08
15-150  3.140e-06   1.273e-07
Double BB

Spectral model: bbodyrad<1> + bbodyrad<2>
------------------------------------------------------------
Parameters  : value         Lower 90%    Upper 90%
kT1 [keV]   : 8.72977        (-1.27478      1.42382)
R1^2/D10^2  : 0.418648        (-0.147007      0.258495)
kT2 [keV]   : 33.2255        (-5.25426      9.2042)
R2^2/D10^2  : 6.32333E-03    (-0.00340339   0.00510809)
------------------------------------------------------------
#Fit statistic : Chi-Squared =          46.43 using 59 PHA bins.
# Reduced chi-squared =         0.8442 for     55 degrees of freedom
# Null hypothesis probability =   7.878920e-01

Energy  Fluence     90% Error
[keV]   [erg/cm2]   [erg/cm2]
15- 25  3.121e-07   4.441e-08
25- 50  8.287e-07   8.422e-08
50-150  2.326e-06   4.331e-07
15-150  3.467e-06   4.657e-07
Peak spectrum fit
Power-law model
Time interval is from    0.128 sec. to    1.128 sec.

Spectral model in power-law:
------------------------------------------------------------
Parameters  : value       lower 90%   higher 90%
Photon index: 1.06733     ( -0.107926   0.107177 )
Norm@50keV  : 4.39965E-02    ( -0.00274632   0.00274566 )
------------------------------------------------------------
#Fit statistic : Chi-Squared =          40.65 using 59 PHA bins.
# Reduced chi-squared =         0.7132 for     57 degrees of freedom
# Null hypothesis probability =   9.499147e-01

Photon flux (15-150 keV)    in 1 sec: 5.08840 ( -0.322617  0.322733 ) ph/cm2/s
Energy fluence (15-150 keV)             : 4.6491e-07 ( -3.2685e-08  3.28042e-08 ) ergs/cm2
Cutoff power-law model

Time interval is from    0.128 sec. to    1.128 sec.
Spectral model in the cutoff power-law:
------------------------------------------------------------
Parameters  : value       lower 90%   higher 90%
Photon index: 0.906133     ( -0.436374   0.21407 )
Epeak [keV] : 380.266      ( -380.266 -380.266 )
Norm@50keV  : 5.22550E-02    ( -0.0104744   0.0296523 )
------------------------------------------------------------
#Fit statistic : Chi-Squared =          40.20 using 59 PHA bins.
# Reduced chi-squared =         0.7178 for     56 degrees of freedom
# Null hypothesis probability =   9.449950e-01

Photon flux (15-150 keV)    in 1 sec: 5.06320 ( -0.32861  0.32847 ) ph/cm2/s
Energy fluence (15-150 keV)             : 4.61846e-07 ( -3.4154e-08  3.392e-08 ) ergs/cm2
Band function

Time interval is from    0.128 sec. to    1.128 sec.

Spectral model in the Band function:
------------------------------------------------------------
Parameters  : value       lower 90%   higher 90%
alpha       : 2.71871   ( -2.71871   -2.71871 )
beta        : -1.10936    ( -0.139499   0.123243 )
Epeak [keV] : 29.5112      ( -29.5112 108.989 )
Norm@50keV   : 34.4148    ( -34.4148   928.678 )
------------------------------------------------------------
#Fit statistic : Chi-Squared =          39.51 using 59 PHA bins.
# Reduced chi-squared =         0.7185 for     55 degrees of freedom
# Null hypothesis probability =   9.427392e-01

Photon flux (15-150 keV)    in 1 sec:  (    ) ph/cm2/s
Energy fluence (15-150 keV)             : 0 ( 0  0 ) ergs/cm2
Single BB

Spectral model blackbody:
------------------------------------------------------------
Parameters  : value    Lower 90%  Upper 90%
kT [keV]    : 20.7537  (-1.73298  1.9394)
R^2/D10^2   : 0.217785  (-0.0536249   0.0695032)
(R is the radius in km and D10 is the distance to the source in units of 10 kpc)
------------------------------------------------------------
#Fit statistic : Chi-Squared =          88.80 using 59 PHA bins.
# Reduced chi-squared =          1.558 for     57 degrees of freedom
# Null hypothesis probability =   4.459288e-03

Energy  Fluence     90% Error
[keV]   [erg/cm2]   [erg/cm2]
15- 25  1.781e-08   2.395e-09
25- 50  9.087e-08   8.510e-09
50-150  2.914e-07   3.520e-08
15-150  4.001e-07   3.260e-08
Thermal bremsstrahlung (OTTB)

Spectral model: thermal bremsstrahlung
------------------------------------------------------------
Parameters  : value         Lower 90%    Upper 90%
kT [keV]    : 200.000       (      )
Norm        : 20.4051       (-1.32307     1.32307)
------------------------------------------------------------
#Fit statistic : Chi-Squared =          93.07 using 59 PHA bins.
# Reduced chi-squared =          1.633 for     57 degrees of freedom
# Null hypothesis probability =   1.806823e-03

Energy  Fluence     90% Error
[keV]   [erg/cm2]   [erg/cm2]
15- 25  5.079e-08   4.000e-09
25- 50  9.770e-08   1.062e-08
50-150  2.143e-07   5.330e-08
15-150  3.628e-07   6.660e-08
Double BB
Spectral model: bbodyrad<1> + bbodyrad<2>
------------------------------------------------------------
Parameters  : value         Lower 90%    Upper 90%
kT1 [keV]   : 7.93191        (-1.9732      2.69183)
R1^2/D10^2  : 2.54336        (-1.4267      3.88094)
kT2 [keV]   : 33.5633        (-6.41666      15.2793)
R2^2/D10^2  : 4.06032E-02    (-0.0275165   0.0446335)
------------------------------------------------------------
#Fit statistic : Chi-Squared =          40.96 using 59 PHA bins.
# Reduced chi-squared =         0.7447 for     55 degrees of freedom
# Null hypothesis probability =   9.204613e-01

Energy  Fluence     90% Error
[keV]   [erg/cm2]   [erg/cm2]
15- 25  3.541e-08   1.257e-08
25- 50  9.248e-08   1.973e-08
50-150  3.367e-07   9.565e-08
15-150  4.646e-07   1.311e-07
Pre-slew spectrum (Pre-slew PHA with pre-slew DRM)
Power-law model

Spectral model in power-law:
------------------------------------------------------------
Parameters  : value       lower 90%   higher 90%
Photon index: 1.28538     ( -0.0683079   0.0680927 )
Norm@50keV  : 8.09523E-03    ( -0.000302179   0.000302175 )
------------------------------------------------------------
#Fit statistic : Chi-Squared =          48.77 using 59 PHA bins.
# Reduced chi-squared =         0.8556 for     57 degrees of freedom
# Null hypothesis probability =   7.728952e-01

Photon flux (15-150 keV)    in 43.75 sec: 0.963229 ( -0.0379726  0.0380417 ) ph/cm2/s
Energy fluence (15-150 keV)             : 3.51246e-06 ( -1.42884e-07  1.43262e-07 ) ergs/cm2
Cutoff power-law model
Spectral model in the cutoff power-law:
------------------------------------------------------------
Parameters  : value       lower 90%   higher 90%
Photon index: 1.01850     ( -0.284828   0.270553 )
Epeak [keV] : 201.644      ( -76.5348 4400.55 )
Norm@50keV  : 1.07586E-02    ( -0.00239626   0.00369611 )
------------------------------------------------------------
#Fit statistic : Chi-Squared =          45.87 using 59 PHA bins.
# Reduced chi-squared =         0.8191 for     56 degrees of freedom
# Null hypothesis probability =   8.309642e-01

Photon flux (15-150 keV)    in 43.75 sec: 0.948728 ( -0.040475  0.040522 ) ph/cm2/s
Energy fluence (15-150 keV)             : 3.4542e-06 ( -1.56796e-07  1.55838e-07 ) ergs/cm2
Band function

Spectral model in the Band function:
------------------------------------------------------------
Parameters  : value       lower 90%   higher 90%
alpha       : -0.102485   ( -0.829158   3.56467 )
beta        : -1.38910    ( 1.38741   0.108004 )
Epeak [keV] : 57.9467      ( -26.7881 214.417 )
Norm@50keV   : 4.14738E-02    ( -0.0430121   9.75889 )
------------------------------------------------------------
#Fit statistic : Chi-Squared =          43.60 using 59 PHA bins.
# Reduced chi-squared =         0.7926 for     55 degrees of freedom
# Null hypothesis probability =   8.661597e-01

Photon flux (15-150 keV)    in 43.75 sec:  (    ) ph/cm2/s
Energy fluence (15-150 keV)             : 0 ( 0  0 ) ergs/cm2
S(25-50 keV) vs. S(50-100 keV) plot
S(25-50 keV)  = 7.75e-07
S(50-100 keV) = 1.27e-06
T90 vs. Hardness ratio plot
T90                                   = 29.5519999861717 sec.
Hardness ratio (energy fluence ratio) = 1.63871
Color vs. Color plot
Count Ratio  (25-50 keV) / (15-25 keV) = 1.76856
Count Ratio (50-100 keV) / (15-25 keV) = 1.58536
Mask shadow pattern

IMX = -1.323988251153645E-01, IMY = 6.528828242920284E-01
TIME vs. PHA plot around the trigger time
Blue+Cyan dotted lines: Time interval of the scaled map
From 0.000000 to 1.024000
TIME vs. DetID plot around the trigger time
Blue+Cyan dotted lines: Time interval of the scaled map
From 0.000000 to 1.024000
100 us light curve (15-350 keV)
Blue+Cyan dotted lines: Time interval of the scaled map
From 0.000000 to 1.024000
Spacecraft aspect plot
Bright source in the pre-burst/pre-slew/post-slew images
Pre-burst image of 15-350 keV band
Time interval of the image:
-132.915400 -0.328000

# RAcent  DECcent POSerr Theta    Phi  PeakCts   SNR AngSep     Name
#  [deg]    [deg]    ['] [deg]  [deg]                   [']
254.3603  35.3884   12.1  29.4  -63.0  -0.1471  -0.9    5.5	Her X-1
203.1634  -3.7668    2.3  42.4   58.4   2.1083   5.0 ------	UNKNOWN
229.8173 -11.0839    2.3  48.7   20.6   1.6145   5.1 ------	UNKNOWN
162.0736  62.8832    2.3  42.8 -177.5   0.8080   5.0 ------	UNKNOWN
266.3436  10.1180    3.5  50.9  -35.4   1.2787   3.3 ------	UNKNOWN
271.0396  31.9011    3.1  43.7  -64.2   1.8640   3.7 ------	UNKNOWN
273.7099  67.1019    3.4  43.8 -116.1   1.8213   3.4 ------	UNKNOWN
Pre-slew background subtracted image of 15-350 keV band
Time interval of the image:
-0.328000 43.420000

# RAcent  DECcent POSerr Theta    Phi  PeakCts   SNR AngSep     Name
#  [deg]    [deg]    ['] [deg]  [deg]                   [']
254.4272  35.4760   11.9  29.4  -63.2  -0.1104  -1.0    8.2	Her X-1
259.0081  55.3914    0.3  33.7 -101.5   5.3077  34.4 ------	UNKNOWN
Post-slew image of 15-350 keV band
Time interval of the image:
208.084600 962.484000

# RAcent  DECcent POSerr Theta    Phi  PeakCts   SNR AngSep     Name
#  [deg]    [deg]    ['] [deg]  [deg]                   [']
254.6691  35.2234    0.0  20.4   18.7  -0.2099  -0.7   12.6	Her X-1
268.3265  -1.4124   17.0  57.3   -2.5   1.2936   0.7    3.5	SW J1753.5-0127
288.6751  10.9458    5.2  50.2  -30.7  -1.9915  -2.2    7.3	GRS 1915+105
299.5648  35.2019    0.6  34.2  -62.4  11.5491  20.9    1.3	Cyg X-1
308.0971  40.9527    2.6  34.9  -77.9   3.7244   4.4    0.6	Cyg X-3
106.1979  68.7630    2.9  54.2  176.8   5.3589   4.0 ------	UNKNOWN
252.9535  87.8005    2.3  32.4 -171.8   1.8294   5.0 ------	UNKNOWN
293.4878  59.8891    2.4  18.8 -109.4   1.6589   4.8 ------	UNKNOWN
288.1969  13.5267    3.0  47.6  -31.4   3.0803   3.9 ------	UNKNOWN
310.0225  38.1816    3.5  37.9  -76.2   3.3158   3.3 ------	UNKNOWN
298.8044  14.8660    2.0  50.8  -44.5  11.7438   5.8 ------	UNKNOWN
Plot creation:
Sun May 31 08:03:31 EDT 2015