Special notes of this burst
Image
Pre-slew 15.0-350.0 keV image (Event data)
#   RAcent    DECcent   POSerr    Theta     Phi              Peak Cts       SNR   Name
  177.7695    57.1650   0.0130    22.0875  -178.3213         0.4939436     14.797 TRIG_00306858

Foreground time interval of the image:
 -1.672  13.848 (delta_t =  15.520 [sec])
Background time interval of the image:
-239.120  -1.672 (delta_t = 237.448 [sec])
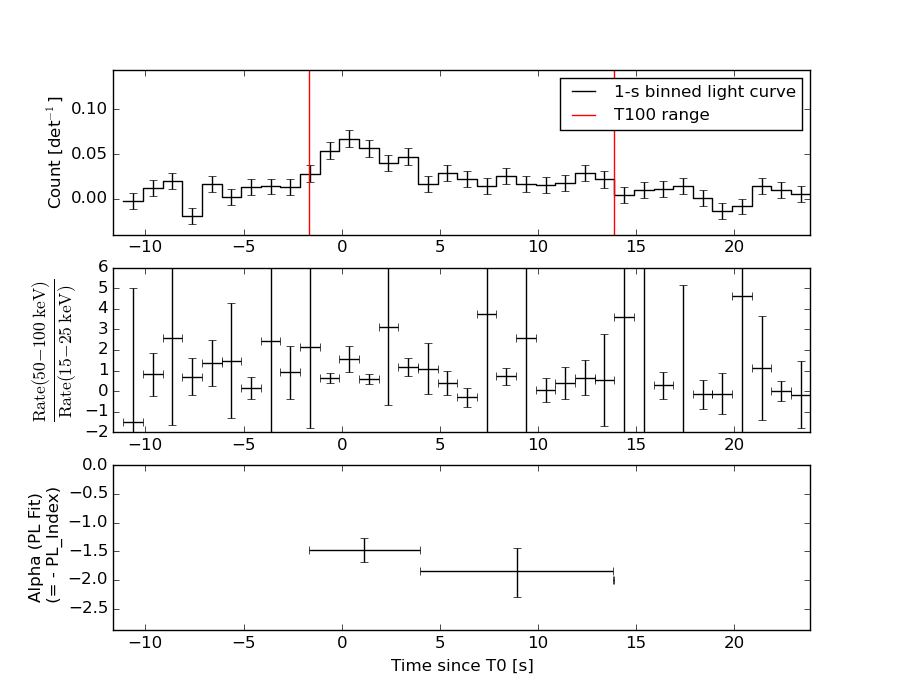
Lightcurves
Notes:
- 1) The mask-weighted light curves are using the flight position.
- 2) Multiple plots of different time binning/intervals are shown to cover all scenarios of short/long GRBs, rate/image triggers, and real/false positives.
- 3) For all the mask-weighted lightcurves, the y-axis units are counts/sec/det where a det is 0.4 x 0.4 = 0.16 sq cm.
- 4) The verticle lines correspond to following: green dotted lines are T50 interval, black dotted lines are T90 interval, blue solid line(s) is a spacecraft slew start time, and orange solid line(s) is a spacecraft slew end time.
- 5) Time of each bin is in the middle of the bin.
1 s binning
From T0-310 s to T0+310 s

From T100_start - 20 s to T100_end + 30 s

Full time interval

64 ms binning
Full time interval
From T100_start to T100_end

From T0-5 sec to T0+5 sec

16 ms binning
From T100_start-5 s to T100_start+5 s

Blue+Cyan dotted lines: Time interval of the scaled map
From 0.000000 to 1.408000
8 ms binning
From T100_start-3 s to T100_start+3 s
Blue+Cyan dotted lines: Time interval of the scaled map
From 0.000000 to 1.408000
2 ms binning
From T100_start-1 s to T100_start+1 s
Blue+Cyan dotted lines: Time interval of the scaled map
From 0.000000 to 1.408000
SN=5 or 10 sec. binning (whichever binning is satisfied first)

SN=5 or 10 sec. binning (T < 200 sec)

Quad-rate summed light curves (from T0-300s to T0+1000s)

Spectral Evolution
Spectra
Notes:
- 1) The fitting includes the systematic errors.
- 2) When the burst includes telescope slew time periods, the fitting uses an average response file made from multiple 5-s response files through out the slew time plus single time preiod for the non-slew times, and weighted by the total counts in the corresponding time period using addrmf. An average response file is needed becuase a spectral fit using the pre-slew DRM will introduce some errors in both a spectral shape and a normalization if the PHA file contains a lot of the slew/post-slew time interval.
- 3) For fits to more complicated models (e.g. a power-law over a cutoff power-law), the BAT team has decided to require a chi-square improvement of more than 6 for each extra dof.
Time averaged spectrum fit using the average DRM
Power-law model

Time interval is from   -1.672 sec. to   13.848 sec.

Spectral model in power-law:
------------------------------------------------------------
Parameters  : value       lower 90%   higher 90%
Photon index: 1.62256     ( -0.208911   0.214044 )
Norm@50keV  : 1.95787E-03    ( -0.000257725   0.000252945 )
------------------------------------------------------------
#Fit statistic : Chi-Squared =          43.19 using 59 PHA bins.
# Reduced chi-squared =         0.7577 for     57 degrees of freedom
# Null hypothesis probability =   9.117879e-01

Photon flux (15-150 keV)    in 15.52 sec: 0.253385 ( -0.0296646  0.0296705 ) ph/cm2/s
Energy fluence (15-150 keV)             : 2.83426e-07 ( -3.98578e-08  4.07133e-08 ) ergs/cm2
Cutoff power-law model

Time interval is from   -1.672 sec. to   13.848 sec.
Spectral model in the cutoff power-law:
------------------------------------------------------------
Parameters  : value       lower 90%   higher 90%
Photon index: 1.50731     ( -0.907562   0.324837 )
Epeak [keV] : 189.118      ( -192.539 -192.539 )
Norm@50keV  : 2.27154E-03    ( -0.000559044   0.00498656 )
------------------------------------------------------------
#Fit statistic : Chi-Squared =          43.13 using 59 PHA bins.
# Reduced chi-squared =         0.7702 for     56 degrees of freedom
# Null hypothesis probability =   8.961425e-01

Photon flux (15-150 keV)    in 15.52 sec: 0.252171 ( -0.01543  0.030466 ) ph/cm2/s
Energy fluence (15-150 keV)             : 2.79674e-07 ( -4.81958e-08  4.36748e-08 ) ergs/cm2
Band function

Time interval is from   -1.672 sec. to   13.848 sec.

Spectral model in the Band function:
------------------------------------------------------------
Parameters  : value       lower 90%   higher 90%
alpha       : 4.48925   ( -4.48925   -4.48925 )
beta        : -1.77526    ( -0.290876   0.258577 )
Epeak [keV] : 25.3753      ( -8.53129 5.1685 )
Norm@50keV   : 91.2441    ( -10.6083   1.22234e+06 )
------------------------------------------------------------
#Fit statistic : Chi-Squared =          41.61 using 59 PHA bins.
# Reduced chi-squared =         0.7565 for     55 degrees of freedom
# Null hypothesis probability =   9.087634e-01

Photon flux (15-150 keV)    in 15.52 sec:  (    ) ph/cm2/s
Energy fluence (15-150 keV)             : 0 ( 0  0 ) ergs/cm2
Single BB
Spectral model blackbody:
------------------------------------------------------------
Parameters  : value    Lower 90%  Upper 90%
kT [keV]    : 11.6039  (-1.67596  2.06125)
R^2/D10^2   : 6.91010E-02  (-0.0308418   0.0530102)
(R is the radius in km and D10 is the distance to the source in units of 10 kpc)
------------------------------------------------------------
#Fit statistic : Chi-Squared =          60.50 using 59 PHA bins.
# Reduced chi-squared =          1.061 for     57 degrees of freedom
# Null hypothesis probability =   3.506809e-01

Energy  Fluence     90% Error
[keV]   [erg/cm2]   [erg/cm2]
15- 25  3.043e-08   7.155e-09
25- 50  9.201e-08   1.554e-08
50-150  7.280e-08   1.953e-08
15-150  1.952e-07   3.128e-08
Thermal bremsstrahlung (OTTB)

Spectral model: thermal bremsstrahlung
------------------------------------------------------------
Parameters  : value         Lower 90%    Upper 90%
kT [keV]    : 162.129       (-73.737      -160.553)
Norm        : 1.03881       (-0.127699     0.171053)
------------------------------------------------------------
#Fit statistic : Chi-Squared =          43.32 using 59 PHA bins.
# Reduced chi-squared =         0.7601 for     57 degrees of freedom
# Null hypothesis probability =   9.093466e-01

Energy  Fluence     90% Error
[keV]   [erg/cm2]   [erg/cm2]
15- 25  4.111e-08   2.262e-08
25- 50  7.705e-08   4.130e-08
50-150  1.569e-07   8.908e-08
15-150  2.751e-07   1.526e-07
Double BB

Spectral model: bbodyrad<1> + bbodyrad<2>
------------------------------------------------------------
Parameters  : value         Lower 90%    Upper 90%
kT1 [keV]   : 7.68076        (-2.02056      2.16807)
R1^2/D10^2  : 0.242328        (-0.134875      0.490085)
kT2 [keV]   : 36.8812        (-16.5005      -36.9392)
R2^2/D10^2  : 9.26036E-04    (-0.000894851   0.00584452)
------------------------------------------------------------
#Fit statistic : Chi-Squared =          41.28 using 59 PHA bins.
# Reduced chi-squared =         0.7506 for     55 degrees of freedom
# Null hypothesis probability =   9.147771e-01

Energy  Fluence     90% Error
[keV]   [erg/cm2]   [erg/cm2]
15- 25  4.153e-08   1.777e-08
25- 50  8.106e-08   3.017e-08
50-150  1.676e-07   8.993e-08
15-150  2.902e-07   1.228e-07
Peak spectrum fit
Power-law model

Time interval is from    0.052 sec. to    1.052 sec.

Spectral model in power-law:
------------------------------------------------------------
Parameters  : value       lower 90%   higher 90%
Photon index: 1.32727     ( -0.35733   0.353286 )
Norm@50keV  : 4.65631E-03    ( -0.000988862   0.000984201 )
------------------------------------------------------------
#Fit statistic : Chi-Squared =          56.08 using 59 PHA bins.
# Reduced chi-squared =         0.9838 for     57 degrees of freedom
# Null hypothesis probability =   5.097363e-01

Photon flux (15-150 keV)    in 1 sec: 0.558397 ( -0.118434  0.118644 ) ph/cm2/s
Energy fluence (15-150 keV)             : 4.57143e-08 ( -1.07416e-08  1.09719e-08 ) ergs/cm2
Cutoff power-law model
Time interval is from    0.052 sec. to    1.052 sec.
Spectral model in the cutoff power-law:
------------------------------------------------------------
Parameters  : value       lower 90%   higher 90%
Photon index: 0.733487     ( -1.87773   1.64588 )
Epeak [keV] : 104.772      ( -104.773 -104.773 )
Norm@50keV  : 9.43449E-03    ( -0.00564473   0.0773186 )
------------------------------------------------------------
#Fit statistic : Chi-Squared =          55.54 using 59 PHA bins.
# Reduced chi-squared =         0.9917 for     56 degrees of freedom
# Null hypothesis probability =   4.923194e-01

Photon flux (15-150 keV)    in 1 sec: 0.546799 ( -0.122151  0.121698 ) ph/cm2/s
Energy fluence (15-150 keV)             : 4.35023e-08 ( -1.2065e-08  1.20971e-08 ) ergs/cm2
Band function

Time interval is from    0.052 sec. to    1.052 sec.

Spectral model in the Band function:
------------------------------------------------------------
Parameters  : value       lower 90%   higher 90%
alpha       : 3.02292   ( -0.686297   -0.686297 )
beta        : -1.63478    ( 1.58302   0.526079 )
Epeak [keV] : 36.3205      ( -42.4575 128.674 )
Norm@50keV   : 3.37482    ( -3.36012   37.1934 )
------------------------------------------------------------
#Fit statistic : Chi-Squared =          54.83 using 59 PHA bins.
# Reduced chi-squared =         0.9970 for     55 degrees of freedom
# Null hypothesis probability =   4.809536e-01

Photon flux (15-150 keV)    in 1 sec:  (    ) ph/cm2/s
Energy fluence (15-150 keV)             : 0 ( 0  0 ) ergs/cm2
Single BB
Spectral model blackbody:
------------------------------------------------------------
Parameters  : value    Lower 90%  Upper 90%
kT [keV]    : 15.4626  (-3.67617  5.30479)
R^2/D10^2   : 5.96107E-02  (-0.0379023   0.0926962)
(R is the radius in km and D10 is the distance to the source in units of 10 kpc)
------------------------------------------------------------
#Fit statistic : Chi-Squared =          59.11 using 59 PHA bins.
# Reduced chi-squared =          1.037 for     57 degrees of freedom
# Null hypothesis probability =   3.985251e-01

Energy  Fluence     90% Error
[keV]   [erg/cm2]   [erg/cm2]
15- 25  2.968e-09   1.416e-09
25- 50  1.212e-08   4.869e-09
50-150  1.998e-08   9.046e-09
15-150  3.507e-08   1.386e-08
Thermal bremsstrahlung (OTTB)
Spectral model: thermal bremsstrahlung
------------------------------------------------------------
Parameters  : value         Lower 90%    Upper 90%
kT [keV]    : 199.360       (-92.9972      -199.362)
Norm        : 2.30406       (-0.484169     0.485203)
------------------------------------------------------------
#Fit statistic : Chi-Squared =          56.69 using 59 PHA bins.
# Reduced chi-squared =         0.9946 for     57 degrees of freedom
# Null hypothesis probability =   4.864804e-01

Energy  Fluence     90% Error
[keV]   [erg/cm2]   [erg/cm2]
15- 25  5.737e-09   3.444e-09
25- 50  1.104e-08   6.540e-09
50-150  2.421e-08   1.411e-08
15-150  4.098e-08   2.402e-08
Double BB

------------------------------------------------------------
Parameters  : value         Lower 90%    Upper 90%
kT1 [keV]   : 35.0837        (      )
R1^2/D10^2  : 2.70045E-03        (-0.00259619      0.0452448)
kT2 [keV]   : 9.24117        (-5.42999      -9.24994)
R2^2/D10^2  : 0.236063    (-0.181429   3.15043)
------------------------------------------------------------
#Fit statistic : Chi-Squared =          55.14 using 59 PHA bins.
#Fit statistic : Chi-Squared =          54.92 using 59 PHA bins.
# Reduced chi-squared =          1.002 for     55 degrees of freedom
# Reduced chi-squared =         0.9986 for     55 degrees of freedom
# Null hypothesis probability =   4.694745e-01
# Null hypothesis probability =   4.776409e-01

Energy  Fluence     90% Error
[keV]   [erg/cm2]   [erg/cm2]
15- 25  4.459e-09   2.937e-09
25- 50  1.134e-08   6.280e-09
50-150  2.588e-08   1.571e-08
15-150  4.168e-08   2.264e-08
Pre-slew spectrum (Pre-slew PHA with pre-slew DRM)
Power-law model
Spectral model in power-law:
------------------------------------------------------------
Parameters  : value       lower 90%   higher 90%
Photon index: 1.62256     ( -0.208911   0.214044 )
Norm@50keV  : 1.95787E-03    ( -0.000257725   0.000252945 )
------------------------------------------------------------
#Fit statistic : Chi-Squared =          43.19 using 59 PHA bins.
# Reduced chi-squared =         0.7577 for     57 degrees of freedom
# Null hypothesis probability =   9.117879e-01

Photon flux (15-150 keV)    in 15.52 sec: 0.253385 ( -0.0296646  0.0296705 ) ph/cm2/s
Energy fluence (15-150 keV)             : 2.83426e-07 ( -3.98578e-08  4.07133e-08 ) ergs/cm2
Cutoff power-law model
Spectral model in the cutoff power-law:
------------------------------------------------------------
Parameters  : value       lower 90%   higher 90%
Photon index: 1.50731     ( -0.907562   0.324837 )
Epeak [keV] : 189.118      ( -192.539 -192.539 )
Norm@50keV  : 2.27154E-03    ( -0.000559044   0.00498656 )
------------------------------------------------------------
#Fit statistic : Chi-Squared =          43.13 using 59 PHA bins.
# Reduced chi-squared =         0.7702 for     56 degrees of freedom
# Null hypothesis probability =   8.961425e-01

Photon flux (15-150 keV)    in 15.52 sec: 0.252171 ( -0.01543  0.030466 ) ph/cm2/s
Energy fluence (15-150 keV)             : 2.79674e-07 ( -4.81958e-08  4.38176e-08 ) ergs/cm2
Band function
Spectral model in the Band function:
------------------------------------------------------------
Parameters  : value       lower 90%   higher 90%
alpha       : 4.48925   ( -4.48925   -4.48925 )
beta        : -1.77526    ( -0.290876   0.258577 )
Epeak [keV] : 25.3753      ( -8.50592 5.16897 )
Norm@50keV   : 91.2441    ( -10.6083   1.22234e+06 )
------------------------------------------------------------
#Fit statistic : Chi-Squared =          41.61 using 59 PHA bins.
# Reduced chi-squared =         0.7565 for     55 degrees of freedom
# Null hypothesis probability =   9.087634e-01

Photon flux (15-150 keV)    in 15.52 sec:  (    ) ph/cm2/s
Energy fluence (15-150 keV)             : 0 ( 0  0 ) ergs/cm2
S(25-50 keV) vs. S(50-100 keV) plot
S(25-50 keV)  = 7.42e-08
S(50-100 keV) = 9.64e-08
T90 vs. Hardness ratio plot

T90                                   = 13.8160000145435 sec.
Hardness ratio (energy fluence ratio) = 1.29919
Color vs. Color plot

Count Ratio  (25-50 keV) / (15-25 keV) = 1.29366
Count Ratio (50-100 keV) / (15-25 keV) = 0.854068
Mask shadow pattern
IMX = -4.056294241503268E-01, IMY = 1.188761161799625E-02
TIME vs. PHA plot around the trigger time

Blue+Cyan dotted lines: Time interval of the scaled map
From 0.000000 to 1.408000
TIME vs. DetID plot around the trigger time
Blue+Cyan dotted lines: Time interval of the scaled map
From 0.000000 to 1.408000
100 us light curve (15-350 keV)
Blue+Cyan dotted lines: Time interval of the scaled map
From 0.000000 to 1.408000
Spacecraft aspect plot

Bright source in the pre-burst/pre-slew/post-slew images
Pre-burst image of 15-350 keV band
Time interval of the image:
-239.120000 -1.672000

# RAcent  DECcent POSerr Theta    Phi  PeakCts   SNR AngSep     Name
#  [deg]    [deg]    ['] [deg]  [deg]                   [']
254.3504  35.4530    9.0  37.3  -48.2   0.3554   1.3    8.5	Her X-1
204.9581  -2.2351    2.6  46.3   47.2   3.3904   4.4 ------	UNKNOWN
220.0524  24.3710    2.4  22.7   11.3   0.8379   4.8 ------	UNKNOWN
223.8137  42.3050    2.1  12.8  -42.8   0.8491   5.4 ------	UNKNOWN
272.4188  64.6508    3.3  41.1  -98.2   3.3110   3.6 ------	UNKNOWN
Pre-slew background subtracted image of 15-350 keV band
Time interval of the image:
-1.672000 13.848000

# RAcent  DECcent POSerr Theta    Phi  PeakCts   SNR AngSep     Name
#  [deg]    [deg]    ['] [deg]  [deg]                   [']
254.3080  35.2121   12.6  37.4  -47.9  -0.0549  -0.9   10.7	Her X-1
191.1070   6.1474    2.6  40.2   69.2   0.6407   4.5 ------	UNKNOWN
177.7695  57.1650    0.8  22.1 -178.3   0.4939  14.8 ------	UNKNOWN
233.1466  20.3869    2.1  32.5   -6.6   0.2241   5.5 ------	UNKNOWN
207.8806  52.8815    2.0   8.9 -128.7   0.1889   5.7 ------	UNKNOWN
Post-slew image of 15-350 keV band
Time interval of the image:
81.980600 93.980590

# RAcent  DECcent POSerr Theta    Phi  PeakCts   SNR AngSep     Name
#  [deg]    [deg]    ['] [deg]  [deg]                   [']
254.3764  35.4802    6.0  20.2   21.4  -0.0599  -1.9    9.2	Her X-1
268.4484  -1.4423    2.6  57.4   -0.9   0.8041   4.4    4.9	SW J1753.5-0127
288.7043  10.8776   20.3  50.2  -28.9  -0.0460  -0.6    6.9	GRS 1915+105
299.5540  35.1577    2.7  34.2  -60.5   0.2263   4.2    3.2	Cyg X-1
308.1798  41.0285    5.8  34.9  -76.3   0.1265   2.0    5.5	Cyg X-3
256.8826   0.3139    2.4  55.1   13.0   0.8086   4.9 ------	UNKNOWN
234.9479  45.9162    1.9  17.8   78.3   0.2117   6.2 ------	UNKNOWN
265.0477   6.2056    2.2  49.4    2.5   0.3417   5.3 ------	UNKNOWN
 89.7630  65.9263    2.0  58.4 -174.7   1.0499   5.6 ------	UNKNOWN
344.6890  56.7460    2.5  44.6 -118.5   0.5615   4.6 ------	UNKNOWN
Plot creation:
Sun May 31 08:00:11 EDT 2015