Click here for the BAT GCN circular template
Image
Pre-slew 15.0-350.0 keV image (Event data)
#   RAcent    DECcent   POSerr    Theta     Phi              Peak Cts       SNR   Name
  277.9034    36.5163   0.0161    55.8155  -165.2759         5.5479682     11.931 TRIG_00307604

Foreground time interval of the image:
-33.336  71.901 (delta_t = 105.237 [sec])
Background time interval of the image:
-323.000 -33.336 (delta_t = 289.664 [sec])
Lightcurves
Notes:
- 1) The mask-weighted light curves are using the flight position.
- 2) Multiple plots of different time binning/intervals are shown to cover all scenarios of short/long GRBs, rate/image triggers, and real/false positives.
- 3) For all the mask-weighted lightcurves, the y-axis units are counts/sec/det where a det is 0.4 x 0.4 = 0.16 sq cm.
- 4) The verticle lines correspond to following: green dotted lines are T50 interval, black dotted lines are T90 interval, blue solid line(s) is a spacecraft slew start time, and orange solid line(s) is a spacecraft slew end time.
- 5) Time of each bin is in the middle of the bin.
1 s binning
From T0-310 s to T0+310 s
From T100_start - 20 s to T100_end + 30 s

Full time interval

64 ms binning
Full time interval
From T100_start to T100_end

From T0-5 sec to T0+5 sec
16 ms binning
From T100_start-5 s to T100_start+5 s
Blue+Cyan dotted lines: Time interval of the scaled map
From 0.000000 to 64.000000
8 ms binning
From T100_start-3 s to T100_start+3 s
Blue+Cyan dotted lines: Time interval of the scaled map
From 0.000000 to 64.000000
2 ms binning
From T100_start-1 s to T100_start+1 s
Blue+Cyan dotted lines: Time interval of the scaled map
From 0.000000 to 64.000000
SN=5 or 10 sec. binning (whichever binning is satisfied first)

SN=5 or 10 sec. binning (T < 200 sec)
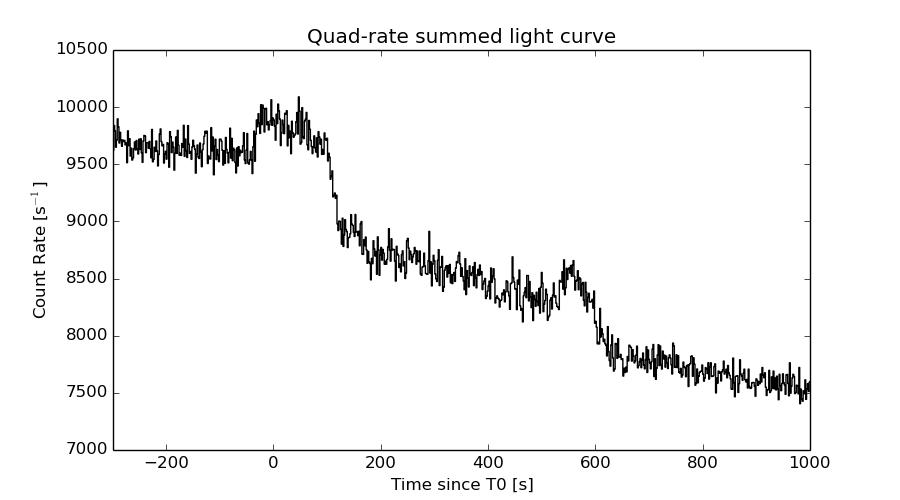
Quad-rate summed light curves (from T0-300s to T0+1000s)
Spectral Evolution

Spectra
Notes:
- 1) The fitting includes the systematic errors.
- 2) When the burst includes telescope slew time periods, the fitting uses an average response file made from multiple 5-s response files through out the slew time plus single time preiod for the non-slew times, and weighted by the total counts in the corresponding time period using addrmf. An average response file is needed becuase a spectral fit using the pre-slew DRM will introduce some errors in both a spectral shape and a normalization if the PHA file contains a lot of the slew/post-slew time interval.
- 3) For fits to more complicated models (e.g. a power-law over a cutoff power-law), the BAT team has decided to require a chi-square improvement of more than 6 for each extra dof.
Time averaged spectrum fit using the average DRM
Power-law model

Time interval is from  -33.336 sec. to  170.028 sec.

Spectral model in power-law:
------------------------------------------------------------
Parameters  : value       lower 90%   higher 90%
Photon index: 1.55975     ( -0.162121   0.162894 )
Norm@50keV  : 2.61946E-03    ( -0.000223514   0.000223388 )
------------------------------------------------------------
#Fit statistic : Chi-Squared =          49.62 using 59 PHA bins.
# Reduced chi-squared =         0.8705 for     57 degrees of freedom
# Null hypothesis probability =   7.456018e-01

Photon flux (15-150 keV)    in 203.4 sec: 0.332550 ( -0.0316224  0.0318618 ) ph/cm2/s
Energy fluence (15-150 keV)             : 5.00907e-06 ( -4.46087e-07  4.48151e-07 ) ergs/cm2
Cutoff power-law model
Time interval is from  -33.336 sec. to  170.028 sec.
Spectral model in the cutoff power-law:
------------------------------------------------------------
Parameters  : value       lower 90%   higher 90%
Photon index: 2.24451     ( -0.169323   0.157919 )
Epeak [keV] : 93.3028      ( -9999.36 -9999.36 )
Norm@50keV  : 1.09261E-03    (     )
------------------------------------------------------------
#Fit statistic : Chi-Squared =          48.60 using 59 PHA bins.
# Reduced chi-squared =         0.8679 for     56 degrees of freedom
# Null hypothesis probability =   7.480798e-01

Photon flux (15-150 keV)    in 203.4 sec: 0.334282 ( -0.03373  0.030208 ) ph/cm2/s
Energy fluence (15-150 keV)             : 4.98897e-06 ( -4.30557e-07  4.59928e-07 ) ergs/cm2
Band function

Time interval is from  -33.336 sec. to  170.028 sec.

Spectral model in the Band function:
------------------------------------------------------------
Parameters  : value       lower 90%   higher 90%
alpha       : -1.30268   ( 1.30268   1.30268 )
beta        : -1.55972    ( -0.163086   0.162236 )
Epeak [keV] : 21.4661      ( -21.4661 -21.4661 )
Norm@50keV   : 5.44058E-03    ( -0.00232827   0.380993 )
------------------------------------------------------------
#Fit statistic : Chi-Squared =          49.62 using 59 PHA bins.
# Reduced chi-squared =         0.9021 for     55 degrees of freedom
# Null hypothesis probability =   6.797334e-01

Photon flux (15-150 keV)    in 203.4 sec:  (    ) ph/cm2/s
Energy fluence (15-150 keV)             : 0 ( 0  0 ) ergs/cm2
Single BB
Spectral model blackbody:
------------------------------------------------------------
Parameters  : value    Lower 90%  Upper 90%
kT [keV]    : 17.6261  (-2.01564  2.32196)
R^2/D10^2   : 2.01531E-02  (-0.00711111   0.0108562)
(R is the radius in km and D10 is the distance to the source in units of 10 kpc)
------------------------------------------------------------
#Fit statistic : Chi-Squared =          97.24 using 59 PHA bins.
# Reduced chi-squared =          1.706 for     57 degrees of freedom
# Null hypothesis probability =   7.139086e-04

Energy  Fluence     90% Error
[keV]   [erg/cm2]   [erg/cm2]
15- 25  2.567e-07   4.507e-08
25- 50  1.168e-06   1.621e-07
50-150  2.620e-06   3.976e-07
15-150  4.045e-06   4.587e-07
Thermal bremsstrahlung (OTTB)
Spectral model: thermal bremsstrahlung
------------------------------------------------------------
Parameters  : value         Lower 90%    Upper 90%
kT [keV]    : 200.000       (      )
Norm        : 1.34598       (-0.115134     0.115122)
------------------------------------------------------------
#Fit statistic : Chi-Squared =          52.63 using 59 PHA bins.
# Reduced chi-squared =         0.9234 for     57 degrees of freedom
# Null hypothesis probability =   6.395417e-01

Energy  Fluence     90% Error
[keV]   [erg/cm2]   [erg/cm2]
15- 25  6.819e-07   7.627e-08
25- 50  1.312e-06   1.851e-07
50-150  2.877e-06   1.048e-06
15-150  4.870e-06   1.079e-06
Double BB

Spectral model: bbodyrad<1> + bbodyrad<2>
------------------------------------------------------------
Parameters  : value         Lower 90%    Upper 90%
kT1 [keV]   : 5.63290        (-1.4548      1.87809)
R1^2/D10^2  : 0.883093        (-0.596729      2.46301)
kT2 [keV]   : 27.1083        (-4.99177      8.87502)
R2^2/D10^2  : 3.91790E-03    (-0.00240574   0.00417429)
------------------------------------------------------------
#Fit statistic : Chi-Squared =          50.62 using 59 PHA bins.
# Reduced chi-squared =         0.9203 for     55 degrees of freedom
# Null hypothesis probability =   6.426304e-01

Energy  Fluence     90% Error
[keV]   [erg/cm2]   [erg/cm2]
15- 25  7.850e-07   3.856e-07
25- 50  1.170e-06   3.889e-07
50-150  3.121e-06   9.065e-07
15-150  5.076e-06   1.160e-06
Peak spectrum fit
Power-law model
Time interval is from   43.800 sec. to   44.800 sec.

Spectral model in power-law:
------------------------------------------------------------
Parameters  : value       lower 90%   higher 90%
Photon index: 2.52716     ( -5.05047   2.4346 )
Norm@50keV  : 7.14361E-03    ( -0.00704237   0.00570705 )
------------------------------------------------------------
#Fit statistic : Chi-Squared =          64.31 using 59 PHA bins.
# Reduced chi-squared =          1.128 for     57 degrees of freedom
# Null hypothesis probability =   2.358706e-01

Photon flux (15-150 keV)    in 1 sec: 1.43009 ( -1.43103  0.647196 ) ph/cm2/s
Energy fluence (15-150 keV)             : 7.14721e-08 ( -7.13192e-08  4.66627e-08 ) ergs/cm2
Cutoff power-law model

Time interval is from   43.800 sec. to   44.800 sec.
Spectral model in the cutoff power-law:
------------------------------------------------------------
Parameters  : value       lower 90%   higher 90%
Photon index: 2.01646     (     )
Epeak [keV] : 51.4504      (   )
Norm@50keV  : 8.63858E-03    (     )
------------------------------------------------------------
#Fit statistic : Chi-Squared =          64.52 using 59 PHA bins.
# Reduced chi-squared =          1.152 for     56 degrees of freedom
# Null hypothesis probability =   2.033551e-01

Photon flux (15-150 keV)    in 1 sec: 1.45231 ( -1.45231  0.63445 ) ph/cm2/s
Energy fluence (15-150 keV)             : 7.40927e-08 ( -7.40927e-08  4.00943e-08 ) ergs/cm2
Band function

Time interval is from   43.800 sec. to   44.800 sec.

Spectral model in the Band function:
------------------------------------------------------------
Parameters  : value       lower 90%   higher 90%
alpha       : -9.99497   ( 9.99497   9.99497 )
beta        : -2.54020    ( -2.40057   8.14246 )
Epeak [keV] : 9.27247      ( -9.27247 -9.27247 )
Norm@50keV   : 0.964133    ( -0.941718   0.791001 )
------------------------------------------------------------
#Fit statistic : Chi-Squared =          64.31 using 59 PHA bins.
# Reduced chi-squared =          1.169 for     55 degrees of freedom
# Null hypothesis probability =   1.827044e-01

Photon flux (15-150 keV)    in 1 sec:  (    ) ph/cm2/s
Energy fluence (15-150 keV)             : 0 ( 0  0 ) ergs/cm2
Single BB
Spectral model blackbody:
------------------------------------------------------------
Parameters  : value    Lower 90%  Upper 90%
kT [keV]    : 4.41346  (-1.63934  2.32166)
R^2/D10^2   : 21.8391  (-21.8391   262.104)
(R is the radius in km and D10 is the distance to the source in units of 10 kpc)
------------------------------------------------------------
#Fit statistic : Chi-Squared =          65.19 using 59 PHA bins.
# Reduced chi-squared =          1.144 for     57 degrees of freedom
# Null hypothesis probability =   2.132817e-01

Energy  Fluence     90% Error
[keV]   [erg/cm2]   [erg/cm2]
15- 25  3.136e-08   1.978e-08
25- 50  1.486e-08   1.070e-08
50-150  3.180e-10   3.665e-10
15-150  4.654e-08   3.069e-08
Thermal bremsstrahlung (OTTB)

Spectral model: thermal bremsstrahlung
------------------------------------------------------------
Parameters  : value         Lower 90%    Upper 90%
kT [keV]    : 11.4439       (-6.55164      -11.4439)
Norm        : 36.9554       (-36.9555     252.916)
------------------------------------------------------------
#Fit statistic : Chi-Squared =          65.40 using 59 PHA bins.
# Reduced chi-squared =          1.147 for     57 degrees of freedom
# Null hypothesis probability =   2.080758e-01

Energy  Fluence     90% Error
[keV]   [erg/cm2]   [erg/cm2]
15- 25  3.100e-08   1.889e-08
25- 50  1.585e-08   1.096e-08
50-150  1.541e-09   1.696e-09
15-150  4.839e-08   3.126e-08
Double BB
------------------------------------------------------------
Parameters  : value         Lower 90%    Upper 90%
kT1 [keV]   : 4.15343        (-1.68609      1.71212)
R1^2/D10^2  : 28.6246        (-20.4401      55.3894)
kT2 [keV]   : 200.000        (      )
R2^2/D10^2  : 2.28019E-04    (-0.000118498   0.00106951)
------------------------------------------------------------
#Fit statistic : Chi-Squared =          55.21 using 59 PHA bins.
#Fit statistic : Chi-Squared =          55.19 using 59 PHA bins.
# Reduced chi-squared =          1.004 for     55 degrees of freedom
# Reduced chi-squared =          1.003 for     55 degrees of freedom
# Null hypothesis probability =   4.668218e-01
# Null hypothesis probability =   4.675639e-01

Energy  Fluence     90% Error
[keV]   [erg/cm2]   [erg/cm2]
15- 25  3.089e-08   1.867e-08
25- 50  1.608e-08   9.260e-09
50-150  5.992e-08   2.431e-08
15-150  1.069e-07   3.218e-08
Pre-slew spectrum (Pre-slew PHA with pre-slew DRM)
Power-law model

Spectral model in power-law:
------------------------------------------------------------
Parameters  : value       lower 90%   higher 90%
Photon index: 1.46067     ( -0.187051   0.185549 )
Norm@50keV  : 4.10927E-03    ( -0.000406591   0.00040518 )
------------------------------------------------------------
#Fit statistic : Chi-Squared =          39.88 using 59 PHA bins.
# Reduced chi-squared =         0.6996 for     57 degrees of freedom
# Null hypothesis probability =   9.587118e-01

Photon flux (15-150 keV)    in 105.2 sec: 0.507765 ( -0.057496  0.0581534 ) ph/cm2/s
Energy fluence (15-150 keV)             : 4.12872e-06 ( -4.1418e-07  4.1521e-07 ) ergs/cm2
Cutoff power-law model
Spectral model in the cutoff power-law:
------------------------------------------------------------
Parameters  : value       lower 90%   higher 90%
Photon index: 1.45791     ( -0.338617   0.186449 )
Epeak [keV] : 9999.36      ( -9999.36 -9999.36 )
Norm@50keV  : 4.12265E-03    ( -0.00412265   0.00202439 )
------------------------------------------------------------
#Fit statistic : Chi-Squared =          39.89 using 59 PHA bins.
# Reduced chi-squared =         0.7124 for     56 degrees of freedom
# Null hypothesis probability =   9.488730e-01

Photon flux (15-150 keV)    in 105.2 sec: 0.511035 ( -0.061427  0.054495 ) ph/cm2/s
Energy fluence (15-150 keV)             : 4.12327e-06 ( -4.13026e-07  4.1635e-07 ) ergs/cm2
Band function
Spectral model in the Band function:
------------------------------------------------------------
Parameters  : value       lower 90%   higher 90%
alpha       : -1.23030   ( 1.2303   1.2303 )
beta        : -1.46065    ( -0.185498   0.187011 )
Epeak [keV] : 23.1188      ( -23.1188 -23.1188 )
Norm@50keV   : 8.15936E-03    ( -0.00445378   0.605417 )
------------------------------------------------------------
#Fit statistic : Chi-Squared =          39.88 using 59 PHA bins.
# Reduced chi-squared =         0.7250 for     55 degrees of freedom
# Null hypothesis probability =   9.376399e-01

Photon flux (15-150 keV)    in 105.2 sec:  (    ) ph/cm2/s
Energy fluence (15-150 keV)             : 0 ( 0  0 ) ergs/cm2
S(25-50 keV) vs. S(50-100 keV) plot

S(25-50 keV)  = 1.27e-06
S(50-100 keV) = 1.73e-06
T90 vs. Hardness ratio plot
T90                                   = 166.740000009537 sec.
Hardness ratio (energy fluence ratio) = 1.3622
Color vs. Color plot

Count Ratio  (25-50 keV) / (15-25 keV) = 1.24637
Count Ratio (50-100 keV) / (15-25 keV) = 1.13468
Mask shadow pattern

IMX = -1.423964840634192E+00, IMY = 3.742103009276630E-01
TIME vs. PHA plot around the trigger time
Blue+Cyan dotted lines: Time interval of the scaled map
From 0.000000 to 64.000000
TIME vs. DetID plot around the trigger time

Blue+Cyan dotted lines: Time interval of the scaled map
From 0.000000 to 64.000000
100 us light curve (15-350 keV)
Blue+Cyan dotted lines: Time interval of the scaled map
From 0.000000 to 64.000000
Spacecraft aspect plot
Bright source in the pre-burst/pre-slew/post-slew images
Pre-burst image of 15-350 keV band
Time interval of the image:
-323.000000 -33.336000

# RAcent  DECcent POSerr Theta    Phi  PeakCts   SNR AngSep     Name
#  [deg]    [deg]    ['] [deg]  [deg]                   [']
244.9851 -15.6437    0.3  26.6  102.7  13.9691  41.6    0.4	Sco X-1
256.0047 -37.8386   12.7  23.7   43.8   0.2387   0.9    0.9	4U 1700-377
256.4226 -36.3957    3.4  22.4   45.6   0.8712   3.4    1.8	GX 349+2
263.0684 -24.5916    6.1  10.4   65.9   0.3975   1.9    9.8	GX 1+4
264.7788 -44.4615  606.1  26.2   22.3   0.0047   0.0    1.7	4U 1735-44
268.3510  -1.4067    3.2  18.2  175.8   0.7904   3.6    2.9	SW J1753.5-0127
270.2532 -25.1350    2.9   6.4   29.0   0.9307   4.0    3.7	GX 5-1
270.4783 -25.8180    7.8   7.0   25.5   0.3503   1.5   10.5	GRS 1758-258
274.1067 -14.1291    3.2   5.1 -154.0   0.8356   3.6    8.1	GX 17+2
275.8813 -30.3850    1.9  11.7   -4.5   1.4668   6.2    2.5	H1820-303
284.8421 -24.8241    4.6  12.7  -51.3   0.5810   2.5   12.0	HT1900.1-2455
288.7959  10.9322    7.3  34.0 -141.1   0.4574   1.6    0.8	GRS 1915+105
262.8337 -33.9914    0.0  17.3   37.9   0.3092   1.2   12.2	GX 354-0
250.5244   1.3033    2.4  29.8  140.4   1.4849   4.8 ------	UNKNOWN
267.2978 -26.6379    1.6   9.0   41.5   1.6296   7.1 ------	UNKNOWN
285.3758 -51.3951    2.8  33.9   -4.8   1.3330   4.2 ------	UNKNOWN
320.2097 -62.3339    2.4  54.2  -15.4   3.5990   4.8 ------	UNKNOWN
294.2971   1.8125    2.7  29.8 -122.5   1.2407   4.3 ------	UNKNOWN
326.8394 -39.4148    4.7  50.6  -44.6   3.5475   2.5 ------	UNKNOWN
Pre-slew background subtracted image of 15-350 keV band
Time interval of the image:
-33.336000 71.900600

# RAcent  DECcent POSerr Theta    Phi  PeakCts   SNR AngSep     Name
#  [deg]    [deg]    ['] [deg]  [deg]                   [']
244.8824 -15.7194  131.8  26.6  102.4   0.0148   0.1    7.3	Sco X-1
255.9858 -37.8440   46.6  23.7   43.8  -0.0331  -0.2    0.0	4U 1700-377
256.4367 -36.4244  102.7  22.4   45.6  -0.0147  -0.1    0.1	GX 349+2
263.1547 -24.5838    0.0  10.4   65.8  -0.2383  -2.1   12.5	GX 1+4
264.7629 -44.3324   18.1  26.1   22.4  -0.0894  -0.6    7.1	4U 1735-44
268.4966  -1.3491    3.8  18.2  176.3  -0.3358  -3.1    9.9	SW J1753.5-0127
270.4446 -25.0423   13.3   6.3   27.8   0.1033   0.9    9.0	GX 5-1
270.4502 -25.6291   11.4   6.9   26.1   0.1320   1.1   10.5	GRS 1758-258
273.9913 -13.9454   18.3   5.3 -155.7   0.0703   0.6    5.5	GX 17+2
276.0831 -30.2989   12.8  11.7   -5.4   0.1063   0.9    9.2	H1820-303
285.1796 -25.0366  738.3  13.1  -51.1   0.0017   0.0   10.5	HT1900.1-2455
288.8584  11.0120    5.7  34.1 -141.1   0.3037   2.0    5.3	GRS 1915+105
263.0010 -33.8181  287.5  17.0   37.8   0.0048   0.0    1.2	GX 354-0
280.2351  14.0264    1.9  33.9 -157.1   0.8281   6.1 ------	UNKNOWN
277.9034  36.5163    1.0  55.8 -165.3   5.5473  11.9 ------	UNKNOWN
283.7191  26.4876    2.5  46.8 -156.7   1.0349   4.6 ------	UNKNOWN
302.8515 -14.1157    2.5  29.4  -85.5   0.7552   4.5 ------	UNKNOWN
283.8394  38.8757    2.6  58.9 -160.2   3.2901   4.4 ------	UNKNOWN
Post-slew image of 15-350 keV band
Time interval of the image:
141.100600 511.800590

# RAcent  DECcent POSerr Theta    Phi  PeakCts   SNR AngSep     Name
#  [deg]    [deg]    ['] [deg]  [deg]                   [']
254.4624  35.3365    0.9  19.0   93.2   3.2457  12.7    0.4	Her X-1
268.3866  -1.4013    3.8  38.9   14.9   0.9820   3.1    3.3	SW J1753.5-0127
274.0458 -13.8874    5.2  50.5    4.5   1.2499   2.2    9.2	GX 17+2
288.8301  10.9451    1.6  27.4  -24.2   1.6878   7.2    1.9	GRS 1915+105
299.5895  35.1996    0.4  17.6  -92.5   6.5752  28.8    0.1	Cyg X-1
308.0748  40.9900    3.0  23.8 -110.4   1.0497   3.9    2.8	Cyg X-3
326.2673  38.2657   10.5  38.0 -108.0   0.7449   1.1    5.6	Cyg X-2
245.7964   1.4475    3.7  45.9   47.4   3.3885   3.1 ------	UNKNOWN
216.6609  69.2903    3.0  46.1  154.2   2.2934   3.9 ------	UNKNOWN
289.8213  68.1432    2.5  32.3 -172.0   1.0959   4.6 ------	UNKNOWN
 40.7373  83.5207    3.5  57.2 -173.8   4.2875   3.3 ------	UNKNOWN
Plot creation:
Sun May 31 07:58:35 EDT 2015