Click here for the BAT GCN circular template
Image
Pre-slew 15.0-350.0 keV image (Event data)
#   RAcent    DECcent   POSerr    Theta     Phi              Peak Cts       SNR   Name
   80.4924    47.5232   0.0035    45.0336     2.0473         6.7397717     54.810 TRIG_00307931

Foreground time interval of the image:
 -2.244  19.637 (delta_t =  21.881 [sec])
Background time interval of the image:
-239.264  -2.244 (delta_t = 237.020 [sec])
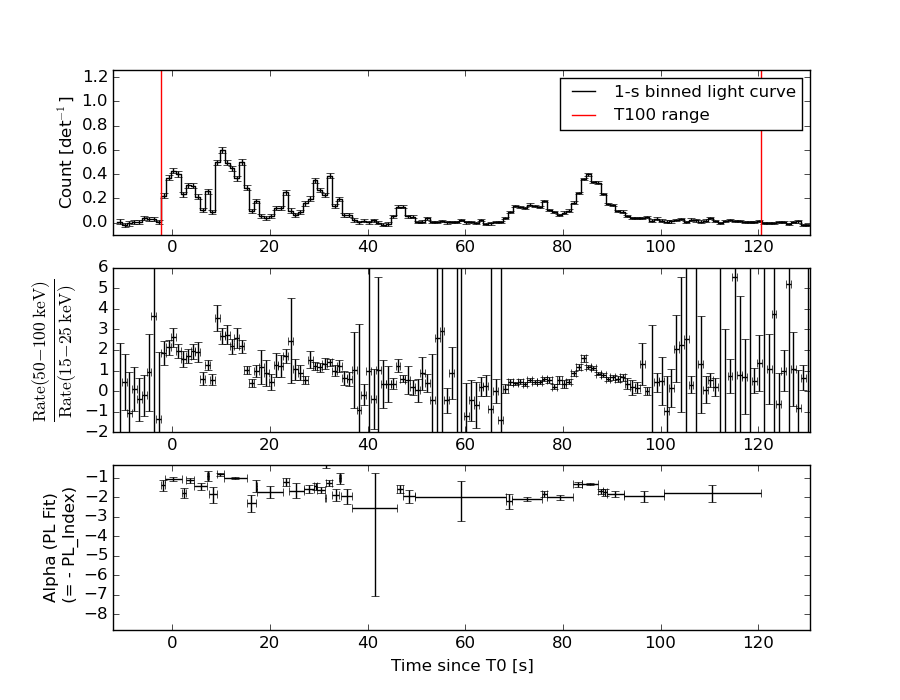
Lightcurves
Notes:
- 1) The mask-weighted light curves are using the flight position.
- 2) Multiple plots of different time binning/intervals are shown to cover all scenarios of short/long GRBs, rate/image triggers, and real/false positives.
- 3) For all the mask-weighted lightcurves, the y-axis units are counts/sec/det where a det is 0.4 x 0.4 = 0.16 sq cm.
- 4) The verticle lines correspond to following: green dotted lines are T50 interval, black dotted lines are T90 interval, blue solid line(s) is a spacecraft slew start time, and orange solid line(s) is a spacecraft slew end time.
- 5) Time of each bin is in the middle of the bin.
1 s binning
From T0-310 s to T0+310 s

From T100_start - 20 s to T100_end + 30 s
Full time interval
64 ms binning
Full time interval
From T100_start to T100_end

From T0-5 sec to T0+5 sec
16 ms binning
From T100_start-5 s to T100_start+5 s

Blue+Cyan dotted lines: Time interval of the scaled map
From 0.000000 to 1.024000
8 ms binning
From T100_start-3 s to T100_start+3 s
Blue+Cyan dotted lines: Time interval of the scaled map
From 0.000000 to 1.024000
2 ms binning
From T100_start-1 s to T100_start+1 s
Blue+Cyan dotted lines: Time interval of the scaled map
From 0.000000 to 1.024000
SN=5 or 10 sec. binning (whichever binning is satisfied first)
SN=5 or 10 sec. binning (T < 200 sec)
Quad-rate summed light curves (from T0-300s to T0+1000s)

Spectral Evolution
Spectra
Notes:
- 1) The fitting includes the systematic errors.
- 2) When the burst includes telescope slew time periods, the fitting uses an average response file made from multiple 5-s response files through out the slew time plus single time preiod for the non-slew times, and weighted by the total counts in the corresponding time period using addrmf. An average response file is needed becuase a spectral fit using the pre-slew DRM will introduce some errors in both a spectral shape and a normalization if the PHA file contains a lot of the slew/post-slew time interval.
- 3) For fits to more complicated models (e.g. a power-law over a cutoff power-law), the BAT team has decided to require a chi-square improvement of more than 6 for each extra dof.
Time averaged spectrum fit using the average DRM
Power-law model

Time interval is from   -2.244 sec. to  120.620 sec.

Spectral model in power-law:
------------------------------------------------------------
Parameters  : value       lower 90%   higher 90%
Photon index: 1.40794     ( -0.0416571   0.0415358 )
Norm@50keV  : 8.02198E-03    ( -0.000170339   0.000170198 )
------------------------------------------------------------
#Fit statistic : Chi-Squared =          55.52 using 59 PHA bins.
# Reduced chi-squared =         0.9740 for     57 degrees of freedom
# Null hypothesis probability =   5.307797e-01

Photon flux (15-150 keV)    in 122.9 sec: 0.978702 ( -0.02397  0.0240661 ) ph/cm2/s
Energy fluence (15-150 keV)             : 9.51111e-06 ( -2.05539e-07  2.05784e-07 ) ergs/cm2
Cutoff power-law model
Time interval is from   -2.244 sec. to  120.620 sec.
Spectral model in the cutoff power-law:
------------------------------------------------------------
Parameters  : value       lower 90%   higher 90%
Photon index: 1.40717     ( -0.079837   0.039942 )
Epeak [keV] : 9999.35      ( -9999.36 -9999.36 )
Norm@50keV  : 8.03926E-03    ( -0.00016945   0.000643899 )
------------------------------------------------------------
#Fit statistic : Chi-Squared =          55.64 using 59 PHA bins.
# Reduced chi-squared =         0.9935 for     56 degrees of freedom
# Null hypothesis probability =   4.884924e-01

Photon flux (15-150 keV)    in 122.9 sec: 0.979738 ( -0.025725  0.022572 ) ph/cm2/s
Energy fluence (15-150 keV)             : 9.51145e-06 ( -2.01445e-07  1.99381e-07 ) ergs/cm2
Band function

Time interval is from   -2.244 sec. to  120.620 sec.

Spectral model in the Band function:
------------------------------------------------------------
Parameters  : value       lower 90%   higher 90%
alpha       : -1.12281   ( 1.12283   1.12283 )
beta        : -1.40794    ( -0.0415397   0.0415987 )
Epeak [keV] : 36.7517      ( -36.7437 -36.7437 )
Norm@50keV   : 1.60468E-02    ( -0.00574769   0.682438 )
------------------------------------------------------------
#Fit statistic : Chi-Squared =          55.52 using 59 PHA bins.
# Reduced chi-squared =          1.009 for     55 degrees of freedom
# Null hypothesis probability =   4.550268e-01

Photon flux (15-150 keV)    in 122.9 sec:  (    ) ph/cm2/s
Energy fluence (15-150 keV)             : 0 ( 0  0 ) ergs/cm2
Single BB
Spectral model blackbody:
------------------------------------------------------------
Parameters  : value    Lower 90%  Upper 90%
kT [keV]    : 19.0275  (  )
R^2/D10^2   : 4.76895E-02  (   )
(R is the radius in km and D10 is the distance to the source in units of 10 kpc)
------------------------------------------------------------
#Fit statistic : Chi-Squared =         584.53 using 59 PHA bins.
# Reduced chi-squared =         10.255 for     57 degrees of freedom
# Null hypothesis probability =   1.459966e-88

Energy  Fluence     90% Error
[keV]   [erg/cm2]   [erg/cm2]
15- 25  4.169e-07   1.788e-08
25- 50  2.007e-06   6.329e-08
50-150  5.342e-06   1.837e-07
15-150  7.766e-06   1.825e-07
Thermal bremsstrahlung (OTTB)

Spectral model: thermal bremsstrahlung
------------------------------------------------------------
Parameters  : value         Lower 90%    Upper 90%
kT [keV]    : 199.363       (      )
Norm        : 4.11437       (     )
------------------------------------------------------------
#Fit statistic : Chi-Squared =         132.93 using 59 PHA bins.
# Reduced chi-squared =         2.3322 for     57 degrees of freedom
# Null hypothesis probability =   5.266184e-08

Energy  Fluence     90% Error
[keV]   [erg/cm2]   [erg/cm2]
15- 25  1.259e-06   3.202e-08
25- 50  2.422e-06   5.899e-08
50-150  5.312e-06   1.364e-07
15-150  8.993e-06   2.157e-07
Double BB
Spectral model: bbodyrad<1> + bbodyrad<2>
------------------------------------------------------------
Parameters  : value         Lower 90%    Upper 90%
kT1 [keV]   : 8.02091        (-0.63809      0.676219)
R1^2/D10^2  : 0.614739        (-0.147605      0.209011)
kT2 [keV]   : 33.7392        (-2.80897      3.57411)
R2^2/D10^2  : 5.81522E-03    (-0.00161523   0.00196792)
------------------------------------------------------------
#Fit statistic : Chi-Squared =          69.84 using 59 PHA bins.
# Reduced chi-squared =          1.270 for     55 degrees of freedom
# Null hypothesis probability =   8.587758e-02

Energy  Fluence     90% Error
[keV]   [erg/cm2]   [erg/cm2]
15- 25  9.987e-07   8.628e-08
25- 50  2.310e-06   9.893e-08
50-150  6.208e-06   2.986e-07
15-150  9.517e-06   3.681e-07
Peak spectrum fit
Power-law model
Time interval is from    9.280 sec. to   10.280 sec.

Spectral model in power-law:
------------------------------------------------------------
Parameters  : value       lower 90%   higher 90%
Photon index: 0.837181     ( -0.106768   0.104507 )
Norm@50keV  : 4.75190E-02    ( -0.00298625   0.00296418 )
------------------------------------------------------------
#Fit statistic : Chi-Squared =          86.36 using 59 PHA bins.
# Reduced chi-squared =          1.515 for     57 degrees of freedom
# Null hypothesis probability =   7.278158e-03

Photon flux (15-150 keV)    in 1 sec: 5.45592 ( -0.337433  0.338085 ) ph/cm2/s
Energy fluence (15-150 keV)             : 5.46811e-07 ( -3.40556e-08  3.40963e-08 ) ergs/cm2
Cutoff power-law model

Time interval is from    9.280 sec. to   10.280 sec.
Spectral model in the cutoff power-law:
------------------------------------------------------------
Parameters  : value       lower 90%   higher 90%
Photon index: 0.669985     ( -0.442996   0.213161 )
Epeak [keV] : 498.737      ( -498.737 -498.737 )
Norm@50keV  : 5.56390E-02    ( -0.0140276   0.0275314 )
------------------------------------------------------------
#Fit statistic : Chi-Squared =          85.88 using 59 PHA bins.
# Reduced chi-squared =          1.534 for     56 degrees of freedom
# Null hypothesis probability =   6.261949e-03

Photon flux (15-150 keV)    in 1 sec: 5.42613 ( -0.34447  0.34552 ) ph/cm2/s
Energy fluence (15-150 keV)             : 5.45528e-07 ( -3.4612e-08  3.4498e-08 ) ergs/cm2
Band function

Time interval is from    9.280 sec. to   10.280 sec.

Spectral model in the Band function:
------------------------------------------------------------
Parameters  : value       lower 90%   higher 90%
alpha       : -0.820953   ( 0.82046   0.82046 )
beta        : -0.858585    ( -0.104479   0.106826 )
Epeak [keV] : 10000.00      ( -10000 -10000 )
Norm@50keV   : 4.77622E-02    ( -0.00321021   0.00279987 )
------------------------------------------------------------
#Fit statistic : Chi-Squared =          86.34 using 59 PHA bins.
# Reduced chi-squared =          1.570 for     55 degrees of freedom
# Null hypothesis probability =   4.424985e-03

Photon flux (15-150 keV)    in 1 sec:  (    ) ph/cm2/s
Energy fluence (15-150 keV)             : 0 ( 0  0 ) ergs/cm2
Single BB

Spectral model blackbody:
------------------------------------------------------------
Parameters  : value    Lower 90%  Upper 90%
kT [keV]    : 26.2038  (  )
R^2/D10^2   : 0.120485  (   )
(R is the radius in km and D10 is the distance to the source in units of 10 kpc)
------------------------------------------------------------
#Fit statistic : Chi-Squared =         124.78 using 59 PHA bins.
# Reduced chi-squared =         2.1892 for     57 degrees of freedom
# Null hypothesis probability =   5.685078e-07

Energy  Fluence     90% Error
[keV]   [erg/cm2]   [erg/cm2]
15- 25  1.401e-08   1.810e-09
25- 50  8.136e-08   7.785e-09
50-150  4.109e-07   3.610e-08
15-150  5.062e-07   3.725e-08
Thermal bremsstrahlung (OTTB)
Spectral model: thermal bremsstrahlung
------------------------------------------------------------
Parameters  : value         Lower 90%    Upper 90%
kT [keV]    : 199.363       (      )
Norm        : 21.9477       (     )
------------------------------------------------------------
#Fit statistic : Chi-Squared =         212.35 using 59 PHA bins.
# Reduced chi-squared =         3.7255 for     57 degrees of freedom
# Null hypothesis probability =   9.417451e-20

Energy  Fluence     90% Error
[keV]   [erg/cm2]   [erg/cm2]
15- 25  5.465e-08   4.305e-09
25- 50  1.051e-07   8.315e-09
50-150  2.306e-07   5.795e-08
15-150  3.903e-07   6.055e-08
Double BB
Spectral model: bbodyrad<1> + bbodyrad<2>
------------------------------------------------------------
Parameters  : value         Lower 90%    Upper 90%
kT1 [keV]   : 10.2415        (-3.02781      3.98252)
R1^2/D10^2  : 1.03765        (-0.570413      1.82929)
kT2 [keV]   : 43.2142        (-9.87909      35.936)
R2^2/D10^2  : 2.37698E-02    (-0.018726   0.021999)
------------------------------------------------------------
#Fit statistic : Chi-Squared =          87.00 using 59 PHA bins.
# Reduced chi-squared =          1.582 for     55 degrees of freedom
# Null hypothesis probability =   3.856365e-03

Energy  Fluence     90% Error
[keV]   [erg/cm2]   [erg/cm2]
15- 25  2.775e-08   1.224e-08
25- 50  9.516e-08   2.692e-08
50-150  4.274e-07   1.804e-07
15-150  5.503e-07   2.034e-07
Pre-slew spectrum (Pre-slew PHA with pre-slew DRM)
Power-law model
Spectral model in power-law:
------------------------------------------------------------
Parameters  : value       lower 90%   higher 90%
Photon index: 1.14047     ( -0.0491068   0.0487832 )
Norm@50keV  : 2.09730E-02    ( -0.000575306   0.000573168 )
------------------------------------------------------------
#Fit statistic : Chi-Squared =          56.36 using 59 PHA bins.
# Reduced chi-squared =         0.9887 for     57 degrees of freedom
# Null hypothesis probability =   4.991533e-01

Photon flux (15-150 keV)    in 21.88 sec: 2.44316 ( -0.0719362  0.0722266 ) ph/cm2/s
Energy fluence (15-150 keV)             : 4.73763e-06 ( -1.28221e-07  1.28275e-07 ) ergs/cm2
Cutoff power-law model
Spectral model in the cutoff power-law:
------------------------------------------------------------
Parameters  : value       lower 90%   higher 90%
Photon index: 1.08442     ( -0.176718   0.0765336 )
Epeak [keV] : 938.074      ( -981.475 -981.475 )
Norm@50keV  : 2.21286E-02    ( -0.00233839   0.00386224 )
------------------------------------------------------------
#Fit statistic : Chi-Squared =          56.43 using 59 PHA bins.
# Reduced chi-squared =          1.008 for     56 degrees of freedom
# Null hypothesis probability =   4.585909e-01

Photon flux (15-150 keV)    in 21.88 sec: 2.44040 ( -0.07007  0.0736 ) ph/cm2/s
Energy fluence (15-150 keV)             : 4.73076e-06 ( -1.28851e-07  1.37428e-07 ) ergs/cm2
Band function

Spectral model in the Band function:
------------------------------------------------------------
Parameters  : value       lower 90%   higher 90%
alpha       : -0.968273   ( 0.816673   0.816673 )
beta        : -1.17217    ( 1.18087   0.0844493 )
Epeak [keV] : 290.730      ( -327.289 -327.289 )
Norm@50keV   : 2.54704E-02    ( -0.00305346   0 )
------------------------------------------------------------
#Fit statistic : Chi-Squared =          55.84 using 59 PHA bins.
# Reduced chi-squared =          1.015 for     55 degrees of freedom
# Null hypothesis probability =   4.430875e-01

Photon flux (15-150 keV)    in 21.88 sec:  (    ) ph/cm2/s
Energy fluence (15-150 keV)             : 0 ( 0  0 ) ergs/cm2
S(25-50 keV) vs. S(50-100 keV) plot
S(25-50 keV)  = 2.24e-06
S(50-100 keV) = 3.38e-06
T90 vs. Hardness ratio plot

T90                                   = 91.108000010252 sec.
Hardness ratio (energy fluence ratio) = 1.50893
Color vs. Color plot
Count Ratio  (25-50 keV) / (15-25 keV) = 1.36545
Count Ratio (50-100 keV) / (15-25 keV) = 1.19761
Mask shadow pattern
IMX = 1.000534735716935E+00, IMY = -3.576715780596132E-02
TIME vs. PHA plot around the trigger time
Blue+Cyan dotted lines: Time interval of the scaled map
From 0.000000 to 1.024000
TIME vs. DetID plot around the trigger time

Blue+Cyan dotted lines: Time interval of the scaled map
From 0.000000 to 1.024000
100 us light curve (15-350 keV)
Blue+Cyan dotted lines: Time interval of the scaled map
From 0.000000 to 1.024000
Spacecraft aspect plot

Bright source in the pre-burst/pre-slew/post-slew images
Pre-burst image of 15-350 keV band
Time interval of the image:
-239.264000 -2.244000

# RAcent  DECcent POSerr Theta    Phi  PeakCts   SNR AngSep     Name
#  [deg]    [deg]    ['] [deg]  [deg]                   [']
 83.6348  22.0155    0.2  24.7   30.7  10.2714  52.3    0.1	Crab
102.7582  -2.6695    2.5  37.5   88.1   2.8080   4.7 ------	UNKNOWN
 73.1035 -37.8079    2.9  42.6  159.6   1.6185   4.0 ------	UNKNOWN
 50.9275  -4.8073    3.2  17.5 -133.2   0.6960   3.6 ------	UNKNOWN
 36.9405  14.6149    3.2  30.3  -80.0   1.0632   3.6 ------	UNKNOWN
Pre-slew background subtracted image of 15-350 keV band
Time interval of the image:
-2.244000 19.636600

# RAcent  DECcent POSerr Theta    Phi  PeakCts   SNR AngSep     Name
#  [deg]    [deg]    ['] [deg]  [deg]                   [']
 83.4940  22.0760   18.6  24.7   30.4   0.0441   0.6    8.6	Crab
 77.3361 -43.7175    2.8  49.1  157.1   0.7460   4.1 ------	UNKNOWN
 68.0650 -24.2295    2.7  28.6  163.8   0.2933   4.4 ------	UNKNOWN
 80.4910  47.5235    0.2  45.0    2.0   6.7532  54.9 ------	UNKNOWN
 47.1013  -4.0183    3.0  20.5 -125.6   0.2376   3.9 ------	UNKNOWN
 29.9935  41.7746    2.4  49.3  -47.1   1.2625   4.7 ------	UNKNOWN
 26.9084  23.3529    2.5  42.1  -71.3   1.0182   4.6 ------	UNKNOWN
Post-slew image of 15-350 keV band
Time interval of the image:
88.036600 962.798700

# RAcent  DECcent POSerr Theta    Phi  PeakCts   SNR AngSep     Name
#  [deg]    [deg]    ['] [deg]  [deg]                   [']
 83.6392  22.0147    0.2  25.7 -176.2  37.4976  75.1    0.3	Crab
106.2348  84.2408    3.8  37.3   14.8   1.9820   3.1 ------	UNKNOWN
 87.1454  16.6541    3.0  31.4  178.2   2.1822   3.9 ------	UNKNOWN
 37.7596  69.6090    2.6  30.2  -17.4   2.3205   4.4 ------	UNKNOWN
 19.6122  63.7342    0.7  36.2  -30.2  11.5851  17.5 ------	UNKNOWN
 50.5151  33.8851    3.1  26.2  -99.8   2.4080   3.8 ------	UNKNOWN
Plot creation:
Sun May 31 07:56:54 EDT 2015