Click here for the BAT GCN circular template
Image
Pre-slew 15-350 keV image (Event data; bkg subtracted)

#   RAcent  DECcent POSerr  Theta    Phi     Peak Cts     SNR  Name
  264.8735 -30.3004 0.0393   11.7 -157.3       1.2382     4.8  TRIG_00308797
------------------------------------------

Foreground time interval of the image:
  0.000 178.230 (delta_t = 178.230 [sec])
179.000 320.000 (delta_t = 141.000 [sec])
Background time interval of the image:
Lightcurves
Notes:
- 1) All plots contain as much data as has been downloaded to date.
- 2) Multiple plots of different time binning/intervals are shown to cover all scenarios of short/long GRBs, rate/image triggers, and real/false positives.
- 3) For all the mask-weighted lightcurves, the y-axis units are counts/sec/det where a det is 0.4 x 0.4 = 0.16 sq cm.
- 4) The verticle lines correspond to following: green dotted lines are T50 interval, black dotted lines are T90 interval, blue solid line(s) is a spacecraft slew start time, and orange solid line(s) is a spacecraft slew end time.
- 5) Time of each bin is in the middle of the bin.
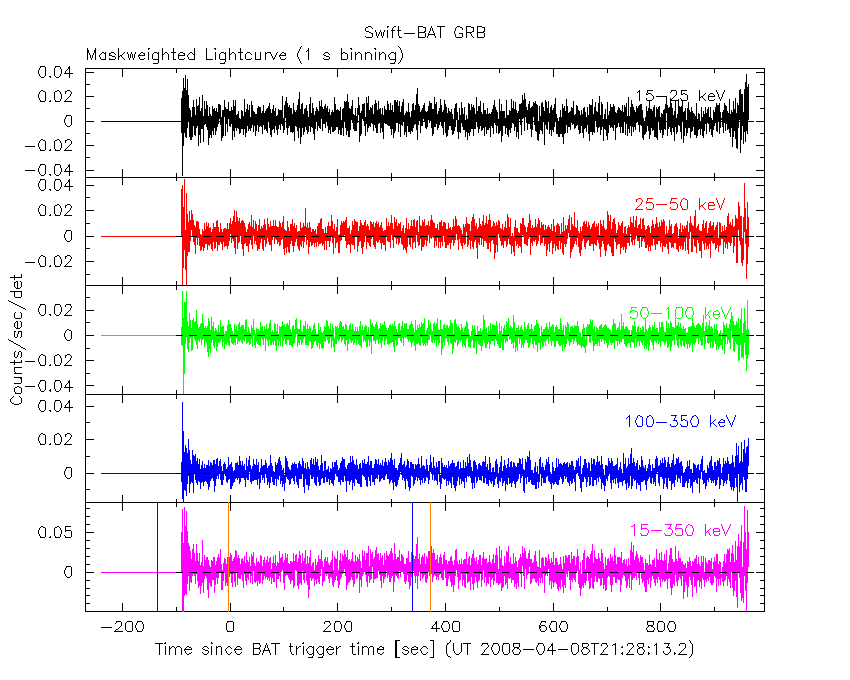
1 s binning
From T0-310 s to T0+310 s

From T100_start - 20 s to T100_end + 30 s

Full time interval
64 ms binning
Full time interval

From T100_start to T100_end
From T0-5 sec to T0+5 sec

16 ms binning
From T100_start-5 s to T100_start+5 s

Blue+Cyan dotted lines: Time interval of the scaled map
From 0.000000 to 320.000000
8 ms binning
From T100_start-3 s to T100_start+3 s

Blue+Cyan dotted lines: Time interval of the scaled map
From 0.000000 to 320.000000
2 ms binning
From T100_start-1 s to T100_start+1 s
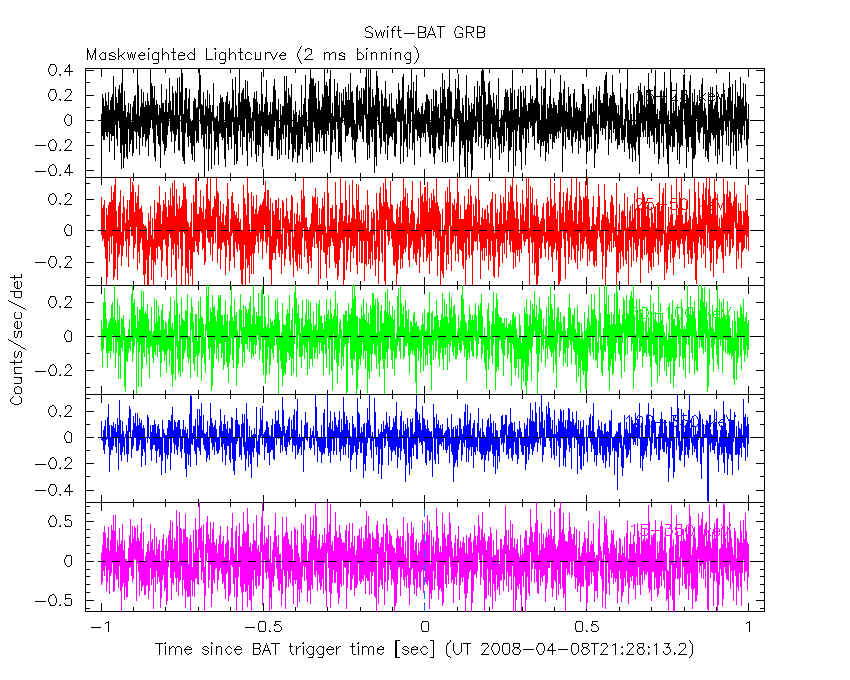
Blue+Cyan dotted lines: Time interval of the scaled map
From 0.000000 to 320.000000
SN=5 or 10 sec. binning (whichever binning is satisfied first)

SN=5 or 10 sec. binning (T < 200 sec)

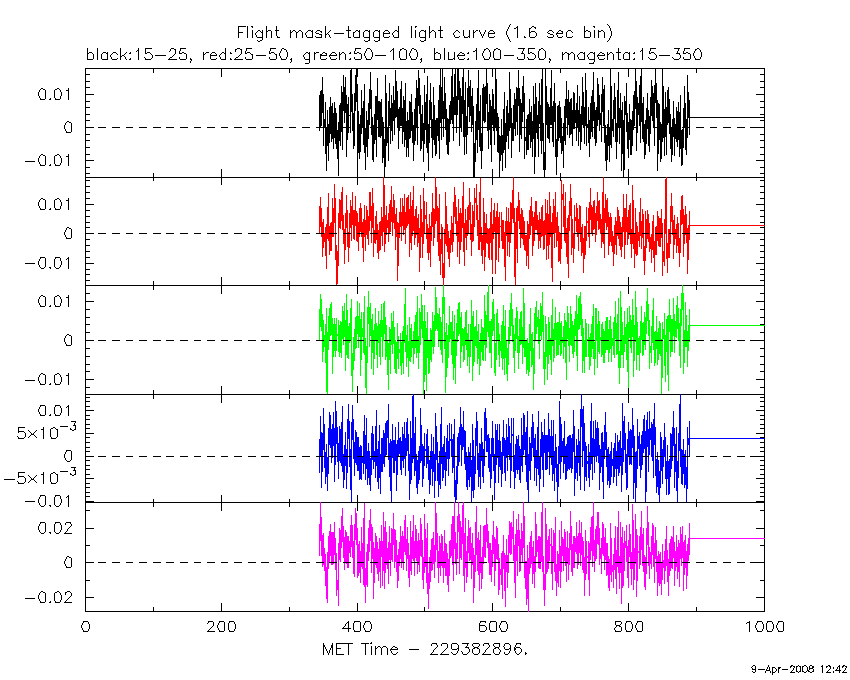
Flight mask-tagged light curves
Caution: Mask-weight map is always using the same on-axis map


Quad-rate summed light curves (from T0-300 to T0+1000)

Spectra
Notes:
- 1) The fitting includes the systematic errors.
- 2) For long bursts, a spectral fit of the pre-slew DRM will introduce some errors in both a spectral shape and a normalization if the PHA file contains a lot of the slew/post-slew time interval.
- 3) For fits to more complicated models (e.g. a power-law over a cutoff power-law), the BAT team has decided to require a chi-square improvement of more than 6 for each extra dof.
- 4) For short bursts (T90<1sec), the specrtum is also fit with Blackbody, OTTB, and Double Blackbody.
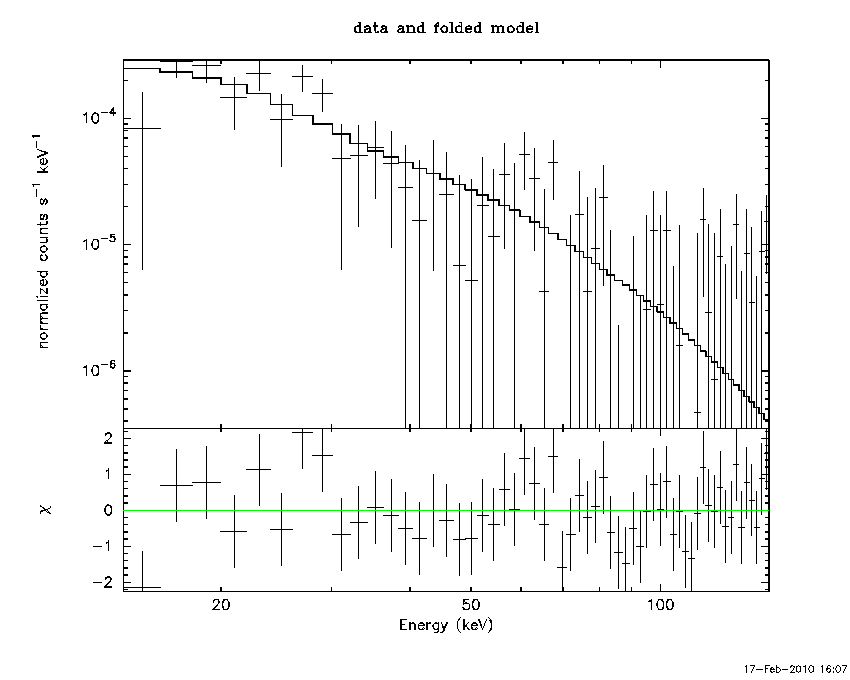
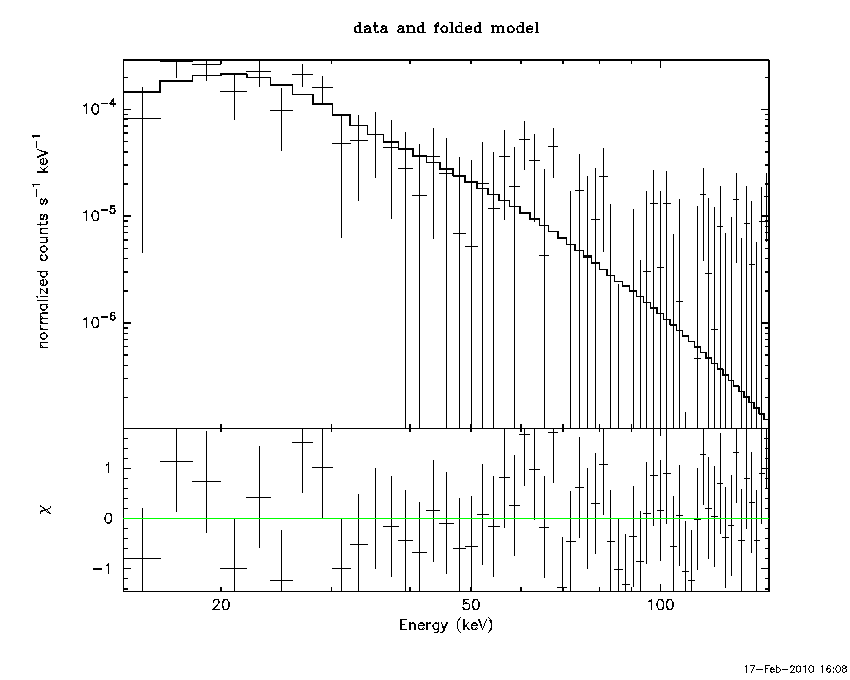
Time averaged spectrum fit using the pre-slew DRM
Power-law model

Multiple GTIs in the spectrum
tstart tstop
0.000000 178.230000
179.000000 320.000000

Spectral model in power-law:
------------------------------------------------------------
Parameters  : value       lower 90%   higher 90%
Photon index: 2.44248     ( -0.373859   0.420978 )
Norm@50keV  : 1.81625E-04    ( -5.4975e-05   5.5303e-05 )
------------------------------------------------------------
# Chi-Squared =          44.08 using 59 PHA bins.
# Reduced chi-squared =         0.7733 for     57 degrees of freedom
# Null hypothesis probability =   8.948132e-01

Photon flux (15-150 keV)    in 319.2 sec: 3.44611E-02 ( -0.00654063  0.00654141 ) ph/cm2/s
Energy fluence (15-150 keV)             : 5.71244e-07 ( -1.31612e-07  1.39957e-07 ) ergs/cm2
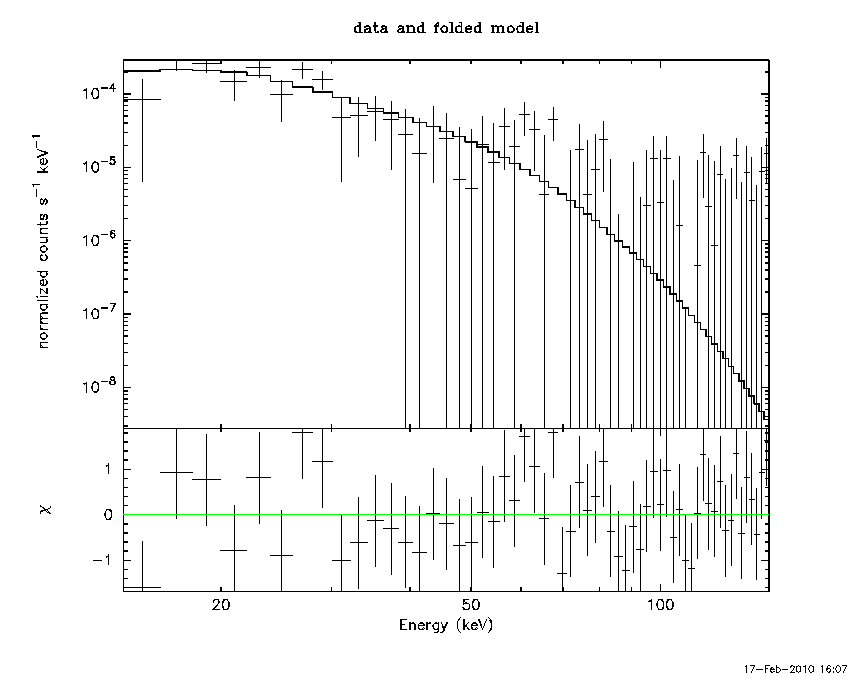
Cutoff power-law model

Multiple GTIs in the spectrum
tstart tstop
0.000000 178.230000
179.000000 320.000000
Spectral model in the cutoff power-law:
------------------------------------------------------------
Parameters  : value       lower 90%   higher 90%
Photon index: -0.590152     (     )
Epeak [keV] : 25.0136      (   )
Norm@50keV  : 2.45300E-02    (     )
------------------------------------------------------------
# Chi-Squared =          42.04 using 59 PHA bins.
# Reduced chi-squared =         0.7507 for     56 degrees of freedom
# Null hypothesis probability =   9.167397e-01

Photon flux (15-150 keV)    in 319.2 sec: 3.308998E-02 ( 0.00660459  -0.03309 ) ph/cm2/s
Energy fluence (15-150 keV)             : 4.6893e-07 ( 1.72049e-07  -4.6893e-07 ) ergs/cm2
Band function

Multiple GTIs in the spectrum
tstart tstop
0.000000 178.230000
179.000000 320.000000

Spectral model in the Band function:
------------------------------------------------------------
Parameters  : value       lower 90%   higher 90%
alpha       : 4.97056   ( -76.8729   -66.8732 )
beta        : -3.31473    ( -2.50229   0.763369 )
Epeak [keV] : 24.0579      ( -6.43278 3.62536 )
Norm@50keV   : 59.5708    ( -37.8112   47.4791 )
------------------------------------------------------------
# Chi-Squared =          39.35 using 59 PHA bins.
# Reduced chi-squared =         0.7155 for     55 degrees of freedom
# Null hypothesis probability =   9.449593e-01

Photon flux (15-150 keV)    in 319.2 sec: 3.433717E-02 ( -0.00640991  0.0065359 ) ph/cm2/s
Energy fluence (15-150 keV)             : 4.97891e-07 ( -1.20364e-07  9.4879e-08 ) ergs/cm2
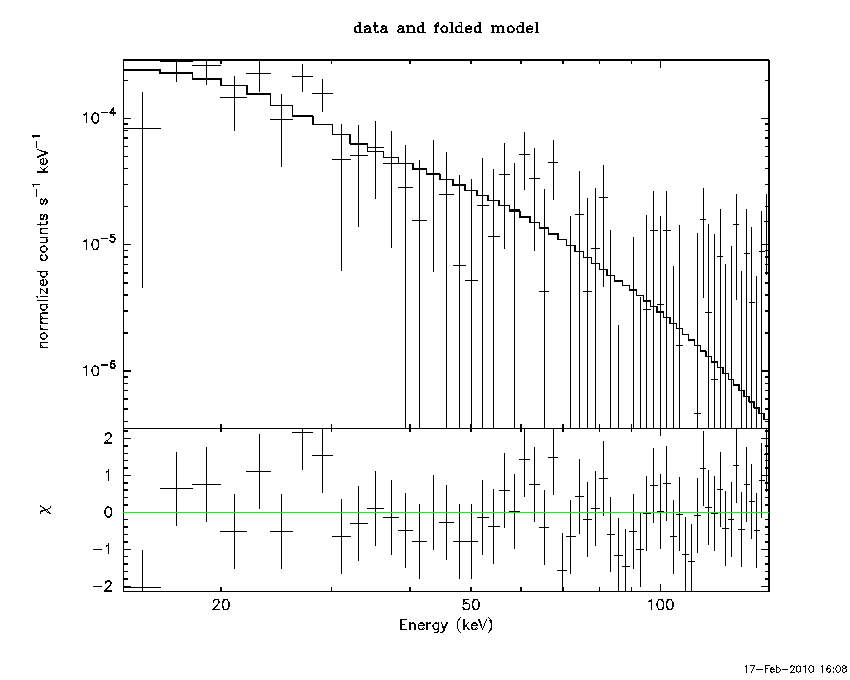
Peak spectrum fit
Power-law model
Time interval is from  179.000 sec. to  320.000 sec.

Spectral model in power-law:
------------------------------------------------------------
Parameters  : value       lower 90%   higher 90%
Photon index: 2.45345     ( -0.359723   0.408841 )
Norm@50keV  : 1.82930E-04    ( -5.47184e-05   5.51858e-05 )
------------------------------------------------------------
# Chi-Squared =          45.08 using 59 PHA bins.
# Reduced chi-squared =         0.7908 for     57 degrees of freedom
# Null hypothesis probability =   8.733260e-01

Photon flux (15-150 keV)    in 319.2 sec: 3.49339E-02 ( -0.00631204  0.00631548 ) ph/cm2/s
Energy fluence (15-150 keV)             : 5.76865e-07 ( -1.30074e-07  1.38821e-07 ) ergs/cm2
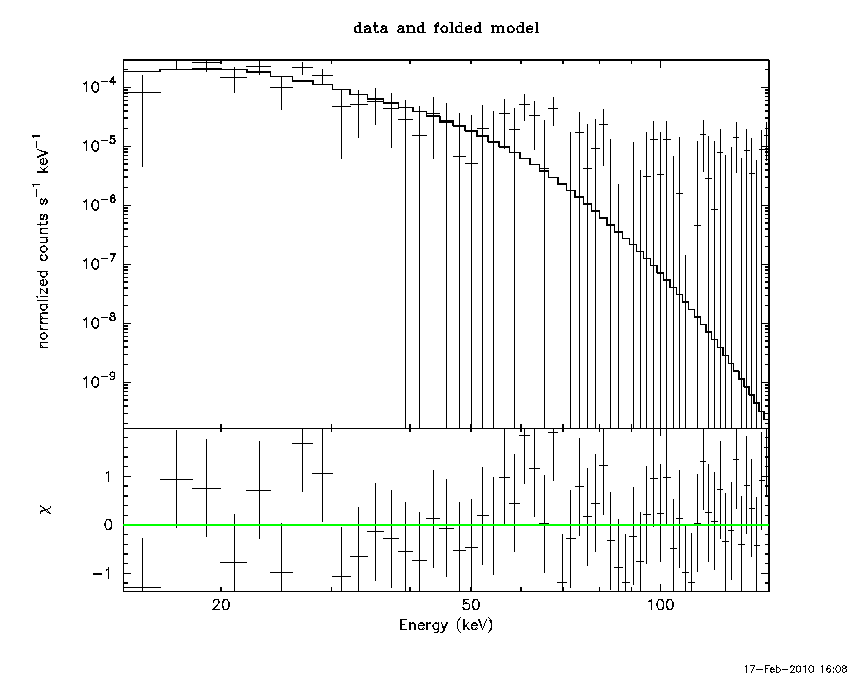
Cutoff power-law model
Time interval is from  179.000 sec. to  320.000 sec.
Spectral model in the cutoff power-law:
------------------------------------------------------------
Parameters  : value       lower 90%   higher 90%
Photon index: 0.450971     ( -0.450679   1.85641 )
Epeak [keV] : 23.4221      (   )
Norm@50keV  : 4.49666E-03    (     )
------------------------------------------------------------
# Chi-Squared =          42.84 using 59 PHA bins.
# Reduced chi-squared =         0.7651 for     56 degrees of freedom
# Null hypothesis probability =   9.018543e-01

Photon flux (15-150 keV)    in 319.2 sec: 3.36193E-02 ( -0.0063607  0.0063648 ) ph/cm2/s
Energy fluence (15-150 keV)             : 4.73179e-07 ( -1.24928e-07  1.70973e-07 ) ergs/cm2
Band function

Time interval is from  179.000 sec. to  320.000 sec.

Spectral model in the Band function:
------------------------------------------------------------
Parameters  : value       lower 90%   higher 90%
alpha       : 4.81633   ( -22.3538   -12.366 )
beta        : -3.16508    ( -2.37173   0.770332 )
Epeak [keV] : 22.6044      ( -5.18184 4.58394 )
Norm@50keV   : 70.0561    ( -70.0561   17.6391 )
------------------------------------------------------------
# Chi-Squared =          40.32 using 59 PHA bins.
# Reduced chi-squared =         0.7332 for     55 degrees of freedom
# Null hypothesis probability =   9.308938e-01

Photon flux (15-150 keV)    in 319.2 sec: 3.433717E-02 ( -0.00640991  0.0065359 ) ph/cm2/s
Energy fluence (15-150 keV)             : 4.97891e-07 ( -1.20364e-07  9.4879e-08 ) ergs/cm2
Pre-slew spectrum (Pre-slew PHA with pre-slew DRM)
Power-law model
Spectral model in power-law:
------------------------------------------------------------
Parameters  : value       lower 90%   higher 90%
Photon index: 2.44248     ( -0.373859   0.420978 )
Norm@50keV  : 1.81625E-04    ( -5.4975e-05   5.5303e-05 )
------------------------------------------------------------
# Chi-Squared =          44.08 using 59 PHA bins.
# Reduced chi-squared =         0.7733 for     57 degrees of freedom
# Null hypothesis probability =   8.948132e-01

Photon flux (15-150 keV)    in 319.2 sec: 3.44611E-02 ( -0.00654063  0.00654141 ) ph/cm2/s
Energy fluence (15-150 keV)             : 5.71244e-07 ( -1.31612e-07  1.39957e-07 ) ergs/cm2
Cutoff power-law model
Spectral model in the cutoff power-law:
------------------------------------------------------------
Parameters  : value       lower 90%   higher 90%
Photon index: -0.590152     (     )
Epeak [keV] : 25.0136      (   )
Norm@50keV  : 2.45300E-02    (     )
------------------------------------------------------------
# Chi-Squared =          42.04 using 59 PHA bins.
# Reduced chi-squared =         0.7507 for     56 degrees of freedom
# Null hypothesis probability =   9.167397e-01

Photon flux (15-150 keV)    in 319.2 sec: 3.308998E-02 ( 0.00660459  -0.03309 ) ph/cm2/s
Energy fluence (15-150 keV)             : 4.6893e-07 ( 1.72049e-07  -4.6893e-07 ) ergs/cm2
Band function
Spectral model in the Band function:
------------------------------------------------------------
Parameters  : value       lower 90%   higher 90%
alpha       : 4.97056   ( -76.873   -66.8732 )
beta        : -3.31473    ( -2.50229   0.763369 )
Epeak [keV] : 24.0579      ( -6.46974 3.632 )
Norm@50keV   : 59.5708    ( -37.8112   47.4791 )
------------------------------------------------------------
# Chi-Squared =          39.35 using 59 PHA bins.
# Reduced chi-squared =         0.7155 for     55 degrees of freedom
# Null hypothesis probability =   9.449593e-01

Photon flux (15-150 keV)    in 319.2 sec: 3.433717E-02 ( -0.00640991  0.0065359 ) ph/cm2/s
Energy fluence (15-150 keV)             : 4.97891e-07 ( -1.20364e-07  9.4879e-08 ) ergs/cm2
S(25-50 keV) vs. S(50-100 keV) plot

S(25-50 keV)  = 1.88358e-07
S(50-100 keV) = 1.38605e-07
T90 vs. Hardness ratio plot
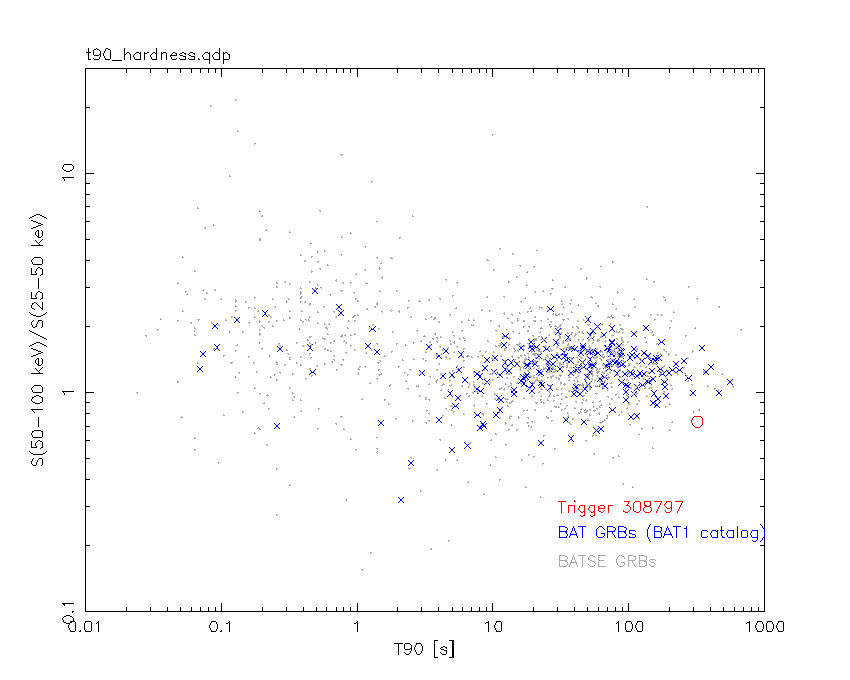
T90                                   = 320 sec.
Hardness ratio (energy fluence ratio) = 0.735859
Color vs. Color plot
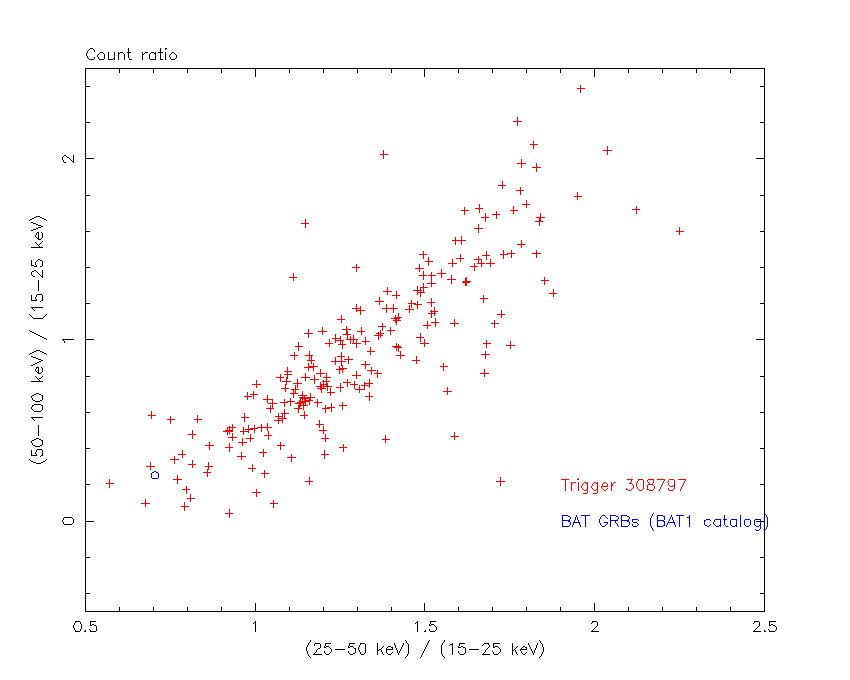
Count Ratio  (25-50 keV) / (15-25 keV) = 0.704701
Count Ratio (50-100 keV) / (15-25 keV) = 0.252749
Mask shadow pattern

IMX = 0, IMY = 0
TIME vs. PHA plot around the trigger time

Blue+Cyan dotted lines: Time interval of the scaled map
From 0.000000 to 320.000000
TIME vs. DetID plot around the trigger time
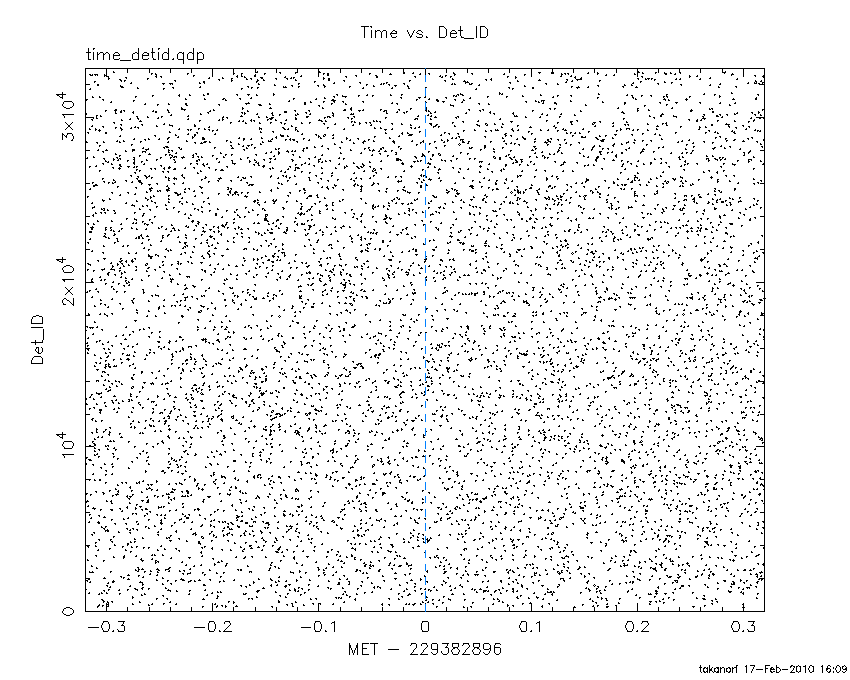
Blue+Cyan dotted lines: Time interval of the scaled map
From 0.000000 to 320.000000
100 us light curve (15-350 keV)

Blue+Cyan dotted lines: Time interval of the scaled map
From 0.000000 to 320.000000
Spacecraft aspect plot

Bright source in the pre-burst/pre-slew/post-slew images
Pre-burst image of 15-350 keV band
Time interval of the image:
Pre-slew background subtracted image of 15-350 keV band
Time interval of the image:
0.000000 178.230000
179.000000 320.000000

# RAcent  DECcent POSerr Theta    Phi  PeakCts   SNR AngSep     Name
#  [deg]    [deg]    ['] [deg]  [deg]                   [']
186.6472 -62.7530    1.6  46.4   24.4   4.1453   7.3    1.1	GX 301-2
244.9795 -15.6530    0.3  26.7  140.9   9.9768  33.9    0.8	Sco X-1
256.0027 -37.8486    3.1   2.5  146.0   0.8052   3.7    0.8	4U 1700-377
256.5398 -36.4067    2.3   3.8  160.1   1.0670   4.9    5.1	GX 349+2
263.1809 -24.6191    6.0  16.3 -172.4   0.4414   1.9   12.1	GX 1+4
264.6500 -44.3898    3.4   7.0  -62.3   0.7124   3.3    5.4	4U 1735-44
268.4205  -1.4872    3.7  40.0 -174.5   1.0663   3.2    3.8	SW J1753.5-0127
270.2223 -25.1027    2.6  18.6 -152.3   1.0229   4.4    3.6	GX 5-1
270.3008 -25.6916    4.5  18.1 -151.1   0.6203   2.7    3.1	GRS 1758-258
274.0250 -13.9999    4.1  30.0 -158.0   0.7393   2.8    2.5	GX 17+2
275.9106 -30.2752    2.6  18.2 -129.3   1.0857   4.4    5.6	H1820-303
285.0321 -24.9201   48.1  27.8 -126.9   0.0718   0.2    0.2	HT1900.1-2455
288.7625  10.9109   45.3  58.9 -155.2   0.4857   0.3    3.0	GRS 1915+105
244.1406   0.6370    2.4  42.5  148.3   2.3586   4.8 ------	UNKNOWN
266.8159 -27.3385    1.2  15.1 -157.3   2.3642   9.6 ------	UNKNOWN
267.1851 -26.6523    1.7  15.9 -157.5   1.6958   7.0 ------	UNKNOWN
261.7324 -74.2305    2.3  34.1  -14.4   1.2585   4.9 ------	UNKNOWN
277.3510 -23.7967    2.2  23.6 -140.0   1.2076   5.3 ------	UNKNOWN
 61.0413 -83.4128    3.3  56.2  -14.4   3.2454   3.5 ------	UNKNOWN
Post-slew image of 15-350 keV band
Time interval of the image:
372.900590 885.900600

# RAcent  DECcent POSerr Theta    Phi  PeakCts   SNR AngSep     Name
#  [deg]    [deg]    ['] [deg]  [deg]                   [']
244.9865 -15.6373    0.3  23.4  119.6  15.9535  41.6    0.4	Sco X-1
255.9722 -37.8475    1.2  10.5   37.1   2.9908   9.4    0.7	4U 1700-377
256.4454 -36.3613    2.9   9.2   42.3   1.2208   4.1    3.7	GX 349+2
262.9725 -24.5916    9.2   6.0  158.6   0.3771   1.2    9.4	GX 1+4
264.5394 -44.4409    6.3  14.1   -4.1   0.5739   1.8    8.7	4U 1735-44
268.3746  -1.4870    3.9  29.1 -177.7   0.9772   3.0    2.1	SW J1753.5-0127
270.2718 -25.1164    2.5   7.1 -141.3   1.5292   4.9    2.3	GX 5-1
270.3832 -25.6503   22.7   6.8 -137.7   0.1990   0.6    7.1	GRS 1758-258
273.9931 -14.0233    2.2  18.4 -155.7   1.6282   5.3    1.1	GX 17+2
275.9571 -30.4113    2.1   9.6  -92.0   1.8146   5.5    3.1	H1820-303
284.8837 -25.0498    5.8  18.5 -106.8   0.6609   2.0   11.3	HT1900.1-2455
288.7023  10.8175    0.0  47.2 -152.2  -0.9755  -1.3    9.5	GRS 1915+105
249.1637 -15.5295    2.2  20.7  127.5   1.8750   5.2 ------	UNKNOWN
244.3831 -70.3491    2.7  41.6    5.2   2.1131   4.3 ------	UNKNOWN
259.8006 -29.7768    2.5   4.4   91.6   1.3385   4.6 ------	UNKNOWN
268.4860  25.1309    2.9  55.6  179.0   5.3852   4.0 ------	UNKNOWN
266.8577 -27.3406    1.8   3.5 -154.3   2.1896   6.5 ------	UNKNOWN
267.3230 -26.6115    2.0   4.4 -154.3   1.9694   5.9 ------	UNKNOWN
Plot creation:
Wed Feb 17 16:10:02 EST 2010