Click here for the BAT GCN circular template
Image
Pre-slew 15.0-350.0 keV image (Event data)
#   RAcent    DECcent   POSerr    Theta     Phi              Peak Cts       SNR   Name
   84.3027     5.0770   0.0130    39.9299  -146.2523         1.1534768     14.650 TRIG_00308812

Foreground time interval of the image:
-13.100  10.412 (delta_t =  23.512 [sec])
Background time interval of the image:
-239.288 -13.100 (delta_t = 226.188 [sec])
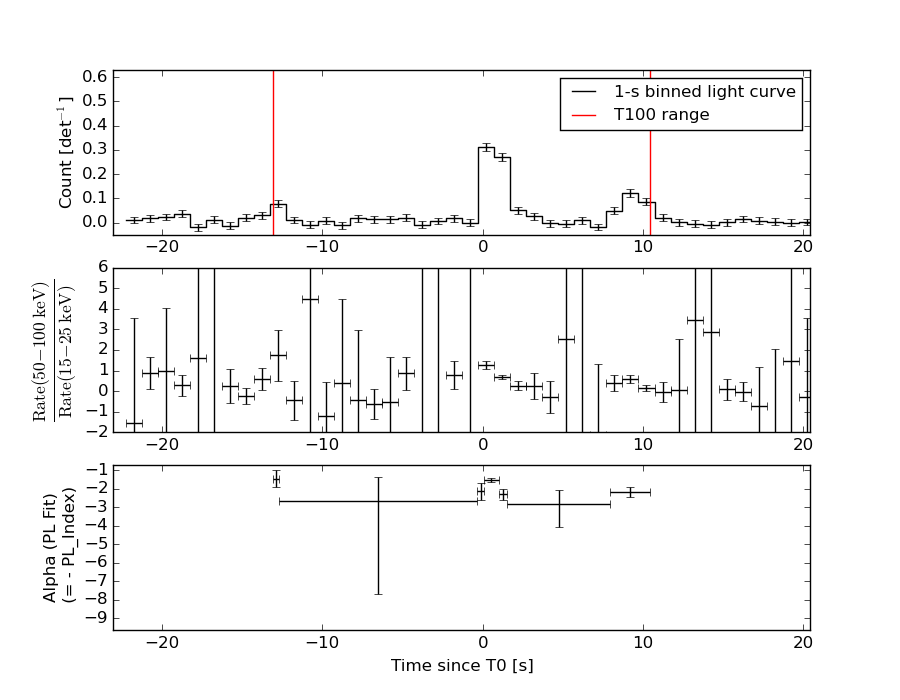
Lightcurves
Notes:
- 1) The mask-weighted light curves are using the flight position.
- 2) Multiple plots of different time binning/intervals are shown to cover all scenarios of short/long GRBs, rate/image triggers, and real/false positives.
- 3) For all the mask-weighted lightcurves, the y-axis units are counts/sec/det where a det is 0.4 x 0.4 = 0.16 sq cm.
- 4) The verticle lines correspond to following: green dotted lines are T50 interval, black dotted lines are T90 interval, blue solid line(s) is a spacecraft slew start time, and orange solid line(s) is a spacecraft slew end time.
- 5) Time of each bin is in the middle of the bin.
1 s binning
From T0-310 s to T0+310 s
From T100_start - 20 s to T100_end + 30 s

Full time interval

64 ms binning
Full time interval

From T100_start to T100_end

From T0-5 sec to T0+5 sec
16 ms binning
From T100_start-5 s to T100_start+5 s

Blue+Cyan dotted lines: Time interval of the scaled map
From 0.000000 to 0.512000
8 ms binning
From T100_start-3 s to T100_start+3 s

Blue+Cyan dotted lines: Time interval of the scaled map
From 0.000000 to 0.512000
2 ms binning
From T100_start-1 s to T100_start+1 s

Blue+Cyan dotted lines: Time interval of the scaled map
From 0.000000 to 0.512000
SN=5 or 10 sec. binning (whichever binning is satisfied first)
SN=5 or 10 sec. binning (T < 200 sec)

Quad-rate summed light curves (from T0-300s to T0+1000s)

Spectral Evolution
Spectra
Notes:
- 1) The fitting includes the systematic errors.
- 2) When the burst includes telescope slew time periods, the fitting uses an average response file made from multiple 5-s response files through out the slew time plus single time preiod for the non-slew times, and weighted by the total counts in the corresponding time period using addrmf. An average response file is needed becuase a spectral fit using the pre-slew DRM will introduce some errors in both a spectral shape and a normalization if the PHA file contains a lot of the slew/post-slew time interval.
- 3) For fits to more complicated models (e.g. a power-law over a cutoff power-law), the BAT team has decided to require a chi-square improvement of more than 6 for each extra dof.
Time averaged spectrum fit using the average DRM
Power-law model

Time interval is from  -13.100 sec. to   10.412 sec.

Spectral model in power-law:
------------------------------------------------------------
Parameters  : value       lower 90%   higher 90%
Photon index: 2.03736     ( -0.179952   0.190457 )
Norm@50keV  : 2.86912E-03    ( -0.00037006   0.000363061 )
------------------------------------------------------------
#Fit statistic : Chi-Squared =          60.12 using 59 PHA bins.
# Reduced chi-squared =          1.055 for     57 degrees of freedom
# Null hypothesis probability =   3.634997e-01

Photon flux (15-150 keV)    in 23.51 sec: 0.437930 ( -0.0451306  0.0451495 ) ph/cm2/s
Energy fluence (15-150 keV)             : 6.23471e-07 ( -7.44583e-08  7.57351e-08 ) ergs/cm2
Cutoff power-law model

Time interval is from  -13.100 sec. to   10.412 sec.
Spectral model in the cutoff power-law:
------------------------------------------------------------
Parameters  : value       lower 90%   higher 90%
Photon index: 0.691085     ( -1.11993   0.89967 )
Epeak [keV] : 40.3347      ( -9.08852 9.5967 )
Norm@50keV  : 1.71537E-02    ( -0.0171537   0.0597595 )
------------------------------------------------------------
#Fit statistic : Chi-Squared =          53.01 using 59 PHA bins.
# Reduced chi-squared =         0.9466 for     56 degrees of freedom
# Null hypothesis probability =   5.886812e-01

Photon flux (15-150 keV)    in 23.51 sec: 0.419399 ( -0.046426  0.046613 ) ph/cm2/s
Energy fluence (15-150 keV)             : 5.616e-07 ( -7.5848e-08  8.19512e-08 ) ergs/cm2
Band function

Time interval is from  -13.100 sec. to   10.412 sec.

Spectral model in the Band function:
------------------------------------------------------------
Parameters  : value       lower 90%   higher 90%
alpha       : -0.703559   ( -1.13744   1.94877 )
beta        : -4.27933    ( 3.92185   1.6797 )
Epeak [keV] : 40.5201      ( -9.42302 9.34202 )
Norm@50keV   : 1.67914E-02    ( -0.0167904   0.333663 )
------------------------------------------------------------
#Fit statistic : Chi-Squared =          52.99 using 59 PHA bins.
# Reduced chi-squared =         0.9634 for     55 degrees of freedom
# Null hypothesis probability =   5.518559e-01

Photon flux (15-150 keV)    in 23.51 sec:  (    ) ph/cm2/s
Energy fluence (15-150 keV)             : 0 ( 0  0 ) ergs/cm2
Single BB

Spectral model blackbody:
------------------------------------------------------------
Parameters  : value    Lower 90%  Upper 90%
kT [keV]    : 10.1464  (-1.06  1.18327)
R^2/D10^2   : 0.198081  (-0.0690354   0.105306)
(R is the radius in km and D10 is the distance to the source in units of 10 kpc)
------------------------------------------------------------
#Fit statistic : Chi-Squared =          61.92 using 59 PHA bins.
# Reduced chi-squared =          1.086 for     57 degrees of freedom
# Null hypothesis probability =   3.049767e-01

Energy  Fluence     90% Error
[keV]   [erg/cm2]   [erg/cm2]
15- 25  9.811e-08   1.640e-08
25- 50  2.490e-07   3.090e-08
50-150  1.355e-07   3.702e-08
15-150  4.826e-07   6.183e-08
Thermal bremsstrahlung (OTTB)

Spectral model: thermal bremsstrahlung
------------------------------------------------------------
Parameters  : value         Lower 90%    Upper 90%
kT [keV]    : 61.1396       (-15.17      23.0096)
Norm        : 2.29833       (-0.361581     0.415535)
------------------------------------------------------------
#Fit statistic : Chi-Squared =          54.25 using 59 PHA bins.
# Reduced chi-squared =         0.9517 for     57 degrees of freedom
# Null hypothesis probability =   5.789590e-01

Energy  Fluence     90% Error
[keV]   [erg/cm2]   [erg/cm2]
15- 25  1.362e-07   1.895e-08
25- 50  2.085e-07   2.285e-08
50-150  2.410e-07   6.438e-08
15-150  5.857e-07   8.946e-08
Double BB

Spectral model: bbodyrad<1> + bbodyrad<2>
------------------------------------------------------------
Parameters  : value         Lower 90%    Upper 90%
kT1 [keV]   : 4.26865        (-2.26289      4.2813)
R1^2/D10^2  : 2.52886        (-2.15621      138.61)
kT2 [keV]   : 12.7941        (-2.45176      13.4208)
R2^2/D10^2  : 6.74380E-02    (-0.0641293   0.0854898)
------------------------------------------------------------
#Fit statistic : Chi-Squared =          53.43 using 59 PHA bins.
# Reduced chi-squared =         0.9715 for     55 degrees of freedom
# Null hypothesis probability =   5.347808e-01

Energy  Fluence     90% Error
[keV]   [erg/cm2]   [erg/cm2]
15- 25  1.285e-07   6.670e-08
25- 50  2.181e-07   9.182e-08
50-150  1.916e-07   1.109e-07
15-150  5.382e-07   2.312e-07
Peak spectrum fit
Power-law model

Time interval is from    0.000 sec. to    1.000 sec.

Spectral model in power-law:
------------------------------------------------------------
Parameters  : value       lower 90%   higher 90%
Photon index: 1.52335     ( -0.111949   0.112419 )
Norm@50keV  : 2.94100E-02    ( -0.00210621   0.00210298 )
------------------------------------------------------------
#Fit statistic : Chi-Squared =          75.61 using 59 PHA bins.
# Reduced chi-squared =          1.326 for     57 degrees of freedom
# Null hypothesis probability =   5.012357e-02

Photon flux (15-150 keV)    in 1 sec: 3.69507 ( -0.270404  0.270814 ) ph/cm2/s
Energy fluence (15-150 keV)             : 2.77964e-07 ( -2.11612e-08  2.12358e-08 ) ergs/cm2
Cutoff power-law model

Time interval is from    0.000 sec. to    1.000 sec.
Spectral model in the cutoff power-law:
------------------------------------------------------------
Parameters  : value       lower 90%   higher 90%
Photon index: 0.547762     ( -0.55034   0.492171 )
Epeak [keV] : 75.1859      ( -11.9185 27.1816 )
Norm@50keV  : 9.13343E-02    ( -0.0390099   0.0787052 )
------------------------------------------------------------
#Fit statistic : Chi-Squared =          63.03 using 59 PHA bins.
# Reduced chi-squared =          1.126 for     56 degrees of freedom
# Null hypothesis probability =   2.416626e-01

Photon flux (15-150 keV)    in 1 sec: 3.58843 ( -0.27569  0.27603 ) ph/cm2/s
Energy fluence (15-150 keV)             : 2.64846e-07 ( -2.235e-08  2.2441e-08 ) ergs/cm2
Band function

Time interval is from    0.000 sec. to    1.000 sec.

Spectral model in the Band function:
------------------------------------------------------------
Parameters  : value       lower 90%   higher 90%
alpha       : -0.549082   ( -0.468051   0.37766 )
beta        : -9.37167    ( 9.37167   19.3717 )
Epeak [keV] : 75.2306      ( -9.91978 26.4404 )
Norm@50keV   : 9.11727E-02    ( -0.0377328   0.0179509 )
------------------------------------------------------------
#Fit statistic : Chi-Squared =          63.03 using 59 PHA bins.
# Reduced chi-squared =          1.146 for     55 degrees of freedom
# Null hypothesis probability =   2.135041e-01

Photon flux (15-150 keV)    in 1 sec: 3.58728 (    ) ph/cm2/s
Energy fluence (15-150 keV)             : 2.64363e-07 ( 0  0 ) ergs/cm2
Single BB

Spectral model blackbody:
------------------------------------------------------------
Parameters  : value    Lower 90%  Upper 90%
kT [keV]    : 15.1392  (-1.19839  1.30733)
R^2/D10^2   : 0.423145  (-0.109553   0.14595)
(R is the radius in km and D10 is the distance to the source in units of 10 kpc)
------------------------------------------------------------
#Fit statistic : Chi-Squared =          90.71 using 59 PHA bins.
# Reduced chi-squared =          1.591 for     57 degrees of freedom
# Null hypothesis probability =   2.998358e-03

Energy  Fluence     90% Error
[keV]   [erg/cm2]   [erg/cm2]
15- 25  2.027e-08   2.530e-09
25- 50  8.124e-08   7.160e-09
50-150  1.272e-07   1.660e-08
15-150  2.288e-07   1.945e-08
Thermal bremsstrahlung (OTTB)

Spectral model: thermal bremsstrahlung
------------------------------------------------------------
Parameters  : value         Lower 90%    Upper 90%
kT [keV]    : 199.363       (-53.959      -199.363)
Norm        : 15.2827       (-1.07233     1.07364)
------------------------------------------------------------
#Fit statistic : Chi-Squared =          68.87 using 59 PHA bins.
# Reduced chi-squared =          1.208 for     57 degrees of freedom
# Null hypothesis probability =   1.346844e-01

Energy  Fluence     90% Error
[keV]   [erg/cm2]   [erg/cm2]
15- 25  3.805e-08   2.850e-09
25- 50  7.320e-08   6.650e-09
50-150  1.605e-07   4.528e-08
15-150  2.718e-07   4.495e-08
Double BB

Spectral model: bbodyrad<1> + bbodyrad<2>
------------------------------------------------------------
Parameters  : value         Lower 90%    Upper 90%
kT1 [keV]   : 7.61583        (-1.59612      1.96898)
R1^2/D10^2  : 2.60535        (-1.26868      2.83365)
kT2 [keV]   : 23.2301        (-3.93857      7.3565)
R2^2/D10^2  : 6.82771E-02    (-0.0454566   0.0776768)
------------------------------------------------------------
#Fit statistic : Chi-Squared =          59.67 using 59 PHA bins.
# Reduced chi-squared =          1.085 for     55 degrees of freedom
# Null hypothesis probability =   3.099378e-01

Energy  Fluence     90% Error
[keV]   [erg/cm2]   [erg/cm2]
15- 25  3.292e-08   1.151e-08
25- 50  7.840e-08   2.346e-08
50-150  1.555e-07   7.172e-08
15-150  2.668e-07   8.946e-08
Pre-slew spectrum (Pre-slew PHA with pre-slew DRM)
Power-law model

Spectral model in power-law:
------------------------------------------------------------
Parameters  : value       lower 90%   higher 90%
Photon index: 2.03736     ( -0.179952   0.190457 )
Norm@50keV  : 2.86912E-03    ( -0.00037006   0.000363061 )
------------------------------------------------------------
#Fit statistic : Chi-Squared =          60.12 using 59 PHA bins.
# Reduced chi-squared =          1.055 for     57 degrees of freedom
# Null hypothesis probability =   3.634997e-01

Photon flux (15-150 keV)    in 23.51 sec: 0.437930 ( -0.0451306  0.0451495 ) ph/cm2/s
Energy fluence (15-150 keV)             : 6.23471e-07 ( -7.44583e-08  7.57351e-08 ) ergs/cm2
Cutoff power-law model

Spectral model in the cutoff power-law:
------------------------------------------------------------
Parameters  : value       lower 90%   higher 90%
Photon index: 0.691085     ( -1.11993   0.89967 )
Epeak [keV] : 40.3347      ( -9.08852 9.5967 )
Norm@50keV  : 1.71537E-02    ( -0.0171537   0.0597595 )
------------------------------------------------------------
#Fit statistic : Chi-Squared =          53.01 using 59 PHA bins.
# Reduced chi-squared =         0.9466 for     56 degrees of freedom
# Null hypothesis probability =   5.886812e-01

Photon flux (15-150 keV)    in 23.51 sec: 0.419399 ( -0.046426  0.046613 ) ph/cm2/s
Energy fluence (15-150 keV)             : 5.616e-07 ( -7.5848e-08  8.19512e-08 ) ergs/cm2
Band function

Spectral model in the Band function:
------------------------------------------------------------
Parameters  : value       lower 90%   higher 90%
alpha       : -0.703559   ( -1.13744   1.94877 )
beta        : -4.27933    ( 3.92185   1.6797 )
Epeak [keV] : 40.5201      ( -9.42302 9.34202 )
Norm@50keV   : 1.67914E-02    ( -0.0167904   0.333663 )
------------------------------------------------------------
#Fit statistic : Chi-Squared =          52.99 using 59 PHA bins.
# Reduced chi-squared =         0.9634 for     55 degrees of freedom
# Null hypothesis probability =   5.518559e-01

Photon flux (15-150 keV)    in 23.51 sec:  (    ) ph/cm2/s
Energy fluence (15-150 keV)             : 0 ( 0  0 ) ergs/cm2
S(25-50 keV) vs. S(50-100 keV) plot
S(25-50 keV)  = 1.90e-07
S(50-100 keV) = 1.85e-07
T90 vs. Hardness ratio plot
T90                                   = 22.6560000181198 sec.
Hardness ratio (energy fluence ratio) = 0.973684
Color vs. Color plot

Count Ratio  (25-50 keV) / (15-25 keV) = 1.16216
Count Ratio (50-100 keV) / (15-25 keV) = 0.574878
Mask shadow pattern

IMX = -6.959719045074152E-01, IMY = 4.649925097246069E-01
TIME vs. PHA plot around the trigger time

Blue+Cyan dotted lines: Time interval of the scaled map
From 0.000000 to 0.512000
TIME vs. DetID plot around the trigger time

Blue+Cyan dotted lines: Time interval of the scaled map
From 0.000000 to 0.512000
100 us light curve (15-350 keV)

Blue+Cyan dotted lines: Time interval of the scaled map
From 0.000000 to 0.512000
Spacecraft aspect plot

Bright source in the pre-burst/pre-slew/post-slew images
Pre-burst image of 15-350 keV band
Time interval of the image:
-239.288000 -13.100000

# RAcent  DECcent POSerr Theta    Phi  PeakCts   SNR AngSep     Name
#  [deg]    [deg]    ['] [deg]  [deg]                   [']
 83.6232  22.0216    0.3  29.6 -122.3   9.4786  41.6    0.7	Crab
140.2736   5.5685    3.4  36.5  115.8   1.4543   3.4 ------	UNKNOWN
135.6889  28.4668    2.5  18.6   81.5   0.9050   4.5 ------	UNKNOWN
159.2576  58.8950    2.2  39.0   17.3   1.3655   5.2 ------	UNKNOWN
193.9568  70.9371    2.7  55.3    5.1   3.6499   4.3 ------	UNKNOWN
116.2015  17.9791    2.5  15.4  156.6   0.7482   4.7 ------	UNKNOWN
119.6984  44.0498    2.3  11.4    0.6   0.7981   5.0 ------	UNKNOWN
103.4813  18.8620    2.1  17.6 -160.5   0.7878   5.5 ------	UNKNOWN
 94.7205 -14.6681    2.9  51.6 -173.0   1.6316   4.0 ------	UNKNOWN
115.9866  69.4412    2.4  36.1  -17.1   1.0402   4.8 ------	UNKNOWN
Pre-slew background subtracted image of 15-350 keV band
Time interval of the image:
-13.100000 10.412000

# RAcent  DECcent POSerr Theta    Phi  PeakCts   SNR AngSep     Name
#  [deg]    [deg]    ['] [deg]  [deg]                   [']
 83.4769  22.0474    7.7  29.7 -122.2  -0.0984  -1.5    8.9	Crab
124.7276 -11.7761    2.6  46.1  148.3   0.5397   4.4 ------	UNKNOWN
 84.3027   5.0770    0.8  39.9 -146.3   1.1536  14.7 ------	UNKNOWN
Post-slew image of 15-350 keV band
Time interval of the image:
68.012600 962.769100

# RAcent  DECcent POSerr Theta    Phi  PeakCts   SNR AngSep     Name
#  [deg]    [deg]    ['] [deg]  [deg]                   [']
 83.6349  22.0173    0.2  16.9   -8.2  38.4853  74.0    0.2	Crab
 93.2660 -47.4911    3.0  53.2  166.6   9.7513   3.9 ------	UNKNOWN
 97.1681  14.5979    2.2  15.8   46.2   3.0820   5.4 ------	UNKNOWN
 64.6670  -8.2541    2.7  23.7 -130.0   2.7135   4.3 ------	UNKNOWN
 62.1945  29.7833    2.2  32.4  -43.6   3.8434   5.3 ------	UNKNOWN
 44.4833  41.1056    3.9  50.6  -44.6   9.7128   3.0 ------	UNKNOWN
Plot creation:
Sun May 31 07:53:10 EDT 2015