Click here for the BAT GCN circular template
Image
Pre-slew 15.0-350.0 keV image (Event data)
#   RAcent    DECcent   POSerr    Theta     Phi              Peak Cts       SNR   Name
   37.9613   -71.2971   0.0022    29.1533  -162.8732         4.7682824     85.490 TRIG_00309010

Foreground time interval of the image:
 -0.272   9.605 (delta_t =   9.877 [sec])
Background time interval of the image:
-239.296 -177.283 (delta_t =  62.013 [sec])
-119.296  -0.272 (delta_t = 119.024 [sec])
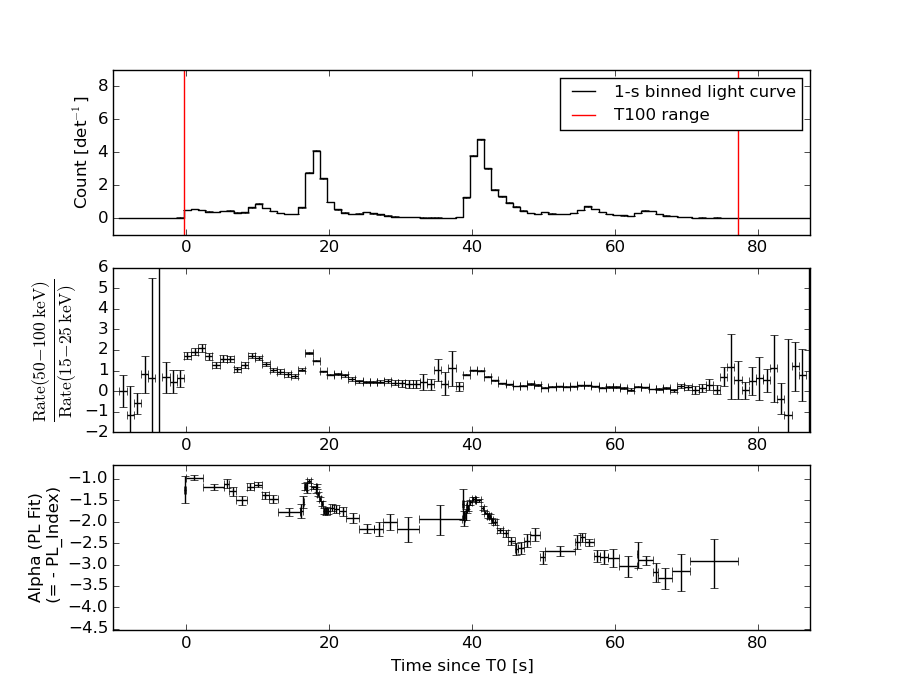
Lightcurves
Notes:
- 1) The mask-weighted light curves are using the flight position.
- 2) Multiple plots of different time binning/intervals are shown to cover all scenarios of short/long GRBs, rate/image triggers, and real/false positives.
- 3) For all the mask-weighted lightcurves, the y-axis units are counts/sec/det where a det is 0.4 x 0.4 = 0.16 sq cm.
- 4) The verticle lines correspond to following: green dotted lines are T50 interval, black dotted lines are T90 interval, blue solid line(s) is a spacecraft slew start time, and orange solid line(s) is a spacecraft slew end time.
- 5) Time of each bin is in the middle of the bin.
1 s binning
From T0-310 s to T0+310 s

From T100_start - 20 s to T100_end + 30 s
Full time interval
64 ms binning
Full time interval
From T100_start to T100_end
From T0-5 sec to T0+5 sec

16 ms binning
From T100_start-5 s to T100_start+5 s
Blue+Cyan dotted lines: Time interval of the scaled map
From 0.000000 to 0.064000
8 ms binning
From T100_start-3 s to T100_start+3 s
Blue+Cyan dotted lines: Time interval of the scaled map
From 0.000000 to 0.064000
2 ms binning
From T100_start-1 s to T100_start+1 s
Blue+Cyan dotted lines: Time interval of the scaled map
From 0.000000 to 0.064000
SN=5 or 10 sec. binning (whichever binning is satisfied first)
SN=5 or 10 sec. binning (T < 200 sec)
Quad-rate summed light curves (from T0-300s to T0+1000s)

Spectral Evolution
Spectra
Notes:
- 1) The fitting includes the systematic errors.
- 2) When the burst includes telescope slew time periods, the fitting uses an average response file made from multiple 5-s response files through out the slew time plus single time preiod for the non-slew times, and weighted by the total counts in the corresponding time period using addrmf. An average response file is needed becuase a spectral fit using the pre-slew DRM will introduce some errors in both a spectral shape and a normalization if the PHA file contains a lot of the slew/post-slew time interval.
- 3) For fits to more complicated models (e.g. a power-law over a cutoff power-law), the BAT team has decided to require a chi-square improvement of more than 6 for each extra dof.
Time averaged spectrum fit using the average DRM
Power-law model

Time interval is from   -0.272 sec. to   77.276 sec.

Spectral model in power-law:
------------------------------------------------------------
Parameters  : value       lower 90%   higher 90%
Photon index: 1.68437     ( -0.0239838   0.0238418 )
Norm@50keV  : 3.67948E-02    ( -0.000473709   0.000471994 )
------------------------------------------------------------
#Fit statistic : Chi-Squared =          29.80 using 59 PHA bins.
# Reduced chi-squared =         0.5229 for     57 degrees of freedom
# Null hypothesis probability =   9.988905e-01

Photon flux (15-150 keV)    in 77.55 sec: 4.86036 ( -0.0860878  0.086638 ) ph/cm2/s
Energy fluence (15-150 keV)             : 2.64534e-05 ( -3.22267e-07  3.22555e-07 ) ergs/cm2
Cutoff power-law model

Time interval is from   -0.272 sec. to   77.276 sec.
Spectral model in the cutoff power-law:
------------------------------------------------------------
Parameters  : value       lower 90%   higher 90%
Photon index: 1.68239     (     )
Epeak [keV] : 1.00000E+04      (   )
Norm@50keV  : 3.68643E-02    ( -0.000435364   0.000435196 )
------------------------------------------------------------
#Fit statistic : Chi-Squared =          29.97 using 59 PHA bins.
# Reduced chi-squared =         0.5352 for     56 degrees of freedom
# Null hypothesis probability =   9.983093e-01

Photon flux (15-150 keV)    in 77.55 sec: 4.85827 ( -0.088  0.08369 ) ph/cm2/s
Energy fluence (15-150 keV)             : 2.64629e-05 ( -3.24702e-07  3.16326e-07 ) ergs/cm2
Band function
Time interval is from   -0.272 sec. to   77.276 sec.

Spectral model in the Band function:
------------------------------------------------------------
Parameters  : value       lower 90%   higher 90%
alpha       : -1.33729   ( 1.33752   1.33752 )
beta        : -1.68438    ( -0.0239261   0.0239847 )
Epeak [keV] : 31.6931      ( -31.5512 -31.5512 )
Norm@50keV   : 7.63395E-02    ( -0.0257243   0 )
------------------------------------------------------------
#Fit statistic : Chi-Squared =          29.80 using 59 PHA bins.
# Reduced chi-squared =         0.5419 for     55 degrees of freedom
# Null hypothesis probability =   9.978089e-01

Photon flux (15-150 keV)    in 77.55 sec:  (    ) ph/cm2/s
Energy fluence (15-150 keV)             : 0 ( 0  0 ) ergs/cm2
Single BB
Spectral model blackbody:
------------------------------------------------------------
Parameters  : value    Lower 90%  Upper 90%
kT [keV]    : 19.6542  (  )
R^2/D10^2   : 0.180011  (   )
(R is the radius in km and D10 is the distance to the source in units of 10 kpc)
------------------------------------------------------------
#Fit statistic : Chi-Squared =        1833.21 using 59 PHA bins.
# Reduced chi-squared =        32.1615 for     57 degrees of freedom
# Null hypothesis probability =   0.000000e+00

Energy  Fluence     90% Error
[keV]   [erg/cm2]   [erg/cm2]
15- 25  1.047e-06   3.180e-08
25- 50  5.153e-06   1.097e-07
50-150  1.472e-05   2.133e-07
15-150  2.092e-05   2.792e-07
Thermal bremsstrahlung (OTTB)

Spectral model: thermal bremsstrahlung
------------------------------------------------------------
Parameters  : value         Lower 90%    Upper 90%
kT [keV]    : 199.066       (      )
Norm        : 18.6240       (-0.224487     0.38414)
------------------------------------------------------------
#Fit statistic : Chi-Squared =         106.31 using 59 PHA bins.
# Reduced chi-squared =         1.8650 for     57 degrees of freedom
# Null hypothesis probability =   8.132735e-05

Energy  Fluence     90% Error
[keV]   [erg/cm2]   [erg/cm2]
15- 25  3.596e-06   5.971e-08
25- 50  6.917e-06   1.062e-07
50-150  1.517e-05   2.520e-07
15-150  2.568e-05   4.226e-07
Double BB
Spectral model: bbodyrad<1> + bbodyrad<2>
------------------------------------------------------------
Parameters  : value         Lower 90%    Upper 90%
kT1 [keV]   : 7.77709        (-0.324332      0.335008)
R1^2/D10^2  : 3.82585        (-0.57705      0.700589)
kT2 [keV]   : 30.8589        (-1.17519      1.31354)
R2^2/D10^2  : 2.93489E-02    (-0.00413353   0.00452528)
------------------------------------------------------------
#Fit statistic : Chi-Squared =          60.01 using 59 PHA bins.
# Reduced chi-squared =          1.091 for     55 degrees of freedom
# Null hypothesis probability =   2.989369e-01

Energy  Fluence     90% Error
[keV]   [erg/cm2]   [erg/cm2]
15- 25  3.508e-06   1.838e-07
25- 50  7.367e-06   1.516e-07
50-150  1.509e-05   2.443e-07
15-150  2.596e-05   4.188e-07
Peak spectrum fit
Power-law model
Time interval is from   40.452 sec. to   41.452 sec.

Spectral model in power-law:
------------------------------------------------------------
Parameters  : value       lower 90%   higher 90%
Photon index: 1.53419     ( -0.0296983   0.0296656 )
Norm@50keV  : 0.322247    ( -0.00516307   0.00516064 )
------------------------------------------------------------
#Fit statistic : Chi-Squared =          71.83 using 59 PHA bins.
# Reduced chi-squared =          1.260 for     57 degrees of freedom
# Null hypothesis probability =   8.931898e-02

Photon flux (15-150 keV)    in 1 sec: 40.6096 ( -0.780867  0.785074 ) ph/cm2/s
Energy fluence (15-150 keV)             : 3.04069e-06 ( -4.83278e-08  4.83318e-08 ) ergs/cm2
Cutoff power-law model
Time interval is from   40.452 sec. to   41.452 sec.
Spectral model in the cutoff power-law:
------------------------------------------------------------
Parameters  : value       lower 90%   higher 90%
Photon index: 1.22252     ( -0.124313   0.121139 )
Epeak [keV] : 149.110      ( -25.8091 54.9217 )
Norm@50keV  : 0.435706    ( -0.0470758   0.0540706 )
------------------------------------------------------------
#Fit statistic : Chi-Squared =          51.88 using 59 PHA bins.
# Reduced chi-squared =         0.9265 for     56 degrees of freedom
# Null hypothesis probability =   6.313722e-01

Photon flux (15-150 keV)    in 1 sec: 39.4673 ( -0.8753  0.8813 ) ph/cm2/s
Energy fluence (15-150 keV)             : 2.99634e-06 ( 0  0 ) ergs/cm2
Band function

Time interval is from   40.452 sec. to   41.452 sec.

Spectral model in the Band function:
------------------------------------------------------------
Parameters  : value       lower 90%   higher 90%
alpha       : -1.22727   ( -0.115008   0.125609 )
beta        : -9.37167    ( 9.37167   19.3717 )
Epeak [keV] : 150.133      ( -20.8716 39.8064 )
Norm@50keV   : 0.434226    ( -0.0451439   0.0278406 )
------------------------------------------------------------
#Fit statistic : Chi-Squared =          51.89 using 59 PHA bins.
# Reduced chi-squared =         0.9435 for     55 degrees of freedom
# Null hypothesis probability =   5.941696e-01

Photon flux (15-150 keV)    in 1 sec: 39.5097 (    ) ph/cm2/s
Energy fluence (15-150 keV)             : 0 ( 0  0 ) ergs/cm2
Single BB
Spectral model blackbody:
------------------------------------------------------------
Parameters  : value    Lower 90%  Upper 90%
kT [keV]    : 18.3919  (  )
R^2/D10^2   : 2.15488  (   )
(R is the radius in km and D10 is the distance to the source in units of 10 kpc)
------------------------------------------------------------
#Fit statistic : Chi-Squared =         818.87 using 59 PHA bins.
# Reduced chi-squared =         14.366 for     57 degrees of freedom
# Null hypothesis probability =  1.956994e-135

Energy  Fluence     90% Error
[keV]   [erg/cm2]   [erg/cm2]
15- 25  1.449e-07   5.100e-09
25- 50  6.809e-07   1.640e-08
50-150  1.681e-06   4.000e-08
15-150  2.507e-06   4.200e-08
Thermal bremsstrahlung (OTTB)
Spectral model: thermal bremsstrahlung
------------------------------------------------------------
Parameters  : value         Lower 90%    Upper 90%
kT [keV]    : 200.000       (      )
Norm        : 166.668       (-2.63284     2.63269)
------------------------------------------------------------
#Fit statistic : Chi-Squared =          72.01 using 59 PHA bins.
# Reduced chi-squared =          1.263 for     57 degrees of freedom
# Null hypothesis probability =   8.700650e-02

Energy  Fluence     90% Error
[keV]   [erg/cm2]   [erg/cm2]
15- 25  4.151e-07   8.100e-09
25- 50  7.985e-07   1.525e-08
50-150  1.751e-06   3.500e-08
15-150  2.965e-06   5.900e-08
Double BB
Spectral model: bbodyrad<1> + bbodyrad<2>
------------------------------------------------------------
Parameters  : value         Lower 90%    Upper 90%
kT1 [keV]   : 7.88928        (-0.475626      0.49705)
R1^2/D10^2  : 26.1035        (-4.96807      6.46344)
kT2 [keV]   : 28.6726        (-1.42751      1.65548)
R2^2/D10^2  : 0.365179    (-0.0689449   0.0775452)
------------------------------------------------------------
#Fit statistic : Chi-Squared =          45.99 using 59 PHA bins.
# Reduced chi-squared =         0.8362 for     55 degrees of freedom
# Null hypothesis probability =   8.014097e-01

Energy  Fluence     90% Error
[keV]   [erg/cm2]   [erg/cm2]
15- 25  3.390e-07   2.040e-08
25- 50  7.887e-07   2.505e-08
50-150  1.849e-06   6.150e-08
15-150  2.977e-06   7.250e-08
Pre-slew spectrum (Pre-slew PHA with pre-slew DRM)
Power-law model

Spectral model in power-law:
------------------------------------------------------------
Parameters  : value       lower 90%   higher 90%
Photon index: 1.18761     ( -0.0395363   0.0393791 )
Norm@50keV  : 3.13594E-02    ( -0.000664033   0.000662793 )
------------------------------------------------------------
#Fit statistic : Chi-Squared =          60.18 using 59 PHA bins.
# Reduced chi-squared =          1.056 for     57 degrees of freedom
# Null hypothesis probability =   3.613006e-01

Photon flux (15-150 keV)    in 9.877 sec: 3.67466 ( -0.0843345  0.0845532 ) ph/cm2/s
Energy fluence (15-150 keV)             : 3.1535e-06 ( -6.79154e-08  6.79603e-08 ) ergs/cm2
Cutoff power-law model
Spectral model in the cutoff power-law:
------------------------------------------------------------
Parameters  : value       lower 90%   higher 90%
Photon index: 1.12063     ( -0.155806   0.0819588 )
Epeak [keV] : 787.303      ( -787.399 -787.399 )
Norm@50keV  : 3.34654E-02    ( -0.00110169   0.00530014 )
------------------------------------------------------------
#Fit statistic : Chi-Squared =          59.62 using 59 PHA bins.
# Reduced chi-squared =          1.065 for     56 degrees of freedom
# Null hypothesis probability =   3.454730e-01

Photon flux (15-150 keV)    in 9.877 sec: 3.65750 ( -0.0919  0.0921 ) ph/cm2/s
Energy fluence (15-150 keV)             : 3.14526e-06 ( -7.1786e-08  6.87538e-08 ) ergs/cm2
Band function
Spectral model in the Band function:
------------------------------------------------------------
Parameters  : value       lower 90%   higher 90%
alpha       : 0.684231   ( -2.54516   -0.68561 )
beta        : -1.21051    ( -0.0499829   0.0462864 )
Epeak [keV] : 39.0086      ( -12.952 146.853 )
Norm@50keV   : 0.651619    ( -0.657724   748.405 )
------------------------------------------------------------
#Fit statistic : Chi-Squared =          56.82 using 59 PHA bins.
# Reduced chi-squared =          1.033 for     55 degrees of freedom
# Null hypothesis probability =   4.069058e-01

Photon flux (15-150 keV)    in 9.877 sec:  (    ) ph/cm2/s
Energy fluence (15-150 keV)             : 0 ( 0  0 ) ergs/cm2
S(25-50 keV) vs. S(50-100 keV) plot

S(25-50 keV)  = 7.11e-06
S(50-100 keV) = 8.85e-06
T90 vs. Hardness ratio plot
T90                                   = 56.3280000090599 sec.
Hardness ratio (energy fluence ratio) = 1.24473
Color vs. Color plot

Count Ratio  (25-50 keV) / (15-25 keV) = 1.14318
Count Ratio (50-100 keV) / (15-25 keV) = 0.756202
Mask shadow pattern
IMX = -5.330752492201082E-01, IMY = 1.642679042824512E-01
TIME vs. PHA plot around the trigger time
Blue+Cyan dotted lines: Time interval of the scaled map
From 0.000000 to 0.064000
TIME vs. DetID plot around the trigger time
Blue+Cyan dotted lines: Time interval of the scaled map
From 0.000000 to 0.064000
100 us light curve (15-350 keV)
Blue+Cyan dotted lines: Time interval of the scaled map
From 0.000000 to 0.064000
Spacecraft aspect plot

Bright source in the pre-burst/pre-slew/post-slew images
Pre-burst image of 15-350 keV band
Time interval of the image:
-239.296000 -177.282900
-119.296000 -0.272000

# RAcent  DECcent POSerr Theta    Phi  PeakCts   SNR AngSep     Name
#  [deg]    [deg]    ['] [deg]  [deg]                   [']
135.6017 -40.6155    2.3  29.7   61.1   1.4101   5.1    4.9	Vela X-1
170.4405 -60.7496   22.6  37.9  113.2   0.2501   0.5    8.4	Cen X-3
115.8915  -3.6317    3.6  53.8    8.2   2.3576   3.2 ------	UNKNOWN
 95.8314   1.4747    2.3  56.4  -16.9   3.5180   4.9 ------	UNKNOWN
 79.3285 -13.8883    2.9  43.1  -40.7   1.3927   3.9 ------	UNKNOWN
 44.1905 -34.0300    3.6  41.1  -98.1   3.1232   3.2 ------	UNKNOWN
Pre-slew background subtracted image of 15-350 keV band
Time interval of the image:
-0.272000 9.604620

# RAcent  DECcent POSerr Theta    Phi  PeakCts   SNR AngSep     Name
#  [deg]    [deg]    ['] [deg]  [deg]                   [']
135.4793 -40.4240    7.7  29.8   60.6   0.1291   1.5    8.2	Vela X-1
170.6707 -60.5928    0.0  38.1  113.0  -0.0429  -0.3   10.6	Cen X-3
 37.9613 -71.2971    0.1  29.2 -162.9   4.7680  85.6 ------	UNKNOWN
 48.6663 -57.8381    2.5  25.8 -132.7   0.2760   4.6 ------	UNKNOWN
 47.0122 -54.3766    2.1  27.7 -126.0   0.3541   5.6 ------	UNKNOWN
Post-slew image of 15-350 keV band
Time interval of the image:
59.204590 209.804600

# RAcent  DECcent POSerr Theta    Phi  PeakCts   SNR AngSep     Name
#  [deg]    [deg]    ['] [deg]  [deg]                   [']
299.4399 -39.5621    2.6  55.5  175.3   2.9640   4.4 ------	UNKNOWN
100.7669 -34.8174    2.5  48.6    4.2   1.4743   4.6 ------	UNKNOWN
 37.9321 -71.3071    0.6   0.1 -119.0   2.9805  20.8 ------	UNKNOWN
345.3337 -54.2699    2.6  28.1 -153.2   0.6655   4.4 ------	UNKNOWN
 61.0827 -22.3999    3.0  50.7  -44.5   3.2968   3.8 ------	UNKNOWN
Plot creation:
Sun May 31 07:51:23 EDT 2015