Click here for the BAT GCN circular template
Image
Pre-slew 15.0-350.0 keV image (Event data)
#   RAcent    DECcent   POSerr    Theta     Phi              Peak Cts       SNR   Name
  329.4683    38.9425   0.0238    37.5577   -19.3829         0.8498448      8.129 TRIG_00311159

Foreground time interval of the image:
 19.068  73.301 (delta_t =  54.233 [sec])
Background time interval of the image:
-134.699  19.068 (delta_t = 153.767 [sec])
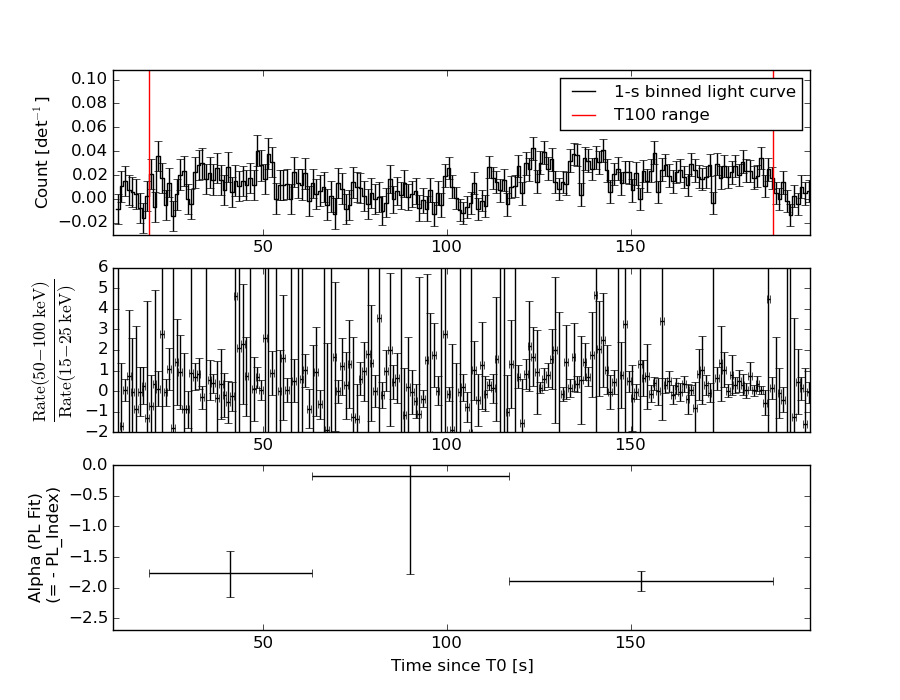
Lightcurves
Notes:
- 1) The mask-weighted light curves are using the flight position.
- 2) Multiple plots of different time binning/intervals are shown to cover all scenarios of short/long GRBs, rate/image triggers, and real/false positives.
- 3) For all the mask-weighted lightcurves, the y-axis units are counts/sec/det where a det is 0.4 x 0.4 = 0.16 sq cm.
- 4) The verticle lines correspond to following: green dotted lines are T50 interval, black dotted lines are T90 interval, blue solid line(s) is a spacecraft slew start time, and orange solid line(s) is a spacecraft slew end time.
- 5) Time of each bin is in the middle of the bin.
1 s binning
From T0-310 s to T0+310 s
From T100_start - 20 s to T100_end + 30 s

Full time interval
64 ms binning
Full time interval

From T100_start to T100_end
From T0-5 sec to T0+5 sec

16 ms binning
From T100_start-5 s to T100_start+5 s
Blue+Cyan dotted lines: Time interval of the scaled map
From 0.000000 to 64.000000
8 ms binning
From T100_start-3 s to T100_start+3 s

Blue+Cyan dotted lines: Time interval of the scaled map
From 0.000000 to 64.000000
2 ms binning
From T100_start-1 s to T100_start+1 s
Blue+Cyan dotted lines: Time interval of the scaled map
From 0.000000 to 64.000000
SN=5 or 10 sec. binning (whichever binning is satisfied first)
SN=5 or 10 sec. binning (T < 200 sec)
Quad-rate summed light curves (from T0-300s to T0+1000s)

Spectral Evolution
Spectra
Notes:
- 1) The fitting includes the systematic errors.
- 2) When the burst includes telescope slew time periods, the fitting uses an average response file made from multiple 5-s response files through out the slew time plus single time preiod for the non-slew times, and weighted by the total counts in the corresponding time period using addrmf. An average response file is needed becuase a spectral fit using the pre-slew DRM will introduce some errors in both a spectral shape and a normalization if the PHA file contains a lot of the slew/post-slew time interval.
- 3) For fits to more complicated models (e.g. a power-law over a cutoff power-law), the BAT team has decided to require a chi-square improvement of more than 6 for each extra dof.
Time averaged spectrum fit using the average DRM
Power-law model

Time interval is from   19.068 sec. to  188.820 sec.

Spectral model in power-law:
------------------------------------------------------------
Parameters  : value       lower 90%   higher 90%
Photon index: 1.75394     ( -0.182115   0.187789 )
Norm@50keV  : 8.28453E-04    ( -9.52265e-05   9.32488e-05 )
------------------------------------------------------------
#Fit statistic : Chi-Squared =          47.99 using 59 PHA bins.
# Reduced chi-squared =         0.8420 for     57 degrees of freedom
# Null hypothesis probability =   7.964764e-01

Photon flux (15-150 keV)    in 169.8 sec: 0.112184 ( -0.0109571  0.0109611 ) ph/cm2/s
Energy fluence (15-150 keV)             : 1.29773e-06 ( -1.53145e-07  1.56136e-07 ) ergs/cm2
Cutoff power-law model
Time interval is from   19.068 sec. to  188.820 sec.
Spectral model in the cutoff power-law:
------------------------------------------------------------
Parameters  : value       lower 90%   higher 90%
Photon index: 1.75291     ( -0.672526   0.757728 )
Epeak [keV] : 9999.13      (   )
Norm@50keV  : 8.29655E-04    ( -9.56953e-05   0.00117438 )
------------------------------------------------------------
#Fit statistic : Chi-Squared =          48.00 using 59 PHA bins.
# Reduced chi-squared =         0.8571 for     56 degrees of freedom
# Null hypothesis probability =   7.678808e-01

Photon flux (15-150 keV)    in 169.8 sec: 0.112180 ( -0.010919  0.010923 ) ph/cm2/s
Energy fluence (15-150 keV)             : 1.29728e-06 ( -1.76938e-07  1.5464e-07 ) ergs/cm2
Band function
Time interval is from   19.068 sec. to  188.820 sec.

Spectral model in the Band function:
------------------------------------------------------------
Parameters  : value       lower 90%   higher 90%
alpha       : 2.57585   ( -2.57584   -2.57584 )
beta        : -1.79002    ( -0.229666   0.196903 )
Epeak [keV] : 21.2701      ( -21.2701 237.177 )
Norm@50keV   : 3.34867    ( -3.34726   137.353 )
------------------------------------------------------------
#Fit statistic : Chi-Squared =          47.75 using 59 PHA bins.
# Reduced chi-squared =         0.8682 for     55 degrees of freedom
# Null hypothesis probability =   7.453720e-01

Photon flux (15-150 keV)    in 169.8 sec:  (    ) ph/cm2/s
Energy fluence (15-150 keV)             : 0 ( 0  0 ) ergs/cm2
Single BB
Spectral model blackbody:
------------------------------------------------------------
Parameters  : value    Lower 90%  Upper 90%
kT [keV]    : 11.1452  (-1.35794  1.58752)
R^2/D10^2   : 3.45387E-02  (-0.0134209   0.021472)
(R is the radius in km and D10 is the distance to the source in units of 10 kpc)
------------------------------------------------------------
#Fit statistic : Chi-Squared =          75.62 using 59 PHA bins.
# Reduced chi-squared =          1.327 for     57 degrees of freedom
# Null hypothesis probability =   4.999659e-02

Energy  Fluence     90% Error
[keV]   [erg/cm2]   [erg/cm2]
15- 25  1.526e-07   2.809e-08
25- 50  4.388e-07   5.824e-08
50-150  3.109e-07   7.700e-08
15-150  9.023e-07   1.133e-07
Thermal bremsstrahlung (OTTB)
Spectral model: thermal bremsstrahlung
------------------------------------------------------------
Parameters  : value         Lower 90%    Upper 90%
kT [keV]    : 108.039       (-35.5834      83.0282)
Norm        : 0.486061       (-0.0623469     0.0741343)
------------------------------------------------------------
#Fit statistic : Chi-Squared =          49.40 using 59 PHA bins.
# Reduced chi-squared =         0.8666 for     57 degrees of freedom
# Null hypothesis probability =   7.527381e-01

Energy  Fluence     90% Error
[keV]   [erg/cm2]   [erg/cm2]
15- 25  2.156e-07   3.005e-08
25- 50  3.785e-07   4.610e-08
50-150  6.400e-07   2.651e-07
15-150  1.234e-06   3.204e-07
Double BB
Spectral model: bbodyrad<1> + bbodyrad<2>
------------------------------------------------------------
Parameters  : value         Lower 90%    Upper 90%
kT1 [keV]   : 6.63010        (-2.30118      2.7644)
R1^2/D10^2  : 0.175151        (-0.113762      0.603819)
kT2 [keV]   : 26.7411        (-11.0171      -27.412)
R2^2/D10^2  : 1.06404E-03    (-0.000945253   0.00584667)
------------------------------------------------------------
#Fit statistic : Chi-Squared =          50.71 using 59 PHA bins.
# Reduced chi-squared =         0.9220 for     55 degrees of freedom
# Null hypothesis probability =   6.391061e-01

Energy  Fluence     90% Error
[keV]   [erg/cm2]   [erg/cm2]
15- 25  2.194e-07   9.588e-08
25- 50  3.701e-07   1.454e-07
50-150  6.971e-07   3.749e-07
15-150  1.287e-06   5.229e-07
Peak spectrum fit
Power-law model
Time interval is from  134.476 sec. to  135.476 sec.

Spectral model in power-law:
------------------------------------------------------------
Parameters  : value       lower 90%   higher 90%
Photon index: 1.80886     ( -0.654681   0.781919 )
Norm@50keV  : 2.47943E-03    ( -0.00114964   0.00103648 )
------------------------------------------------------------
#Fit statistic : Chi-Squared =          39.03 using 59 PHA bins.
# Reduced chi-squared =         0.6847 for     57 degrees of freedom
# Null hypothesis probability =   9.669598e-01

Photon flux (15-150 keV)    in 1 sec: 0.342840 ( -0.114232  0.114294 ) ph/cm2/s
Energy fluence (15-150 keV)             : 2.28189e-08 ( -9.7235e-09  1.06207e-08 ) ergs/cm2
Cutoff power-law model

Time interval is from  134.476 sec. to  135.476 sec.
Spectral model in the cutoff power-law:
------------------------------------------------------------
Parameters  : value       lower 90%   higher 90%
Photon index: 1.81829     (     )
Epeak [keV] : 9999.35      (   )
Norm@50keV  : 2.47043E-03    (     )
------------------------------------------------------------
#Fit statistic : Chi-Squared =          39.03 using 59 PHA bins.
# Reduced chi-squared =         0.6969 for     56 degrees of freedom
# Null hypothesis probability =   9.588377e-01

Photon flux (15-150 keV)    in 1 sec: 0.342106 ( -0.113826  0.114006 ) ph/cm2/s
Energy fluence (15-150 keV)             : 2.29024e-08 ( -1.05846e-08  1.03296e-08 ) ergs/cm2
Band function

Time interval is from  134.476 sec. to  135.476 sec.

Spectral model in the Band function:
------------------------------------------------------------
Parameters  : value       lower 90%   higher 90%
alpha       : -1.46637   ( 1.46637   1.46637 )
beta        : -1.80883    ( 1.80884   0.654466 )
Epeak [keV] : 13.9953      ( -13.9963 -13.9963 )
Norm@50keV   : 6.28679E-03    ( -0.00628672   6648.43 )
------------------------------------------------------------
#Fit statistic : Chi-Squared =          39.03 using 59 PHA bins.
# Reduced chi-squared =         0.7096 for     55 degrees of freedom
# Null hypothesis probability =   9.491354e-01

Photon flux (15-150 keV)    in 1 sec:  (    ) ph/cm2/s
Energy fluence (15-150 keV)             : 0 ( 0  0 ) ergs/cm2
Single BB
Spectral model blackbody:
------------------------------------------------------------
Parameters  : value    Lower 90%  Upper 90%
kT [keV]    : 8.92307  (-2.88999  5.07095)
R^2/D10^2   : 0.240852  (-0.24063   0.82606)
(R is the radius in km and D10 is the distance to the source in units of 10 kpc)
------------------------------------------------------------
#Fit statistic : Chi-Squared =          41.61 using 59 PHA bins.
# Reduced chi-squared =         0.7300 for     57 degrees of freedom
# Null hypothesis probability =   9.372544e-01

Energy  Fluence     90% Error
[keV]   [erg/cm2]   [erg/cm2]
15- 25  3.717e-09   2.256e-09
25- 50  7.795e-09   4.938e-09
50-150  2.896e-09   2.321e-09
15-150  1.441e-08   9.395e-09
Thermal bremsstrahlung (OTTB)
Spectral model: thermal bremsstrahlung
------------------------------------------------------------
Parameters  : value         Lower 90%    Upper 90%
kT [keV]    : 97.4641       (-97.5334      -97.5334)
Norm        : 1.51454       (-0.575824     1.34453)
------------------------------------------------------------
#Fit statistic : Chi-Squared =          39.52 using 59 PHA bins.
# Reduced chi-squared =         0.6934 for     57 degrees of freedom
# Null hypothesis probability =   9.623153e-01

Energy  Fluence     90% Error
[keV]   [erg/cm2]   [erg/cm2]
15- 25  3.958e-09   2.394e-09
25- 50  6.808e-09   4.233e-09
50-150  1.087e-08   8.745e-09
15-150  2.164e-08   1.509e-08
Double BB
------------------------------------------------------------
#Fit statistic : Chi-Squared =          40.17 using 59 PHA bins.
#Fit statistic : Chi-Squared =          38.12 using 59 PHA bins.
#Fit statistic : Chi-Squared =          38.10 using 59 PHA bins.
#Fit statistic : Chi-Squared =          38.06 using 59 PHA bins.
# Reduced chi-squared =         0.7303 for     55 degrees of freedom
# Reduced chi-squared =         0.6931 for     55 degrees of freedom
# Reduced chi-squared =         0.6928 for     55 degrees of freedom
# Reduced chi-squared =         0.6919 for     55 degrees of freedom
# Null hypothesis probability =   9.333287e-01
# Null hypothesis probability =   9.595977e-01
# Null hypothesis probability =   9.598220e-01
# Null hypothesis probability =   9.602998e-01

Energy  Fluence     90% Error
[keV]   [erg/cm2]   [erg/cm2]
15- 25  3.856e-09   1.879e-09
25- 50  7.227e-09   4.454e-09
50-150  4.420e-09   3.411e-09
15-150  1.550e-08   9.350e-09
Pre-slew spectrum (Pre-slew PHA with pre-slew DRM)
Power-law model
Spectral model in power-law:
------------------------------------------------------------
Parameters  : value       lower 90%   higher 90%
Photon index: 1.70818     ( -0.376285   0.400285 )
Norm@50keV  : 8.32381E-04    ( -0.000202552   0.000195341 )
------------------------------------------------------------
#Fit statistic : Chi-Squared =          57.33 using 59 PHA bins.
# Reduced chi-squared =          1.006 for     57 degrees of freedom
# Null hypothesis probability =   4.626741e-01

Photon flux (15-150 keV)    in 54.23 sec: 0.110867 ( -0.0236366  0.0236556 ) ph/cm2/s
Energy fluence (15-150 keV)             : 4.1768e-07 ( -1.03426e-07  1.06782e-07 ) ergs/cm2
Cutoff power-law model
Spectral model in the cutoff power-law:
------------------------------------------------------------
Parameters  : value       lower 90%   higher 90%
Photon index: 1.35071     ( -2.45887   0.935424 )
Epeak [keV] : 80.9720      ( -81.1114 -81.1681 )
Norm@50keV  : 1.31509E-03    ( -0.00131171   0.0294599 )
------------------------------------------------------------
#Fit statistic : Chi-Squared =          57.22 using 59 PHA bins.
# Reduced chi-squared =          1.022 for     56 degrees of freedom
# Null hypothesis probability =   4.297264e-01

Photon flux (15-150 keV)    in 54.23 sec: 0.109350 ( -0.0251727  0.024598 ) ph/cm2/s
Energy fluence (15-150 keV)             : 4.02694e-07 ( -1.2189e-07  1.19092e-07 ) ergs/cm2
Band function
Spectral model in the Band function:
------------------------------------------------------------
Parameters  : value       lower 90%   higher 90%
alpha       : -1.10050   ( 1.10024   6.08218 )
beta        : -2.04618    ( 2.01461   0.658919 )
Epeak [keV] : 62.0235      ( -60.127 121.406 )
Norm@50keV   : 1.85052E-03    ( -0.00197343   114.54 )
------------------------------------------------------------
#Fit statistic : Chi-Squared =          57.02 using 59 PHA bins.
# Reduced chi-squared =          1.037 for     55 degrees of freedom
# Null hypothesis probability =   4.000275e-01

Photon flux (15-150 keV)    in 54.23 sec:  (    ) ph/cm2/s
Energy fluence (15-150 keV)             : 4.00484e-07 ( 0  0 ) ergs/cm2
S(25-50 keV) vs. S(50-100 keV) plot
S(25-50 keV)  = 3.59e-07
S(50-100 keV) = 4.26e-07
T90 vs. Hardness ratio plot
T90                                   = 152.199999988079 sec.
Hardness ratio (energy fluence ratio) = 1.18663
Color vs. Color plot
Count Ratio  (25-50 keV) / (15-25 keV) = 1.02358
Count Ratio (50-100 keV) / (15-25 keV) = 0.684977
Mask shadow pattern

IMX = 7.253459036448802E-01, IMY = 2.551906428780563E-01
TIME vs. PHA plot around the trigger time
Blue+Cyan dotted lines: Time interval of the scaled map
From 0.000000 to 64.000000
TIME vs. DetID plot around the trigger time
Blue+Cyan dotted lines: Time interval of the scaled map
From 0.000000 to 64.000000
100 us light curve (15-350 keV)

Blue+Cyan dotted lines: Time interval of the scaled map
From 0.000000 to 64.000000
Spacecraft aspect plot
Bright source in the pre-burst/pre-slew/post-slew images
Pre-burst image of 15-350 keV band
Time interval of the image:
-134.699400 19.068000

# RAcent  DECcent POSerr Theta    Phi  PeakCts   SNR AngSep     Name
#  [deg]    [deg]    ['] [deg]  [deg]                   [']
254.5357  35.3556    6.6  37.8   85.7   0.7962   1.8    3.9	Her X-1
299.5909  35.2016    0.4  34.3   21.8   5.2225  28.4    0.0	Cyg X-1
308.1012  40.9598    4.0  30.0    7.2   0.4592   2.9    0.6	Cyg X-3
326.1496  38.3203   93.4  37.1  -15.1   0.0238   0.1    1.0	Cyg X-2
196.9199  42.0037    3.2  51.3  148.6   2.4599   3.7 ------	UNKNOWN
200.3035  47.9683    2.2  45.0  149.7   1.9320   5.1 ------	UNKNOWN
345.3588  24.2441    2.8  56.3  -28.7   3.3018   4.2 ------	UNKNOWN
Pre-slew background subtracted image of 15-350 keV band
Time interval of the image:
19.068000 73.300590

# RAcent  DECcent POSerr Theta    Phi  PeakCts   SNR AngSep     Name
#  [deg]    [deg]    ['] [deg]  [deg]                   [']
254.4685  35.4021    6.1  37.8   85.8  -0.5559  -1.9    3.6	Her X-1
299.4850  35.1010   21.1  34.4   22.0  -0.0620  -0.5    7.9	Cyg X-1
307.9951  40.8275    7.1  30.1    7.5  -0.1579  -1.6    9.1	Cyg X-3
326.1352  38.1658    5.9  37.2  -14.9   0.2190   1.9    9.5	Cyg X-2
317.1369  17.5014    2.3  54.7    4.4   1.8245   4.9 ------	UNKNOWN
329.4684  38.9425    1.4  37.6  -19.4   0.8501   8.1 ------	UNKNOWN
344.6690  25.2718    2.0  55.1  -28.4   2.1605   5.9 ------	UNKNOWN
  1.2886  47.0889    2.0  41.6  -57.7   1.1717   5.9 ------	UNKNOWN
Post-slew image of 15-350 keV band
Time interval of the image:
129.300600 543.105500
841.000000 903.053700

# RAcent  DECcent POSerr Theta    Phi  PeakCts   SNR AngSep     Name
#  [deg]    [deg]    ['] [deg]  [deg]                   [']
299.5910  35.1975    0.3  24.0   94.5  17.6210  44.5    0.2	Cyg X-1
308.1175  40.9075    2.6  16.4  107.7   1.3751   4.5    2.7	Cyg X-3
326.3671  38.1876   76.6   2.5   76.6   0.0496   0.2   12.2	Cyg X-2
260.4367  53.8677    2.5  47.7  136.2   6.1531   4.6 ------	UNKNOWN
307.6600  62.2980    2.6  26.8  161.7   1.6027   4.4 ------	UNKNOWN
329.4581  39.0433    2.1   0.1 -155.6   1.8660   5.3 ------	UNKNOWN
  3.8828  40.5261    5.1  26.4 -100.2   0.9469   2.3 ------	UNKNOWN
 38.7971  66.0090    3.5  46.7 -144.2   2.1990   3.3 ------	UNKNOWN
Plot creation:
Sun May 31 07:39:32 EDT 2015