Special notes of this burst
Image
Pre-slew 15.0-350.0 keV image (Event data)
#   RAcent    DECcent   POSerr    Theta     Phi              Peak Cts       SNR   Name
  102.2784    50.7460   0.0208    29.1612   -68.1976         0.9886091      9.233 TRIG_00311874

Foreground time interval of the image:
 -0.764  54.517 (delta_t =  55.281 [sec])
Background time interval of the image:
-239.784  -0.764 (delta_t = 239.020 [sec])
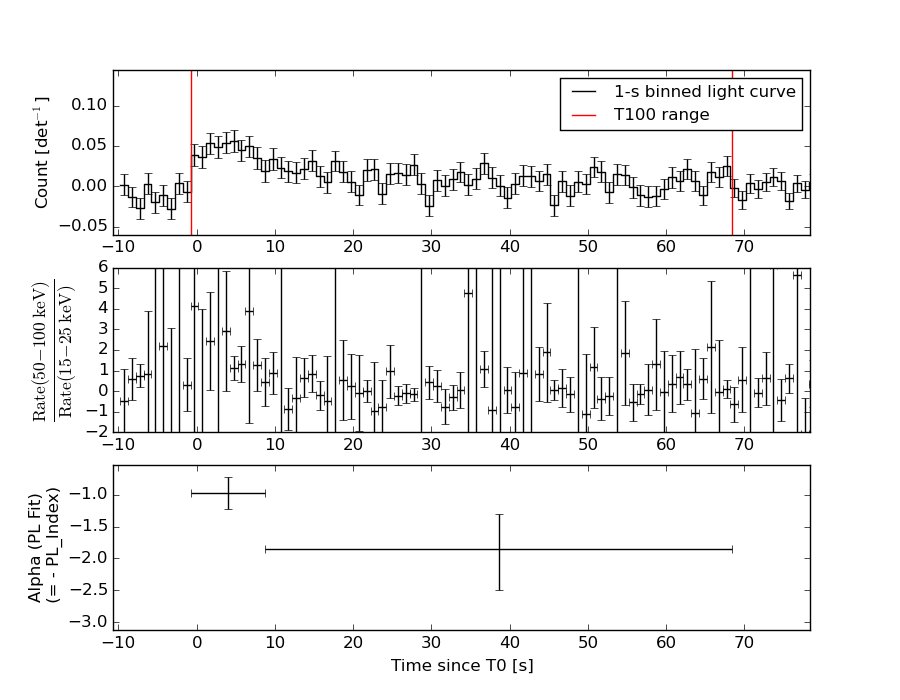
Lightcurves
Notes:
- 1) The mask-weighted light curves are using the flight position.
- 2) Multiple plots of different time binning/intervals are shown to cover all scenarios of short/long GRBs, rate/image triggers, and real/false positives.
- 3) For all the mask-weighted lightcurves, the y-axis units are counts/sec/det where a det is 0.4 x 0.4 = 0.16 sq cm.
- 4) The verticle lines correspond to following: green dotted lines are T50 interval, black dotted lines are T90 interval, blue solid line(s) is a spacecraft slew start time, and orange solid line(s) is a spacecraft slew end time.
- 5) Time of each bin is in the middle of the bin.
1 s binning
From T0-310 s to T0+310 s
From T100_start - 20 s to T100_end + 30 s

Full time interval

64 ms binning
Full time interval

From T100_start to T100_end
From T0-5 sec to T0+5 sec
16 ms binning
From T100_start-5 s to T100_start+5 s
Blue+Cyan dotted lines: Time interval of the scaled map
From 0.000000 to 8.192000
8 ms binning
From T100_start-3 s to T100_start+3 s
Blue+Cyan dotted lines: Time interval of the scaled map
From 0.000000 to 8.192000
2 ms binning
From T100_start-1 s to T100_start+1 s
Blue+Cyan dotted lines: Time interval of the scaled map
From 0.000000 to 8.192000
SN=5 or 10 sec. binning (whichever binning is satisfied first)

SN=5 or 10 sec. binning (T < 200 sec)
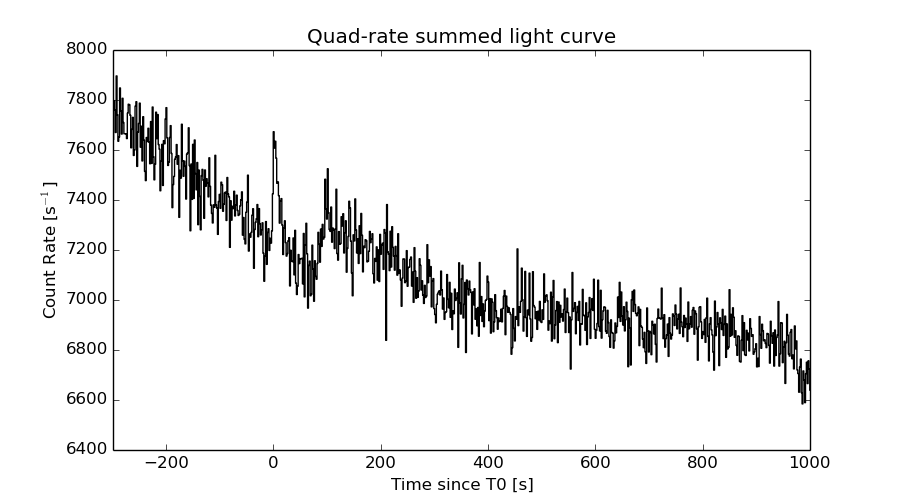
Quad-rate summed light curves (from T0-300s to T0+1000s)
Spectral Evolution
Spectra
Notes:
- 1) The fitting includes the systematic errors.
- 2) When the burst includes telescope slew time periods, the fitting uses an average response file made from multiple 5-s response files through out the slew time plus single time preiod for the non-slew times, and weighted by the total counts in the corresponding time period using addrmf. An average response file is needed becuase a spectral fit using the pre-slew DRM will introduce some errors in both a spectral shape and a normalization if the PHA file contains a lot of the slew/post-slew time interval.
- 3) For fits to more complicated models (e.g. a power-law over a cutoff power-law), the BAT team has decided to require a chi-square improvement of more than 6 for each extra dof.
Time averaged spectrum fit using the average DRM
Power-law model

Time interval is from   -0.764 sec. to   68.388 sec.

Spectral model in power-law:
------------------------------------------------------------
Parameters  : value       lower 90%   higher 90%
Photon index: 1.42775     ( -0.317377   0.319741 )
Norm@50keV  : 8.82617E-04    ( -0.000167269   0.000165719 )
------------------------------------------------------------
#Fit statistic : Chi-Squared =          54.31 using 59 PHA bins.
# Reduced chi-squared =         0.9528 for     57 degrees of freedom
# Null hypothesis probability =   5.765862e-01

Photon flux (15-150 keV)    in 69.15 sec: 0.108183 ( -0.0200869  0.0201202 ) ph/cm2/s
Energy fluence (15-150 keV)             : 5.86497e-07 ( -1.22133e-07  1.24785e-07 ) ergs/cm2
Cutoff power-law model

Time interval is from   -0.764 sec. to   68.388 sec.
Spectral model in the cutoff power-law:
------------------------------------------------------------
Parameters  : value       lower 90%   higher 90%
Photon index: 0.816952     ( -1.73459   0.88722 )
Epeak [keV] : 94.5658      ( -41.1858 -94.5617 )
Norm@50keV  : 1.82368E-03    ( -0.00112412   0.0115822 )
------------------------------------------------------------
#Fit statistic : Chi-Squared =          53.67 using 59 PHA bins.
# Reduced chi-squared =         0.9584 for     56 degrees of freedom
# Null hypothesis probability =   5.634678e-01

Photon flux (15-150 keV)    in 69.15 sec: 0.105488 ( -0.0211067  0.020927 ) ph/cm2/s
Energy fluence (15-150 keV)             : 5.56983e-07 ( -1.35714e-07  1.39247e-07 ) ergs/cm2
Band function

Time interval is from   -0.764 sec. to   68.388 sec.

Spectral model in the Band function:
------------------------------------------------------------
Parameters  : value       lower 90%   higher 90%
alpha       : -0.694864   ( 0.688822   5.36682 )
beta        : -1.84794    ( 1.86521   0.707765 )
Epeak [keV] : 81.8103      ( -81.6924 541.353 )
Norm@50keV   : 2.16941E-03    ( -0.00131849   40.0206 )
------------------------------------------------------------
#Fit statistic : Chi-Squared =          53.58 using 59 PHA bins.
# Reduced chi-squared =         0.9743 for     55 degrees of freedom
# Null hypothesis probability =   5.288396e-01

Photon flux (15-150 keV)    in 69.15 sec:  (    ) ph/cm2/s
Energy fluence (15-150 keV)             : 0 ( 0  0 ) ergs/cm2
Single BB
Spectral model blackbody:
------------------------------------------------------------
Parameters  : value    Lower 90%  Upper 90%
kT [keV]    : 15.2024  (-3.01103  3.98257)
R^2/D10^2   : 1.20325E-02  (-0.00668687   0.0139612)
(R is the radius in km and D10 is the distance to the source in units of 10 kpc)
------------------------------------------------------------
#Fit statistic : Chi-Squared =          57.77 using 59 PHA bins.
# Reduced chi-squared =          1.014 for     57 degrees of freedom
# Null hypothesis probability =   4.464865e-01

Energy  Fluence     90% Error
[keV]   [erg/cm2]   [erg/cm2]
15- 25  4.017e-08   1.596e-08
25- 50  1.616e-07   4.754e-08
50-150  2.556e-07   1.005e-07
15-150  4.574e-07   1.222e-07
Thermal bremsstrahlung (OTTB)

Spectral model: thermal bremsstrahlung
------------------------------------------------------------
Parameters  : value         Lower 90%    Upper 90%
kT [keV]    : 199.363       (-97.2764      -199.363)
Norm        : 0.445361       (-0.0815811     0.0815825)
------------------------------------------------------------
#Fit statistic : Chi-Squared =          54.23 using 59 PHA bins.
# Reduced chi-squared =         0.9514 for     57 degrees of freedom
# Null hypothesis probability =   5.796007e-01

Energy  Fluence     90% Error
[keV]   [erg/cm2]   [erg/cm2]
15- 25  7.669e-08   4.522e-08
25- 50  1.475e-07   8.426e-08
50-150  3.235e-07   1.834e-07
15-150  5.477e-07   3.126e-07
Double BB

Spectral model: bbodyrad<1> + bbodyrad<2>
------------------------------------------------------------
Parameters  : value         Lower 90%    Upper 90%
kT1 [keV]   : 5.00571        (-2.8427      -5.00926)
R1^2/D10^2  : 0.278442        (-0.262932      14.7107)
kT2 [keV]   : 19.5453        (-5.35464      -19.5473)
R2^2/D10^2  : 4.42222E-03    (-0.00438288   0.0100607)
------------------------------------------------------------
#Fit statistic : Chi-Squared =          53.62 using 59 PHA bins.
# Reduced chi-squared =         0.9750 for     55 degrees of freedom
# Null hypothesis probability =   5.273347e-01

Energy  Fluence     90% Error
[keV]   [erg/cm2]   [erg/cm2]
15- 25  6.977e-08   3.879e-08
25- 50  1.423e-07   7.396e-08
50-150  3.158e-07   1.863e-07
15-150  5.278e-07   2.867e-07
Peak spectrum fit
Power-law model
Time interval is from    3.884 sec. to    4.884 sec.

Spectral model in power-law:
------------------------------------------------------------
Parameters  : value       lower 90%   higher 90%
Photon index: 1.77574     ( -0.46145   0.50456 )
Norm@50keV  : 4.36814E-03    ( -0.00150359   0.00146456 )
------------------------------------------------------------
#Fit statistic : Chi-Squared =          67.09 using 59 PHA bins.
# Reduced chi-squared =          1.177 for     57 degrees of freedom
# Null hypothesis probability =   1.695447e-01

Photon flux (15-150 keV)    in 1 sec: 0.596354 ( -0.173606  0.173608 ) ph/cm2/s
Energy fluence (15-150 keV)             : 4.02447e-08 ( -1.36295e-08  1.44853e-08 ) ergs/cm2
Cutoff power-law model
Time interval is from    3.884 sec. to    4.884 sec.
Spectral model in the cutoff power-law:
------------------------------------------------------------
Parameters  : value       lower 90%   higher 90%
Photon index: -0.819383     ( -7.95979   2.56125 )
Epeak [keV] : 41.1191      ( -10.9831 87.1649 )
Norm@50keV  : 0.168939    ( -0.198267   23499.6 )
------------------------------------------------------------
#Fit statistic : Chi-Squared =          64.00 using 59 PHA bins.
# Reduced chi-squared =          1.143 for     56 degrees of freedom
# Null hypothesis probability =   2.161718e-01

Photon flux (15-150 keV)    in 1 sec: 0.559349 ( -0.170705  0.174316 ) ph/cm2/s
Energy fluence (15-150 keV)             : 3.10251e-08 ( -1.11707e-08  1.60239e-08 ) ergs/cm2
Band function

Time interval is from    3.884 sec. to    4.884 sec.

Spectral model in the Band function:
------------------------------------------------------------
Parameters  : value       lower 90%   higher 90%
alpha       : 3.71654   ( -2.69463   -0.997303 )
beta        : -2.97847    ( 9.37167   19.3708 )
Epeak [keV] : 34.5416      ( -10.8534 80.4113 )
Norm@50keV   : 15.7626    ( -15.7401   45.8011 )
------------------------------------------------------------
#Fit statistic : Chi-Squared =          63.06 using 59 PHA bins.
# Reduced chi-squared =          1.147 for     55 degrees of freedom
# Null hypothesis probability =   2.128442e-01

Photon flux (15-150 keV)    in 1 sec:  (    ) ph/cm2/s
Energy fluence (15-150 keV)             : 3.44732e-08 ( 0  0 ) ergs/cm2
Single BB
Spectral model blackbody:
------------------------------------------------------------
Parameters  : value    Lower 90%  Upper 90%
kT [keV]    : 10.1153  (-2.44712  3.49751)
R^2/D10^2   : 0.294918  (-0.200163   0.53412)
(R is the radius in km and D10 is the distance to the source in units of 10 kpc)
------------------------------------------------------------
#Fit statistic : Chi-Squared =          64.08 using 59 PHA bins.
# Reduced chi-squared =          1.124 for     57 degrees of freedom
# Null hypothesis probability =   2.420315e-01

Energy  Fluence     90% Error
[keV]   [erg/cm2]   [erg/cm2]
15- 25  6.169e-09   3.508e-09
25- 50  1.559e-08   9.530e-09
50-150  8.409e-09   6.137e-09
15-150  3.016e-08   1.864e-08
Thermal bremsstrahlung (OTTB)

Spectral model: thermal bremsstrahlung
------------------------------------------------------------
Parameters  : value         Lower 90%    Upper 90%
kT [keV]    : 82.8938       (-46.1074      -82.8819)
Norm        : 2.83878       (-0.92915     1.45432)
------------------------------------------------------------
#Fit statistic : Chi-Squared =          65.74 using 59 PHA bins.
# Reduced chi-squared =          1.153 for     57 degrees of freedom
# Null hypothesis probability =   1.998855e-01

Energy  Fluence     90% Error
[keV]   [erg/cm2]   [erg/cm2]
15- 25  7.382e-09   4.515e-09
25- 50  1.225e-08   7.500e-09
50-150  1.771e-08   1.496e-08
15-150  3.735e-08   2.559e-08
Double BB
------------------------------------------------------------
#Fit statistic : Chi-Squared =          63.63 using 59 PHA bins.
#Fit statistic : Chi-Squared =          63.57 using 59 PHA bins.
#Fit statistic : Chi-Squared =          63.55 using 59 PHA bins.
#Fit statistic : Chi-Squared =          63.54 using 59 PHA bins.
# Reduced chi-squared =          1.157 for     55 degrees of freedom
# Reduced chi-squared =          1.156 for     55 degrees of freedom
# Reduced chi-squared =          1.155 for     55 degrees of freedom
# Reduced chi-squared =          1.155 for     55 degrees of freedom
# Null hypothesis probability =   1.986629e-01
# Null hypothesis probability =   2.002837e-01
# Null hypothesis probability =   2.006025e-01
# Null hypothesis probability =   2.009078e-01

Energy  Fluence     90% Error
[keV]   [erg/cm2]   [erg/cm2]
15- 25  6.663e-09   5.865e-09
25- 50  1.470e-08   1.510e-08
50-150  1.266e-08   1.705e-08
15-150  3.402e-08   4.643e-08
Pre-slew spectrum (Pre-slew PHA with pre-slew DRM)
Power-law model

Spectral model in power-law:
------------------------------------------------------------
Parameters  : value       lower 90%   higher 90%
Photon index: 1.37295     ( -0.29983   0.299075 )
Norm@50keV  : 1.06882E-03    ( -0.000187054   0.000186085 )
------------------------------------------------------------
#Fit statistic : Chi-Squared =          40.66 using 59 PHA bins.
# Reduced chi-squared =         0.7133 for     57 degrees of freedom
# Null hypothesis probability =   9.498839e-01

Photon flux (15-150 keV)    in 55.28 sec: 0.129386 ( -0.022613  0.0226587 ) ph/cm2/s
Energy fluence (15-150 keV)             : 5.7416e-07 ( -1.11216e-07  1.13252e-07 ) ergs/cm2
Cutoff power-law model
Spectral model in the cutoff power-law:
------------------------------------------------------------
Parameters  : value       lower 90%   higher 90%
Photon index: 0.863021     ( -1.56373   0.775886 )
Epeak [keV] : 111.114      ( -111.114 -111.114 )
Norm@50keV  : 1.94043E-03    ( -0.00103681   0.00956822 )
------------------------------------------------------------
#Fit statistic : Chi-Squared =          40.14 using 59 PHA bins.
# Reduced chi-squared =         0.7167 for     56 degrees of freedom
# Null hypothesis probability =   9.457801e-01

Photon flux (15-150 keV)    in 55.28 sec: 0.126643 ( -0.023733  0.023551 ) ph/cm2/s
Energy fluence (15-150 keV)             : 5.50789e-07 ( -1.25192e-07  1.25324e-07 ) ergs/cm2
Band function
Spectral model in the Band function:
------------------------------------------------------------
Parameters  : value       lower 90%   higher 90%
alpha       : -0.644322   ( 0.630856   0.630856 )
beta        : -1.71093    ( 1.71264   0.60025 )
Epeak [keV] : 84.5541      ( -82.452 -82.452 )
Norm@50keV   : 2.62236E-03    ( -0.00282504   53.8241 )
------------------------------------------------------------
#Fit statistic : Chi-Squared =          40.00 using 59 PHA bins.
# Reduced chi-squared =         0.7273 for     55 degrees of freedom
# Null hypothesis probability =   9.357949e-01

Photon flux (15-150 keV)    in 55.28 sec:  (    ) ph/cm2/s
Energy fluence (15-150 keV)             : 0 ( 0  0 ) ergs/cm2
S(25-50 keV) vs. S(50-100 keV) plot

S(25-50 keV)  = 1.40e-07
S(50-100 keV) = 2.08e-07
T90 vs. Hardness ratio plot

T90                                   = 64.5079999864101 sec.
Hardness ratio (energy fluence ratio) = 1.48571
Color vs. Color plot
Count Ratio  (25-50 keV) / (15-25 keV) = 1.28875
Count Ratio (50-100 keV) / (15-25 keV) = 1.25656
Mask shadow pattern
IMX = 2.072424406940372E-01, IMY = 5.180804300206198E-01
TIME vs. PHA plot around the trigger time
Blue+Cyan dotted lines: Time interval of the scaled map
From 0.000000 to 8.192000
TIME vs. DetID plot around the trigger time

Blue+Cyan dotted lines: Time interval of the scaled map
From 0.000000 to 8.192000
100 us light curve (15-350 keV)
Blue+Cyan dotted lines: Time interval of the scaled map
From 0.000000 to 8.192000
Spacecraft aspect plot

Bright source in the pre-burst/pre-slew/post-slew images
Pre-burst image of 15-350 keV band
Time interval of the image:
-239.784000 -0.764000

# RAcent  DECcent POSerr Theta    Phi  PeakCts   SNR AngSep     Name
#  [deg]    [deg]    ['] [deg]  [deg]                   [']
149.6315  32.6804    2.7  11.1   78.1   0.7454   4.3 ------	UNKNOWN
125.6552  15.2709    2.4  22.2 -172.2   0.8125   4.9 ------	UNKNOWN
237.5247  77.4892    3.2  58.1   -6.6   3.7424   4.1 ------	UNKNOWN
237.7363  77.7405    3.5  58.0   -6.9   3.9758   4.3 ------	UNKNOWN
Pre-slew background subtracted image of 15-350 keV band
Time interval of the image:
-0.764000 54.516600

# RAcent  DECcent POSerr Theta    Phi  PeakCts   SNR AngSep     Name
#  [deg]    [deg]    ['] [deg]  [deg]                   [']
173.6700  18.0428    2.6  37.0   86.6   1.0559   4.4 ------	UNKNOWN
134.0828 -19.3465    2.7  54.6  161.8   1.8673   4.3 ------	UNKNOWN
189.0158  62.6614    2.4  42.2   11.6   0.6226   4.8 ------	UNKNOWN
121.1178 -14.6083    2.2  51.9  178.0   1.0905   5.1 ------	UNKNOWN
102.2785  50.7460    1.2  29.2  -68.2   0.9923   9.3 ------	UNKNOWN
354.8515  85.8788    2.8  58.1  -24.2   1.8782   4.1 ------	UNKNOWN
Post-slew image of 15-350 keV band
Time interval of the image:
109.116590 917.316600

# RAcent  DECcent POSerr Theta    Phi  PeakCts   SNR AngSep     Name
#  [deg]    [deg]    ['] [deg]  [deg]                   [']
 83.6239  22.0145    0.2  32.2 -123.8  33.6420  49.3    0.5	Crab
121.6043  -3.7240    4.5  56.9  179.2   7.6114   2.6 ------	UNKNOWN
340.2034  66.7391    3.7  54.6   -1.8   4.6975   3.1 ------	UNKNOWN
 13.4787  55.6433    2.8  49.7  -25.2   4.2904   4.2 ------	UNKNOWN
Plot creation:
Sun May 31 07:34:32 EDT 2015