Click here for the BAT GCN circular template
Image
Pre-slew 15.0-350.0 keV image (Event data)
#   RAcent    DECcent   POSerr    Theta     Phi              Peak Cts       SNR   Name
   19.1739    -9.2379   0.0133    51.2871    -0.8423         2.7714487     14.545 TRIG_00312958

Foreground time interval of the image:
-11.488  29.589 (delta_t =  41.077 [sec])
Background time interval of the image:
-280.411 -11.488 (delta_t = 268.923 [sec])
Lightcurves
Notes:
- 1) The mask-weighted light curves are using the flight position.
- 2) Multiple plots of different time binning/intervals are shown to cover all scenarios of short/long GRBs, rate/image triggers, and real/false positives.
- 3) For all the mask-weighted lightcurves, the y-axis units are counts/sec/det where a det is 0.4 x 0.4 = 0.16 sq cm.
- 4) The verticle lines correspond to following: green dotted lines are T50 interval, black dotted lines are T90 interval, blue solid line(s) is a spacecraft slew start time, and orange solid line(s) is a spacecraft slew end time.
- 5) Time of each bin is in the middle of the bin.
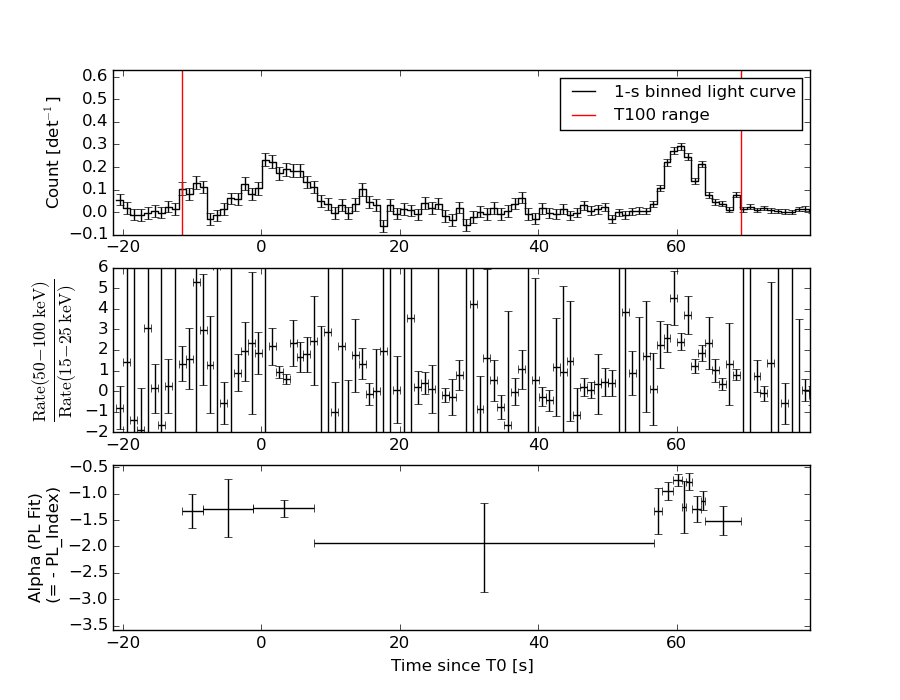
1 s binning
From T0-310 s to T0+310 s
From T100_start - 20 s to T100_end + 30 s

Full time interval
64 ms binning
Full time interval
From T100_start to T100_end
From T0-5 sec to T0+5 sec
16 ms binning
From T100_start-5 s to T100_start+5 s
Blue+Cyan dotted lines: Time interval of the scaled map
From 0.000000 to 2.048000
8 ms binning
From T100_start-3 s to T100_start+3 s
Blue+Cyan dotted lines: Time interval of the scaled map
From 0.000000 to 2.048000
2 ms binning
From T100_start-1 s to T100_start+1 s

Blue+Cyan dotted lines: Time interval of the scaled map
From 0.000000 to 2.048000
SN=5 or 10 sec. binning (whichever binning is satisfied first)
SN=5 or 10 sec. binning (T < 200 sec)
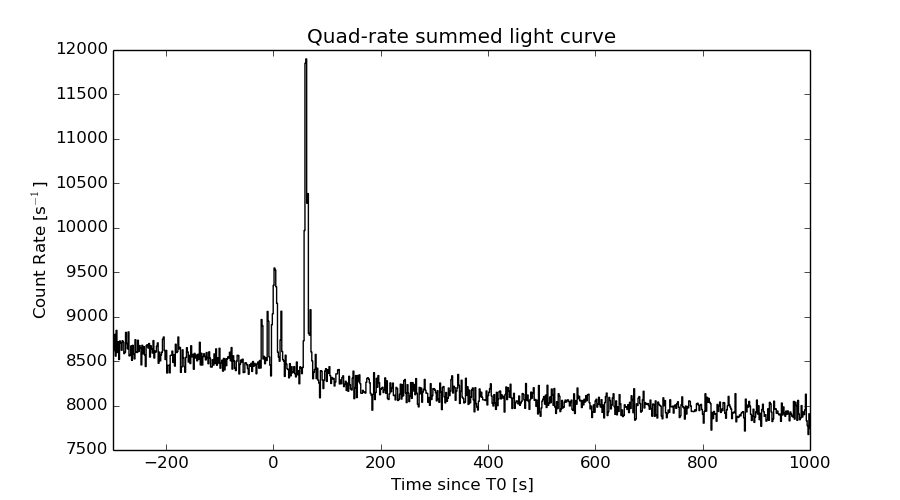
Quad-rate summed light curves (from T0-300s to T0+1000s)
Spectral Evolution
Spectra
Notes:
- 1) The fitting includes the systematic errors.
- 2) When the burst includes telescope slew time periods, the fitting uses an average response file made from multiple 5-s response files through out the slew time plus single time preiod for the non-slew times, and weighted by the total counts in the corresponding time period using addrmf. An average response file is needed becuase a spectral fit using the pre-slew DRM will introduce some errors in both a spectral shape and a normalization if the PHA file contains a lot of the slew/post-slew time interval.
- 3) For fits to more complicated models (e.g. a power-law over a cutoff power-law), the BAT team has decided to require a chi-square improvement of more than 6 for each extra dof.
Time averaged spectrum fit using the average DRM
Power-law model

Time interval is from  -11.488 sec. to   69.244 sec.

Spectral model in power-law:
------------------------------------------------------------
Parameters  : value       lower 90%   higher 90%
Photon index: 1.27732     ( -0.126987   0.126004 )
Norm@50keV  : 4.05925E-03    ( -0.000292525   0.000292455 )
------------------------------------------------------------
#Fit statistic : Chi-Squared =          58.36 using 59 PHA bins.
# Reduced chi-squared =          1.024 for     57 degrees of freedom
# Null hypothesis probability =   4.252667e-01

Photon flux (15-150 keV)    in 80.73 sec: 0.482316 ( -0.0366921  0.0367995 ) ph/cm2/s
Energy fluence (15-150 keV)             : 3.2566e-06 ( -2.52184e-07  2.53089e-07 ) ergs/cm2
Cutoff power-law model
Time interval is from  -11.488 sec. to   69.244 sec.
Spectral model in the cutoff power-law:
------------------------------------------------------------
Parameters  : value       lower 90%   higher 90%
Photon index: 0.844447     ( -0.556998   0.475937 )
Epeak [keV] : 149.464      ( -54.7415 -149.464 )
Norm@50keV  : 6.39394E-03    ( -0.00243873   0.0048207 )
------------------------------------------------------------
#Fit statistic : Chi-Squared =          56.12 using 59 PHA bins.
# Reduced chi-squared =          1.002 for     56 degrees of freedom
# Null hypothesis probability =   4.705032e-01

Photon flux (15-150 keV)    in 80.73 sec: 0.471987 ( -0.038518  0.038559 ) ph/cm2/s
Energy fluence (15-150 keV)             : 3.18925e-06 ( -2.68589e-07  2.6699e-07 ) ergs/cm2
Band function

Time interval is from  -11.488 sec. to   69.244 sec.

Spectral model in the Band function:
------------------------------------------------------------
Parameters  : value       lower 90%   higher 90%
alpha       : -0.844408   ( -0.181372   0.741835 )
beta        : -10.0000    ( 10   0 )
Epeak [keV] : 149.435      ( -74.117 468.917 )
Norm@50keV   : 6.39379E-03    ( -0.00244574   0.00482225 )
------------------------------------------------------------
#Fit statistic : Chi-Squared =          56.12 using 59 PHA bins.
# Reduced chi-squared =          1.020 for     55 degrees of freedom
# Null hypothesis probability =   4.328073e-01

Photon flux (15-150 keV)    in 80.73 sec:  (    ) ph/cm2/s
Energy fluence (15-150 keV)             : 0 ( 0  0 ) ergs/cm2
Single BB
Spectral model blackbody:
------------------------------------------------------------
Parameters  : value    Lower 90%  Upper 90%
kT [keV]    : 18.9420  (-1.68868  1.90769)
R^2/D10^2   : 2.60631E-02  (-0.00720414   0.00969036)
(R is the radius in km and D10 is the distance to the source in units of 10 kpc)
------------------------------------------------------------
#Fit statistic : Chi-Squared =          86.38 using 59 PHA bins.
# Reduced chi-squared =          1.515 for     57 degrees of freedom
# Null hypothesis probability =   7.258410e-03

Energy  Fluence     90% Error
[keV]   [erg/cm2]   [erg/cm2]
15- 25  1.486e-07   2.309e-08
25- 50  7.130e-07   7.944e-08
50-150  1.879e-06   2.365e-07
15-150  2.740e-06   2.414e-07
Thermal bremsstrahlung (OTTB)

Spectral model: thermal bremsstrahlung
------------------------------------------------------------
Parameters  : value         Lower 90%    Upper 90%
kT [keV]    : 200.000       (      )
Norm        : 2.02849       (-0.147889     0.147863)
------------------------------------------------------------
#Fit statistic : Chi-Squared =          70.99 using 59 PHA bins.
# Reduced chi-squared =          1.245 for     57 degrees of freedom
# Null hypothesis probability =   1.007329e-01

Energy  Fluence     90% Error
[keV]   [erg/cm2]   [erg/cm2]
15- 25  4.079e-07   3.605e-08
25- 50  7.847e-07   1.022e-07
50-150  1.721e-06   4.622e-07
15-150  2.913e-06   7.149e-07
Double BB
Spectral model: bbodyrad<1> + bbodyrad<2>
------------------------------------------------------------
Parameters  : value         Lower 90%    Upper 90%
kT1 [keV]   : 7.53529        (-2.63053      3.18719)
R1^2/D10^2  : 0.298461        (-0.190907      0.606799)
kT2 [keV]   : 27.9037        (-5.55417      12.3666)
R2^2/D10^2  : 5.99195E-03    (-0.0042951   0.00752225)
------------------------------------------------------------
#Fit statistic : Chi-Squared =          57.02 using 59 PHA bins.
# Reduced chi-squared =          1.037 for     55 degrees of freedom
# Null hypothesis probability =   3.997539e-01

Energy  Fluence     90% Error
[keV]   [erg/cm2]   [erg/cm2]
15- 25  2.973e-07   1.268e-07
25- 50  7.389e-07   2.520e-07
50-150  2.154e-06   8.708e-07
15-150  3.190e-06   1.018e-06
Peak spectrum fit
Power-law model
Time interval is from   59.596 sec. to   60.596 sec.

Spectral model in power-law:
------------------------------------------------------------
Parameters  : value       lower 90%   higher 90%
Photon index: 0.700165     ( -0.134205   0.12927 )
Norm@50keV  : 2.36289E-02    ( -0.00189881   0.00187873 )
------------------------------------------------------------
#Fit statistic : Chi-Squared =          72.47 using 59 PHA bins.
# Reduced chi-squared =          1.271 for     57 degrees of freedom
# Null hypothesis probability =   8.126769e-02

Photon flux (15-150 keV)    in 1 sec: 2.73125 ( -0.208438  0.208855 ) ph/cm2/s
Energy fluence (15-150 keV)             : 2.88395e-07 ( -2.25847e-08  2.26604e-08 ) ergs/cm2
Cutoff power-law model
Time interval is from   59.596 sec. to   60.596 sec.
Spectral model in the cutoff power-law:
------------------------------------------------------------
Parameters  : value       lower 90%   higher 90%
Photon index: 0.135262     ( -0.608663   0.525537 )
Epeak [keV] : 201.336      ( -73.5645 1316.9 )
Norm@50keV  : 4.06863E-02    ( -0.0157157   0.0302213 )
------------------------------------------------------------
#Fit statistic : Chi-Squared =          69.10 using 59 PHA bins.
# Reduced chi-squared =          1.234 for     56 degrees of freedom
# Null hypothesis probability =   1.122168e-01

Photon flux (15-150 keV)    in 1 sec: 2.68391 ( -0.21292  0.21325 ) ph/cm2/s
Energy fluence (15-150 keV)             : 2.82946e-07 ( -2.4025e-08  2.3744e-08 ) ergs/cm2
Band function

Time interval is from   59.596 sec. to   60.596 sec.

Spectral model in the Band function:
------------------------------------------------------------
Parameters  : value       lower 90%   higher 90%
alpha       : 5.00000   ( -5   -5 )
beta        : -0.702475    ( -0.129268   0.134491 )
Epeak [keV] : 18.5969      ( -17.7129 -17.7129 )
Norm@50keV   : 6419.68    ( -469.886   5.23971e+06 )
------------------------------------------------------------
#Fit statistic : Chi-Squared =          72.40 using 59 PHA bins.
# Reduced chi-squared =          1.316 for     55 degrees of freedom
# Null hypothesis probability =   5.789469e-02

Photon flux (15-150 keV)    in 1 sec:  (    ) ph/cm2/s
Energy fluence (15-150 keV)             : 0 ( 0  0 ) ergs/cm2
Single BB
Spectral model blackbody:
------------------------------------------------------------
Parameters  : value    Lower 90%  Upper 90%
kT [keV]    : 26.7240  (-2.73097  3.26539)
R^2/D10^2   : 5.88075E-02  (-0.0167428   0.0221471)
(R is the radius in km and D10 is the distance to the source in units of 10 kpc)
------------------------------------------------------------
#Fit statistic : Chi-Squared =          82.37 using 59 PHA bins.
# Reduced chi-squared =          1.445 for     57 degrees of freedom
# Null hypothesis probability =   1.561824e-02

Energy  Fluence     90% Error
[keV]   [erg/cm2]   [erg/cm2]
15- 25  7.035e-09   1.064e-09
25- 50  4.124e-08   4.730e-09
50-150  2.157e-07   2.550e-08
15-150  2.639e-07   2.400e-08
Thermal bremsstrahlung (OTTB)
Spectral model: thermal bremsstrahlung
------------------------------------------------------------
Parameters  : value         Lower 90%    Upper 90%
kT [keV]    : 199.363       (      )
Norm        : 10.3997       (     )
------------------------------------------------------------
#Fit statistic : Chi-Squared =         183.39 using 59 PHA bins.
# Reduced chi-squared =         3.2173 for     57 degrees of freedom
# Null hypothesis probability =   3.435843e-15

Energy  Fluence     90% Error
[keV]   [erg/cm2]   [erg/cm2]
15- 25  2.590e-08   3.065e-09
25- 50  4.981e-08   9.515e-09
50-150  1.093e-07   5.064e-08
15-150  1.850e-07   8.363e-08
Double BB

------------------------------------------------------------
Parameters  : value         Lower 90%    Upper 90%
kT1 [keV]   : 13.6563        (-4.30066      5.60508)
R1^2/D10^2  : 0.236891        (-0.129909      0.361616)
kT2 [keV]   : 56.0957        (-42.7543      -55.2335)
R2^2/D10^2  : 5.84154E-03    (   )
------------------------------------------------------------
#Fit statistic : Chi-Squared =          66.38 using 59 PHA bins.
#Fit statistic : Chi-Squared =          66.36 using 59 PHA bins.
# Reduced chi-squared =          1.207 for     55 degrees of freedom
# Reduced chi-squared =          1.206 for     55 degrees of freedom
# Null hypothesis probability =   1.399104e-01
# Null hypothesis probability =   1.403624e-01

Energy  Fluence     90% Error
[keV]   [erg/cm2]   [erg/cm2]
15- 25  1.129e-08   5.823e-09
25- 50  4.737e-08   2.238e-08
50-150  2.258e-07   1.137e-07
15-150  2.845e-07   1.420e-07
Pre-slew spectrum (Pre-slew PHA with pre-slew DRM)
Power-law model

Spectral model in power-law:
------------------------------------------------------------
Parameters  : value       lower 90%   higher 90%
Photon index: 1.35635     ( -0.17661   0.17626 )
Norm@50keV  : 4.70761E-03    ( -0.000479037   0.000478993 )
------------------------------------------------------------
#Fit statistic : Chi-Squared =          59.55 using 59 PHA bins.
# Reduced chi-squared =          1.045 for     57 degrees of freedom
# Null hypothesis probability =   3.830944e-01

Photon flux (15-150 keV)    in 41.08 sec: 0.567880 ( -0.0616567  0.0619854 ) ph/cm2/s
Energy fluence (15-150 keV)             : 1.8861e-06 ( -2.03517e-07  2.04299e-07 ) ergs/cm2
Cutoff power-law model

Spectral model in the cutoff power-law:
------------------------------------------------------------
Parameters  : value       lower 90%   higher 90%
Photon index: 0.655265     ( -0.911496   0.746678 )
Epeak [keV] : 110.058      ( -33.2416 -110.056 )
Norm@50keV  : 9.63616E-03    ( -0.0038871   0.0137868 )
------------------------------------------------------------
#Fit statistic : Chi-Squared =          57.04 using 59 PHA bins.
# Reduced chi-squared =          1.019 for     56 degrees of freedom
# Null hypothesis probability =   4.362605e-01

Photon flux (15-150 keV)    in 41.08 sec: 0.546719 ( -0.06578  0.065933 ) ph/cm2/s
Energy fluence (15-150 keV)             : 1.83645e-06 ( -2.14865e-07  2.13743e-07 ) ergs/cm2
Band function
Spectral model in the Band function:
------------------------------------------------------------
Parameters  : value       lower 90%   higher 90%
alpha       : -0.656492   ( -0.632316   0.991501 )
beta        : -10.0000    ( 10   1.77636e-15 )
Epeak [keV] : 110.110      ( -33.3183 170.559 )
Norm@50keV   : 9.62568E-03    ( -0.00503731   0.0138243 )
------------------------------------------------------------
#Fit statistic : Chi-Squared =          57.04 using 59 PHA bins.
# Reduced chi-squared =          1.037 for     55 degrees of freedom
# Null hypothesis probability =   3.991944e-01

Photon flux (15-150 keV)    in 41.08 sec: 0.556750 (    ) ph/cm2/s
Energy fluence (15-150 keV)             : 0 ( 0  0 ) ergs/cm2
S(25-50 keV) vs. S(50-100 keV) plot
S(25-50 keV)  = 7.16e-07
S(50-100 keV) = 1.18e-06
T90 vs. Hardness ratio plot
T90                                   = 74.2880000174046 sec.
Hardness ratio (energy fluence ratio) = 1.64804
Color vs. Color plot
Count Ratio  (25-50 keV) / (15-25 keV) = 1.63791
Count Ratio (50-100 keV) / (15-25 keV) = 1.68707
Mask shadow pattern
IMX = 1.247494626952796E+00, IMY = 1.833962613966093E-02
TIME vs. PHA plot around the trigger time
Blue+Cyan dotted lines: Time interval of the scaled map
From 0.000000 to 2.048000
TIME vs. DetID plot around the trigger time
Blue+Cyan dotted lines: Time interval of the scaled map
From 0.000000 to 2.048000
100 us light curve (15-350 keV)

Blue+Cyan dotted lines: Time interval of the scaled map
From 0.000000 to 2.048000
Spacecraft aspect plot
Bright source in the pre-burst/pre-slew/post-slew images
Pre-burst image of 15-350 keV band
Time interval of the image:
-280.411400 -11.488000

# RAcent  DECcent POSerr Theta    Phi  PeakCts   SNR AngSep     Name
#  [deg]    [deg]    ['] [deg]  [deg]                   [']
326.3740  38.2981    5.8  34.3  108.7   0.8660   2.0    9.6	Cyg X-2
 12.4578   8.0656    2.2  33.5    7.1   1.2156   5.2 ------	UNKNOWN
 38.5410  -6.7742    2.4  54.3  -24.9   3.2234   4.8 ------	UNKNOWN
 40.2756  -0.0737    2.3  49.1  -30.7   2.3824   4.9 ------	UNKNOWN
Pre-slew background subtracted image of 15-350 keV band
Time interval of the image:
-11.488000 29.588600

# RAcent  DECcent POSerr Theta    Phi  PeakCts   SNR AngSep     Name
#  [deg]    [deg]    ['] [deg]  [deg]                   [']
326.1098  38.2747   11.2  34.5  108.8  -0.1548  -1.0    4.1	Cyg X-2
231.7057  78.5165    1.9  57.6 -179.8   2.5613   6.1 ------	UNKNOWN
 19.1739  -9.2379    0.8  51.3   -0.8   2.7717  14.5 ------	UNKNOWN
 85.7396  85.9484    2.4  47.5 -165.8   0.5946   4.8 ------	UNKNOWN
Post-slew image of 15-350 keV band
Time interval of the image:
100.588610 962.161900

# RAcent  DECcent POSerr Theta    Phi  PeakCts   SNR AngSep     Name
#  [deg]    [deg]    ['] [deg]  [deg]                   [']
  0.0561 -42.4540    2.9  37.2   56.7   3.8860   3.9 ------	UNKNOWN
 28.8173 -30.1185    2.9  22.7   11.1   1.6516   3.9 ------	UNKNOWN
347.0243  35.5001    2.9  54.1 -179.3   6.1157   4.0 ------	UNKNOWN
Plot creation:
Sun May 31 07:24:05 EDT 2015