Click here for the BAT GCN circular template
Image
Pre-slew 15.0-350.0 keV image (Event data)

#   RAcent    DECcent   POSerr    Theta     Phi              Peak Cts       SNR   Name
  176.5514    68.0620   0.0042    17.2204    -6.5766         2.0334852     45.977 TRIG_00313087

Foreground time interval of the image:
 -0.116  10.173 (delta_t =  10.289 [sec])
Background time interval of the image:
-30.227  -0.116 (delta_t =  30.111 [sec])
Lightcurves
Notes:
- 1) The mask-weighted light curves are using the flight position.
- 2) Multiple plots of different time binning/intervals are shown to cover all scenarios of short/long GRBs, rate/image triggers, and real/false positives.
- 3) For all the mask-weighted lightcurves, the y-axis units are counts/sec/det where a det is 0.4 x 0.4 = 0.16 sq cm.
- 4) The verticle lines correspond to following: green dotted lines are T50 interval, black dotted lines are T90 interval, blue solid line(s) is a spacecraft slew start time, and orange solid line(s) is a spacecraft slew end time.
- 5) Time of each bin is in the middle of the bin.
1 s binning
From T0-310 s to T0+310 s

From T100_start - 20 s to T100_end + 30 s

Full time interval

64 ms binning
Full time interval

From T100_start to T100_end

From T0-5 sec to T0+5 sec

16 ms binning
From T100_start-5 s to T100_start+5 s

Blue+Cyan dotted lines: Time interval of the scaled map
From 0.000000 to 0.512000
8 ms binning
From T100_start-3 s to T100_start+3 s
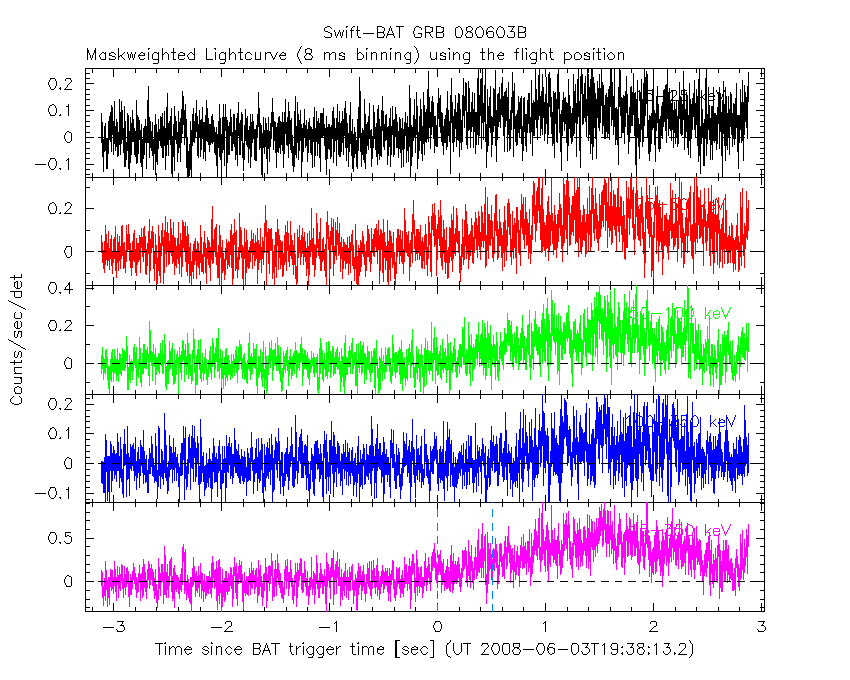
Blue+Cyan dotted lines: Time interval of the scaled map
From 0.000000 to 0.512000
2 ms binning
From T100_start-1 s to T100_start+1 s

Blue+Cyan dotted lines: Time interval of the scaled map
From 0.000000 to 0.512000
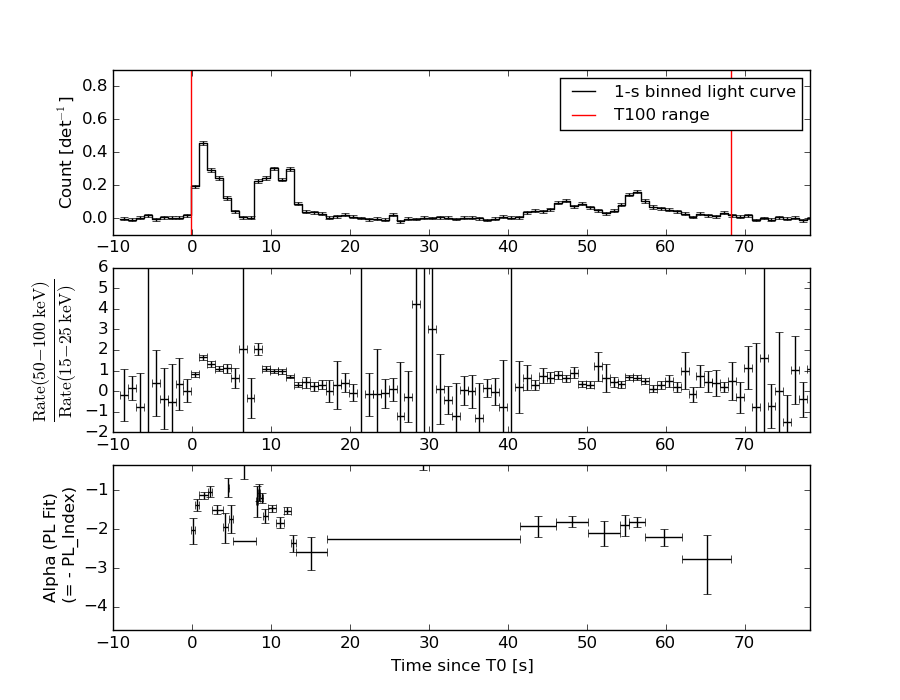
SN=5 or 10 sec. binning (whichever binning is satisfied first)

SN=5 or 10 sec. binning (T < 200 sec)

Quad-rate summed light curves (from T0-300s to T0+1000s)

Spectral Evolution
Spectra
Notes:
- 1) The fitting includes the systematic errors.
- 2) When the burst includes telescope slew time periods, the fitting uses an average response file made from multiple 5-s response files through out the slew time plus single time preiod for the non-slew times, and weighted by the total counts in the corresponding time period using addrmf. An average response file is needed becuase a spectral fit using the pre-slew DRM will introduce some errors in both a spectral shape and a normalization if the PHA file contains a lot of the slew/post-slew time interval.
- 3) For fits to more complicated models (e.g. a power-law over a cutoff power-law), the BAT team has decided to require a chi-square improvement of more than 6 for each extra dof.
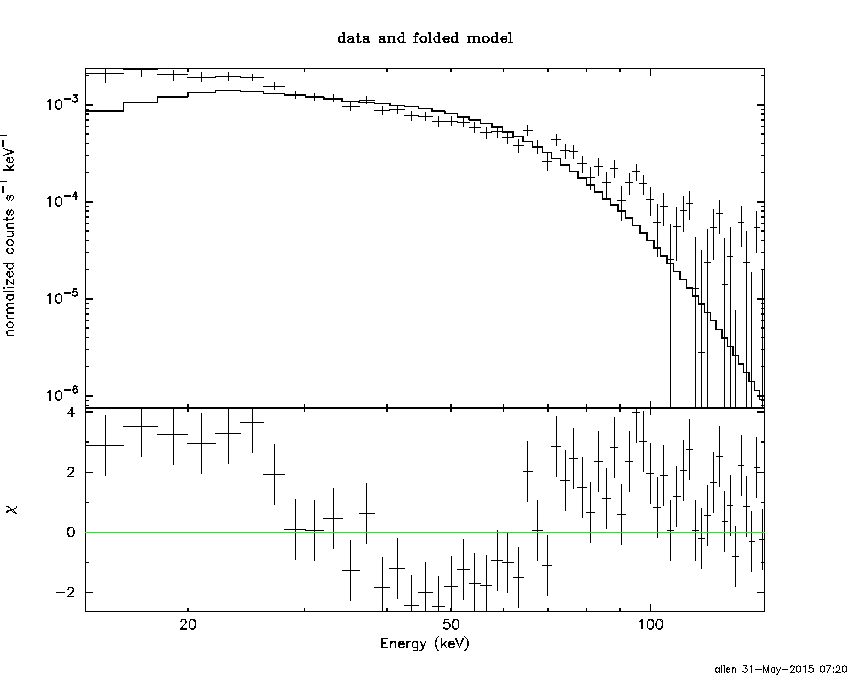
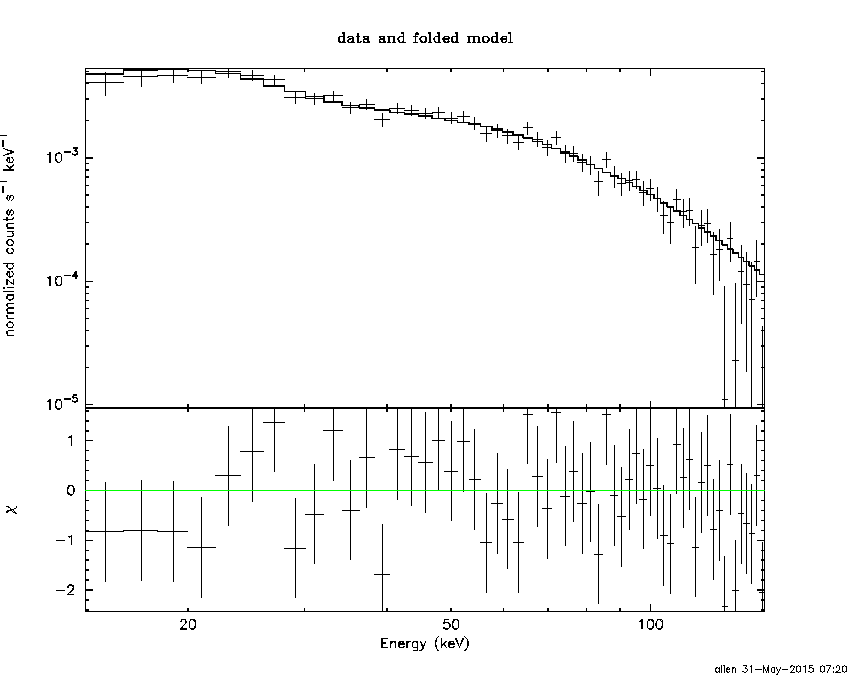
Time averaged spectrum fit using the average DRM
Power-law model

Time interval is from   -0.116 sec. to   68.256 sec.

Spectral model in power-law:
------------------------------------------------------------
Parameters  : value       lower 90%   higher 90%
Photon index: 1.73124     ( -0.0606951   0.0611324 )
Norm@50keV  : 4.09093E-03    ( -0.00013497   0.000134618 )
------------------------------------------------------------
#Fit statistic : Chi-Squared =          68.74 using 59 PHA bins.
# Reduced chi-squared =          1.206 for     57 degrees of freedom
# Null hypothesis probability =   1.370554e-01

Photon flux (15-150 keV)    in 68.37 sec: 0.549398 ( -0.0184602  0.0184857 ) ph/cm2/s
Energy fluence (15-150 keV)             : 2.58384e-06 ( -8.86226e-08  8.89391e-08 ) ergs/cm2
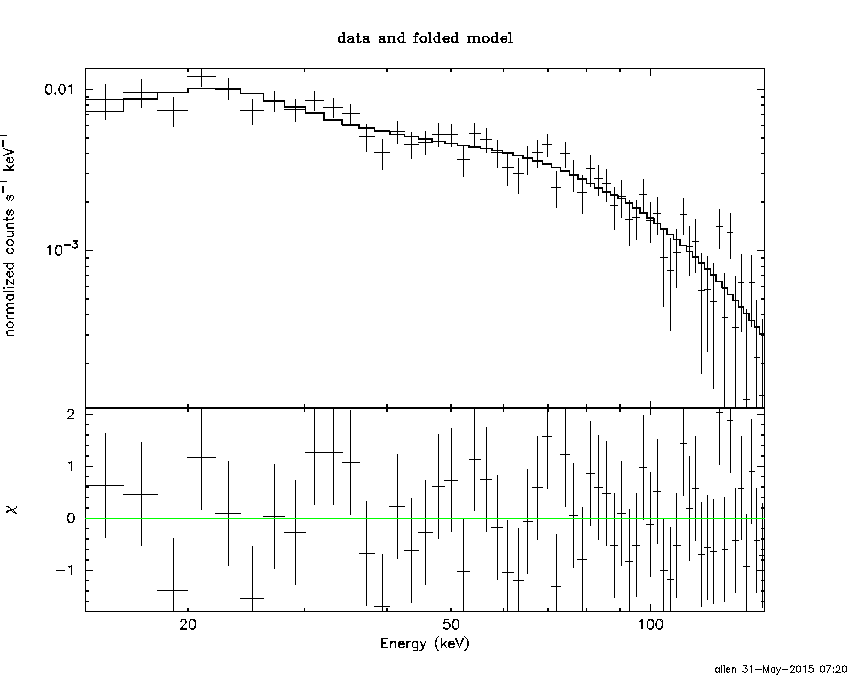
Cutoff power-law model

Time interval is from   -0.116 sec. to   68.256 sec.
Spectral model in the cutoff power-law:
------------------------------------------------------------
Parameters  : value       lower 90%   higher 90%
Photon index: 1.21047     ( -0.271762   0.256181 )
Epeak [keV] : 74.9413      ( -10.8568 25.7813 )
Norm@50keV  : 7.43717E-03    ( -0.00185624   0.00266603 )
------------------------------------------------------------
#Fit statistic : Chi-Squared =          56.01 using 59 PHA bins.
# Reduced chi-squared =          1.000 for     56 degrees of freedom
# Null hypothesis probability =   4.746309e-01

Photon flux (15-150 keV)    in 68.37 sec: 0.528614 ( -0.020693  0.020768 ) ph/cm2/s
Energy fluence (15-150 keV)             : 2.46518e-06 ( -1.05051e-07  1.05283e-07 ) ergs/cm2
Band function

Time interval is from   -0.116 sec. to   68.256 sec.

Spectral model in the Band function:
------------------------------------------------------------
Parameters  : value       lower 90%   higher 90%
alpha       : -1.21044   ( -0.219203   0.287238 )
beta        : -10.0000    ( 10   5.32907e-15 )
Epeak [keV] : 74.9269      ( -8.81406 25.7757 )
Norm@50keV   : 7.43656E-03    ( -0.00185678   0.00266583 )
------------------------------------------------------------
#Fit statistic : Chi-Squared =          56.01 using 59 PHA bins.
# Reduced chi-squared =          1.018 for     55 degrees of freedom
# Null hypothesis probability =   4.368843e-01

Photon flux (15-150 keV)    in 68.37 sec: 0.530286 (    ) ph/cm2/s
Energy fluence (15-150 keV)             : 2.46367e-06 ( 0  0 ) ergs/cm2
Single BB
Spectral model blackbody:
------------------------------------------------------------
Parameters  : value    Lower 90%  Upper 90%
kT [keV]    : 13.4571  (  )
R^2/D10^2   : 8.39759E-02  (   )
(R is the radius in km and D10 is the distance to the source in units of 10 kpc)
------------------------------------------------------------
#Fit statistic : Chi-Squared =         219.83 using 59 PHA bins.
# Reduced chi-squared =         3.8567 for     57 degrees of freedom
# Null hypothesis probability =   5.730317e-21

Energy  Fluence     90% Error
[keV]   [erg/cm2]   [erg/cm2]
15- 25  2.203e-07   1.436e-08
25- 50  7.869e-07   3.042e-08
50-150  9.188e-07   6.700e-08
15-150  1.926e-06   6.803e-08
Thermal bremsstrahlung (OTTB)

Spectral model: thermal bremsstrahlung
------------------------------------------------------------
Parameters  : value         Lower 90%    Upper 90%
kT [keV]    : 127.270       (-18.075      20.0212)
Norm        : 2.27806       (-0.0945613     0.113239)
------------------------------------------------------------
#Fit statistic : Chi-Squared =          56.29 using 59 PHA bins.
# Reduced chi-squared =         0.9875 for     57 degrees of freedom
# Null hypothesis probability =   5.017692e-01

Energy  Fluence     90% Error
[keV]   [erg/cm2]   [erg/cm2]
15- 25  4.046e-07   2.530e-08
25- 50  7.310e-07   3.678e-08
50-150  1.342e-06   3.224e-07
15-150  2.478e-06   3.466e-07
Double BB

Spectral model: bbodyrad<1> + bbodyrad<2>
------------------------------------------------------------
Parameters  : value         Lower 90%    Upper 90%
kT1 [keV]   : 6.78685        (-0.835082      0.880219)
R1^2/D10^2  : 0.634761        (-0.211738      0.374291)
kT2 [keV]   : 22.1668        (-2.32788      3.14315)
R2^2/D10^2  : 1.03459E-02    (-0.00423419   0.00589542)
------------------------------------------------------------
#Fit statistic : Chi-Squared =          58.21 using 59 PHA bins.
# Reduced chi-squared =          1.058 for     55 degrees of freedom
# Null hypothesis probability =   3.579166e-01

Energy  Fluence     90% Error
[keV]   [erg/cm2]   [erg/cm2]
15- 25  3.747e-07   4.468e-08
25- 50  7.409e-07   5.887e-08
50-150  1.309e-06   1.730e-07
15-150  2.425e-06   1.908e-07
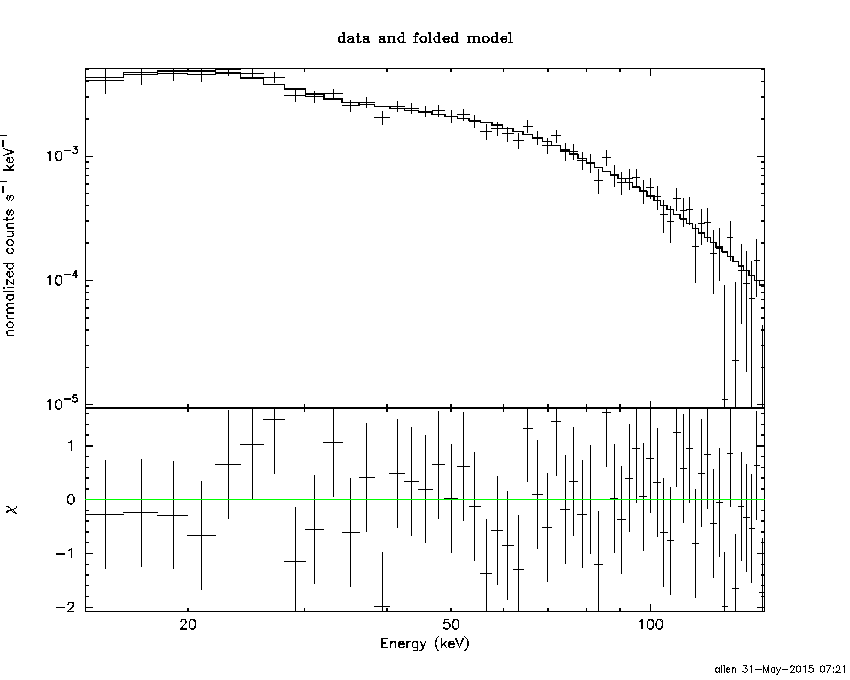
Peak spectrum fit
Power-law model

Time interval is from    0.960 sec. to    1.960 sec.

Spectral model in power-law:
------------------------------------------------------------
Parameters  : value       lower 90%   higher 90%
Photon index: 1.09790     ( -0.0872389   0.0867618 )
Norm@50keV  : 3.04496E-02    ( -0.00142846   0.00142832 )
------------------------------------------------------------
#Fit statistic : Chi-Squared =          51.93 using 59 PHA bins.
# Reduced chi-squared =         0.9111 for     57 degrees of freedom
# Null hypothesis probability =   6.650848e-01

Photon flux (15-150 keV)    in 1 sec: 3.53122 ( -0.169087  0.169261 ) ph/cm2/s
Energy fluence (15-150 keV)             : 3.18572e-07 ( -1.709e-08  1.71651e-08 ) ergs/cm2
Cutoff power-law model

Time interval is from    0.960 sec. to    1.960 sec.
Spectral model in the cutoff power-law:
------------------------------------------------------------
Parameters  : value       lower 90%   higher 90%
Photon index: 1.09407     ( -0.0888594   0.0864731 )
Epeak [keV] : 9999.33      ( -9999.36 -9999.36 )
Norm@50keV  : 3.05527E-02    ( -0.00143533   0.00143543 )
------------------------------------------------------------
#Fit statistic : Chi-Squared =          51.95 using 59 PHA bins.
# Reduced chi-squared =         0.9277 for     56 degrees of freedom
# Null hypothesis probability =   6.287743e-01

Photon flux (15-150 keV)    in 1 sec: 3.53117 ( -0.16888  0.16805 ) ph/cm2/s
Energy fluence (15-150 keV)             : 3.18442e-07 ( -8.644e-09  1.7241e-08 ) ergs/cm2
Band function

Time interval is from    0.960 sec. to    1.960 sec.

Spectral model in the Band function:
------------------------------------------------------------
Parameters  : value       lower 90%   higher 90%
alpha       : -0.732693   ( 0.732384   5.72957 )
beta        : -1.11486    ( 1.11527   0.101266 )
Epeak [keV] : 106.755      ( -99.0449 838.012 )
Norm@50keV   : 5.31094E-02    ( -0.02798   0 )
------------------------------------------------------------
#Fit statistic : Chi-Squared =          51.73 using 59 PHA bins.
# Reduced chi-squared =         0.9406 for     55 degrees of freedom
# Null hypothesis probability =   6.002548e-01

Photon flux (15-150 keV)    in 1 sec:  (    ) ph/cm2/s
Energy fluence (15-150 keV)             : 0 ( 0  0 ) ergs/cm2
Single BB

Spectral model blackbody:
------------------------------------------------------------
Parameters  : value    Lower 90%  Upper 90%
kT [keV]    : 20.7211  (  )
R^2/D10^2   : 0.145746  (   )
(R is the radius in km and D10 is the distance to the source in units of 10 kpc)
------------------------------------------------------------
#Fit statistic : Chi-Squared =         155.69 using 59 PHA bins.
# Reduced chi-squared =         2.7315 for     57 degrees of freedom
# Null hypothesis probability =   4.233607e-11

Energy  Fluence     90% Error
[keV]   [erg/cm2]   [erg/cm2]
15- 25  1.189e-08   1.165e-09
25- 50  6.060e-08   4.325e-09
50-150  1.937e-07   1.715e-08
15-150  2.662e-07   1.665e-08
Thermal bremsstrahlung (OTTB)

Spectral model: thermal bremsstrahlung
------------------------------------------------------------
Parameters  : value         Lower 90%    Upper 90%
kT [keV]    : 199.363       (      )
Norm        : 14.3341       (     )
------------------------------------------------------------
#Fit statistic : Chi-Squared =         126.97 using 59 PHA bins.
# Reduced chi-squared =         2.2275 for     57 degrees of freedom
# Null hypothesis probability =   3.034397e-07

Energy  Fluence     90% Error
[keV]   [erg/cm2]   [erg/cm2]
15- 25  3.569e-08   1.900e-09
25- 50  6.866e-08   3.630e-09
50-150  1.506e-07   2.660e-08
15-150  2.549e-07   1.610e-08
Double BB
Spectral model: bbodyrad<1> + bbodyrad<2>
------------------------------------------------------------
Parameters  : value         Lower 90%    Upper 90%
kT1 [keV]   : 7.66108        (-1.15978      1.34289)
R1^2/D10^2  : 2.16494        (-0.871079      1.59884)
kT2 [keV]   : 35.7112        (-5.24835      8.23536)
R2^2/D10^2  : 2.33880E-02    (-0.0106122   0.0148282)
------------------------------------------------------------
#Fit statistic : Chi-Squared =          48.60 using 59 PHA bins.
# Reduced chi-squared =         0.8837 for     55 degrees of freedom
# Null hypothesis probability =   7.160103e-01

Energy  Fluence     90% Error
[keV]   [erg/cm2]   [erg/cm2]
15- 25  2.637e-08   5.210e-09
25- 50  6.343e-08   1.035e-08
50-150  2.343e-07   3.745e-08
15-150  3.241e-07   5.145e-08
Pre-slew spectrum (Pre-slew PHA with pre-slew DRM)
Power-law model
Spectral model in power-law:
------------------------------------------------------------
Parameters  : value       lower 90%   higher 90%
Photon index: 1.36157     ( -0.0568447   0.0568597 )
Norm@50keV  : 1.26936E-02    ( -0.000388106   0.000388072 )
------------------------------------------------------------
#Fit statistic : Chi-Squared =          50.07 using 59 PHA bins.
# Reduced chi-squared =         0.8785 for     57 degrees of freedom
# Null hypothesis probability =   7.303670e-01

Photon flux (15-150 keV)    in 10.29 sec: 1.53291 ( -0.0496442  0.0497337 ) ph/cm2/s
Energy fluence (15-150 keV)             : 1.27244e-06 ( -4.2509e-08  4.2616e-08 ) ergs/cm2
Cutoff power-law model
Spectral model in the cutoff power-law:
------------------------------------------------------------
Parameters  : value       lower 90%   higher 90%
Photon index: 1.06114     ( -0.232621   0.220907 )
Epeak [keV] : 170.738      ( -51.2891 286.84 )
Norm@50keV  : 1.74694E-02    ( -0.00356489   0.00474869 )
------------------------------------------------------------
#Fit statistic : Chi-Squared =          44.58 using 59 PHA bins.
# Reduced chi-squared =         0.7960 for     56 degrees of freedom
# Null hypothesis probability =   8.640474e-01

Photon flux (15-150 keV)    in 10.29 sec: 1.50347 ( -0.05369  0.0538 ) ph/cm2/s
Energy fluence (15-150 keV)             : 1.24721e-06 ( -4.68812e-08  4.67063e-08 ) ergs/cm2
Band function

Spectral model in the Band function:
------------------------------------------------------------
Parameters  : value       lower 90%   higher 90%
alpha       : -1.06113   ( -0.224629   0.228083 )
beta        : -10.0000    ( 10   1.77636e-15 )
Epeak [keV] : 170.713      ( -51.2591 287.079 )
Norm@50keV   : 1.74678E-02    ( -0.00356398   0.00475095 )
------------------------------------------------------------
#Fit statistic : Chi-Squared =          44.58 using 59 PHA bins.
# Reduced chi-squared =         0.8105 for     55 degrees of freedom
# Null hypothesis probability =   8.413022e-01

Photon flux (15-150 keV)    in 10.29 sec:  (    ) ph/cm2/s
Energy fluence (15-150 keV)             : 0 ( 0  0 ) ergs/cm2
S(25-50 keV) vs. S(50-100 keV) plot

S(25-50 keV)  = 7.08e-07
S(50-100 keV) = 8.53e-07
T90 vs. Hardness ratio plot

T90                                   = 59.1240000128746 sec.
Hardness ratio (energy fluence ratio) = 1.2048
Color vs. Color plot

Count Ratio  (25-50 keV) / (15-25 keV) = 1.2751
Count Ratio (50-100 keV) / (15-25 keV) = 0.820861
Mask shadow pattern
IMX = 3.079025315625138E-01, IMY = 3.549799085768047E-02
TIME vs. PHA plot around the trigger time

Blue+Cyan dotted lines: Time interval of the scaled map
From 0.000000 to 0.512000
TIME vs. DetID plot around the trigger time

Blue+Cyan dotted lines: Time interval of the scaled map
From 0.000000 to 0.512000
100 us light curve (15-350 keV)

Blue+Cyan dotted lines: Time interval of the scaled map
From 0.000000 to 0.512000
Spacecraft aspect plot

Bright source in the pre-burst/pre-slew/post-slew images
Pre-burst image of 15-350 keV band
Time interval of the image:
-30.227410 -0.116000

# RAcent  DECcent POSerr Theta    Phi  PeakCts   SNR AngSep     Name
#  [deg]    [deg]    ['] [deg]  [deg]                   [']
261.1583  63.2168    2.4  47.7   16.5   0.6510   4.8 ------	UNKNOWN
136.6458  22.5765    2.9  36.6 -152.7   0.2643   4.0 ------	UNKNOWN
  6.8847  70.7469    2.9  56.6  -29.1   1.0866   3.9 ------	UNKNOWN
 93.7414  54.3869    2.4  41.2  -77.7   0.9653   4.8 ------	UNKNOWN
Pre-slew background subtracted image of 15-350 keV band
Time interval of the image:
-0.116000 10.172590

# RAcent  DECcent POSerr Theta    Phi  PeakCts   SNR AngSep     Name
#  [deg]    [deg]    ['] [deg]  [deg]                   [']
176.5514  68.0620    0.3  17.2   -6.6   2.0334  46.0 ------	UNKNOWN
289.9890  73.4202    2.3  49.3   -2.7   0.4454   5.0 ------	UNKNOWN
125.1191  22.6181    2.2  42.4 -138.6   0.4033   5.3 ------	UNKNOWN
Post-slew image of 15-350 keV band
Time interval of the image:
50.972600 483.072000

# RAcent  DECcent POSerr Theta    Phi  PeakCts   SNR AngSep     Name
#  [deg]    [deg]    ['] [deg]  [deg]                   [']
301.9344  51.5906    2.6  53.7   17.5  21.1896   4.5 ------	UNKNOWN
314.5877  61.5389    4.0  46.9    4.4   5.4091   2.9 ------	UNKNOWN
 99.6949  48.5890    3.0  41.2  -99.2  15.6757   3.8 ------	UNKNOWN
Plot creation:
Sun May 31 07:21:53 EDT 2015