Click here for the BAT GCN circular template
Image
Pre-slew 15.0-350.0 keV image (Event data)

#   RAcent    DECcent   POSerr    Theta     Phi              Peak Cts       SNR   Name
  173.8051    -7.1016   0.0032    24.1816     4.5992         3.6077364     60.671 TRIG_00313954

Foreground time interval of the image:
 -5.284  13.069 (delta_t =  18.353 [sec])
Background time interval of the image:
-239.832  -5.284 (delta_t = 234.548 [sec])
Lightcurves
Notes:
- 1) The mask-weighted light curves are using the flight position.
- 2) Multiple plots of different time binning/intervals are shown to cover all scenarios of short/long GRBs, rate/image triggers, and real/false positives.
- 3) For all the mask-weighted lightcurves, the y-axis units are counts/sec/det where a det is 0.4 x 0.4 = 0.16 sq cm.
- 4) The verticle lines correspond to following: green dotted lines are T50 interval, black dotted lines are T90 interval, blue solid line(s) is a spacecraft slew start time, and orange solid line(s) is a spacecraft slew end time.
- 5) Time of each bin is in the middle of the bin.
1 s binning
From T0-310 s to T0+310 s

From T100_start - 20 s to T100_end + 30 s
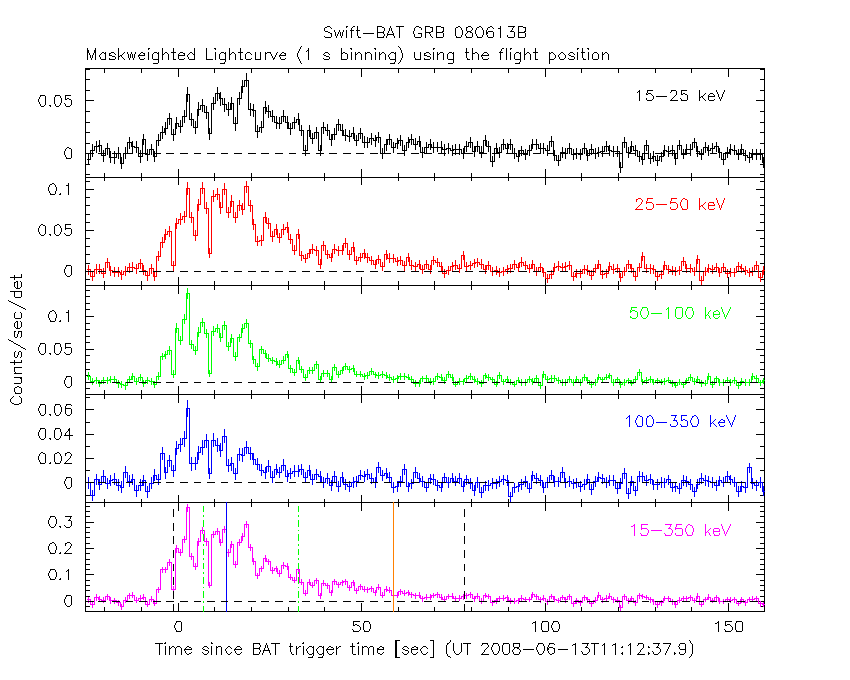
Full time interval

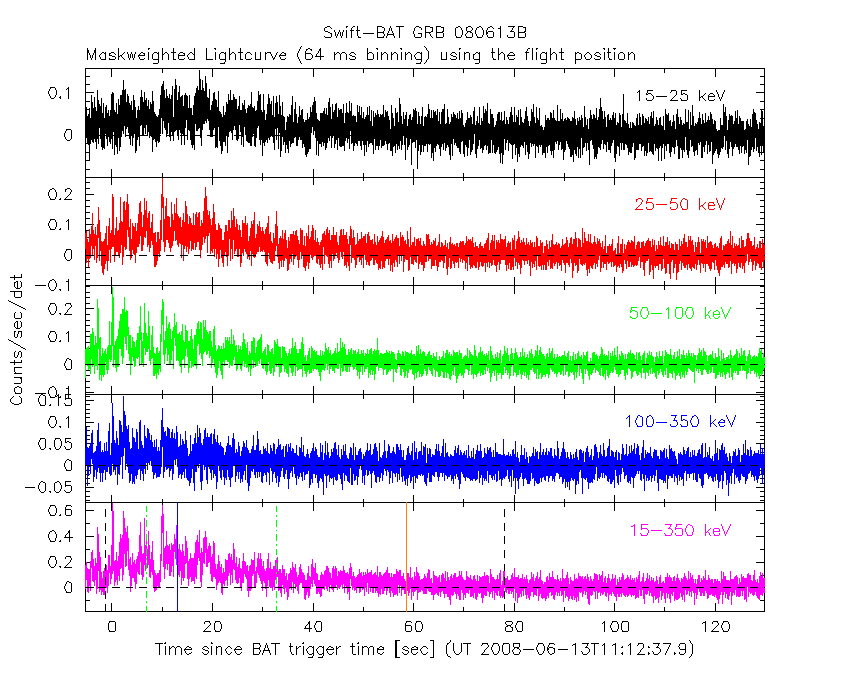
64 ms binning
Full time interval
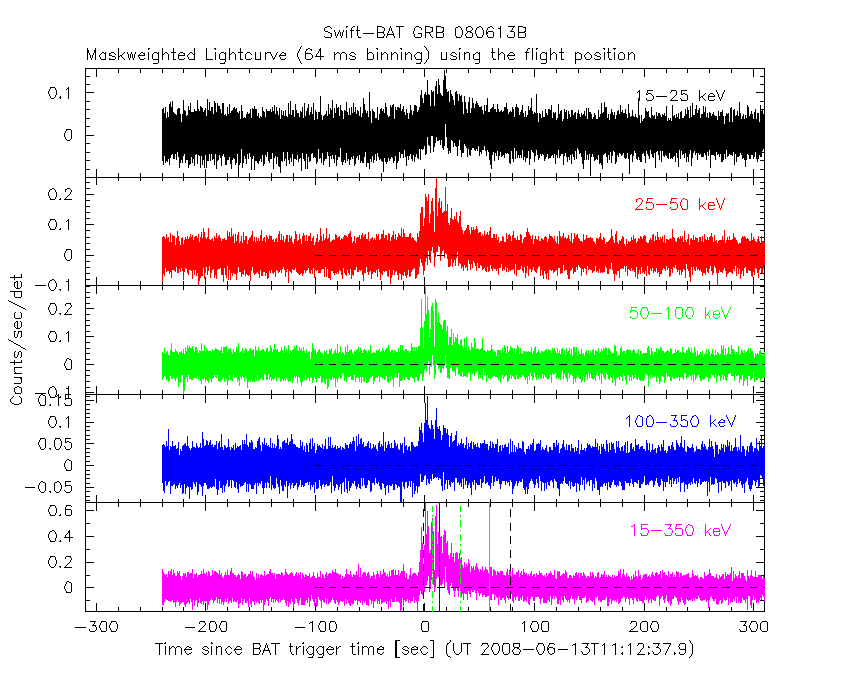
From T100_start to T100_end
From T0-5 sec to T0+5 sec

16 ms binning
From T100_start-5 s to T100_start+5 s

Blue+Cyan dotted lines: Time interval of the scaled map
From 0.000000 to 0.256000
8 ms binning
From T100_start-3 s to T100_start+3 s

Blue+Cyan dotted lines: Time interval of the scaled map
From 0.000000 to 0.256000
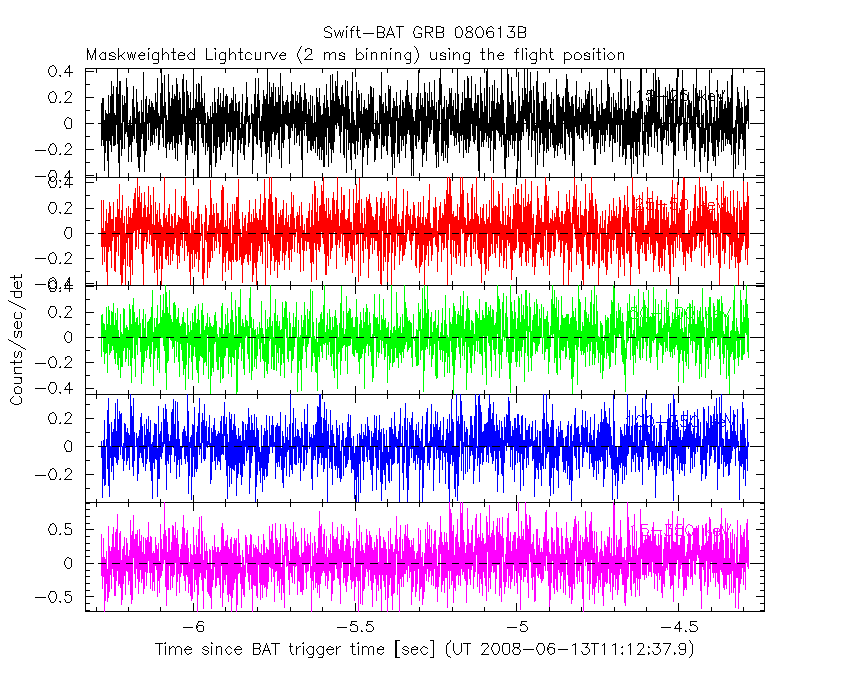
2 ms binning
From T100_start-1 s to T100_start+1 s
Blue+Cyan dotted lines: Time interval of the scaled map
From 0.000000 to 0.256000
SN=5 or 10 sec. binning (whichever binning is satisfied first)
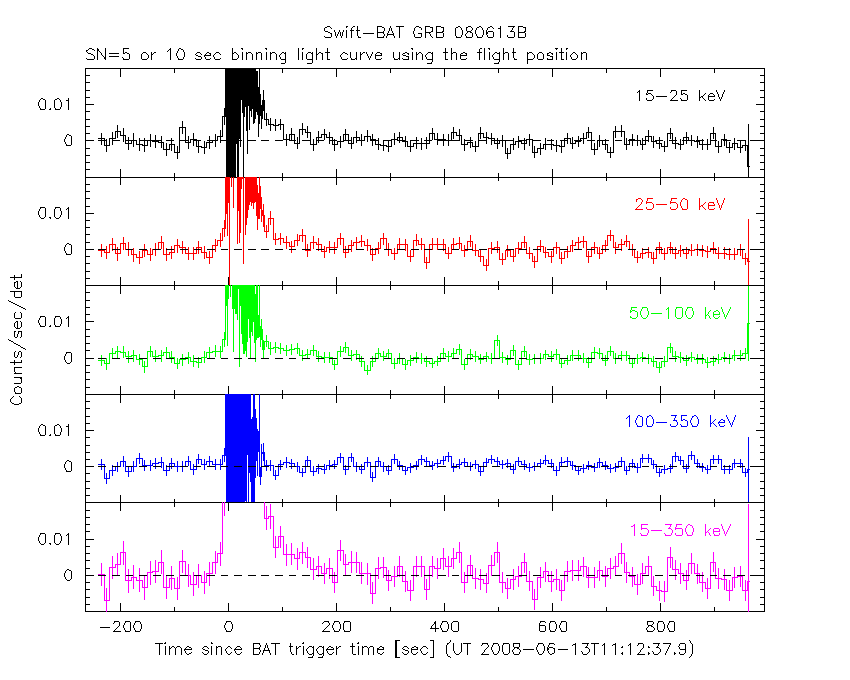
SN=5 or 10 sec. binning (T < 200 sec)

Quad-rate summed light curves (from T0-300s to T0+1000s)

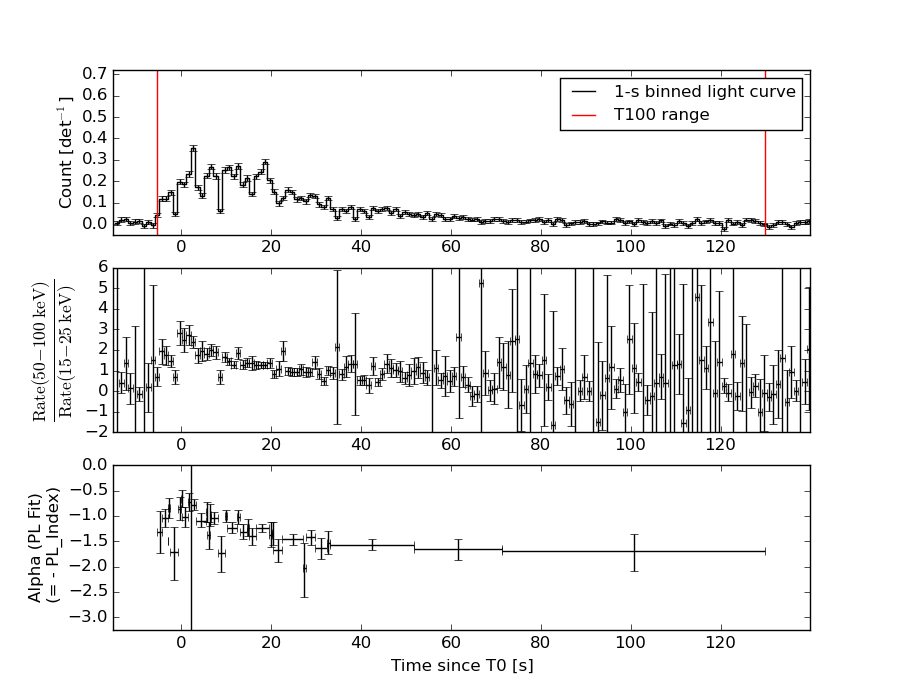
Spectral Evolution
Spectra
Notes:
- 1) The fitting includes the systematic errors.
- 2) When the burst includes telescope slew time periods, the fitting uses an average response file made from multiple 5-s response files through out the slew time plus single time preiod for the non-slew times, and weighted by the total counts in the corresponding time period using addrmf. An average response file is needed becuase a spectral fit using the pre-slew DRM will introduce some errors in both a spectral shape and a normalization if the PHA file contains a lot of the slew/post-slew time interval.
- 3) For fits to more complicated models (e.g. a power-law over a cutoff power-law), the BAT team has decided to require a chi-square improvement of more than 6 for each extra dof.
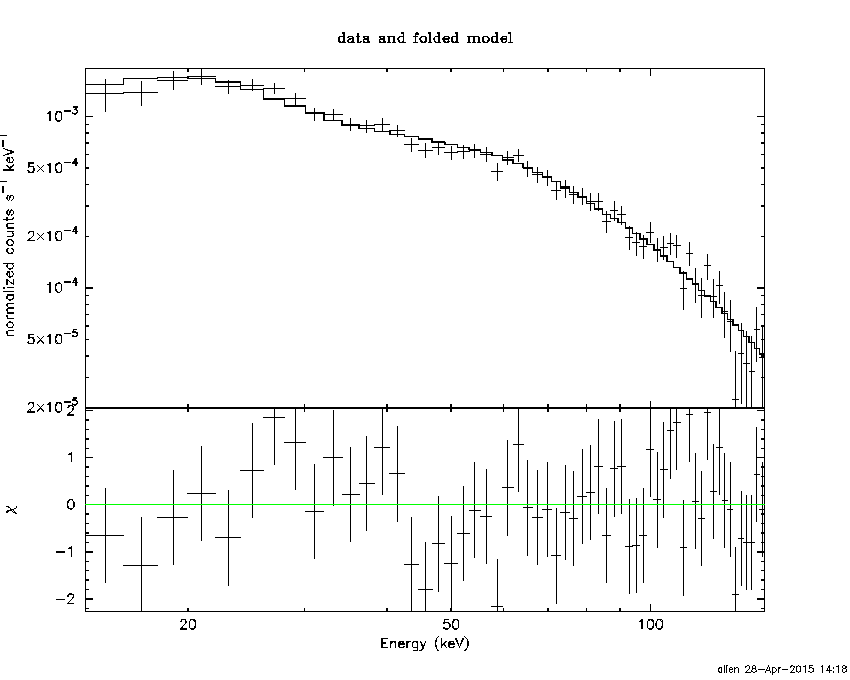
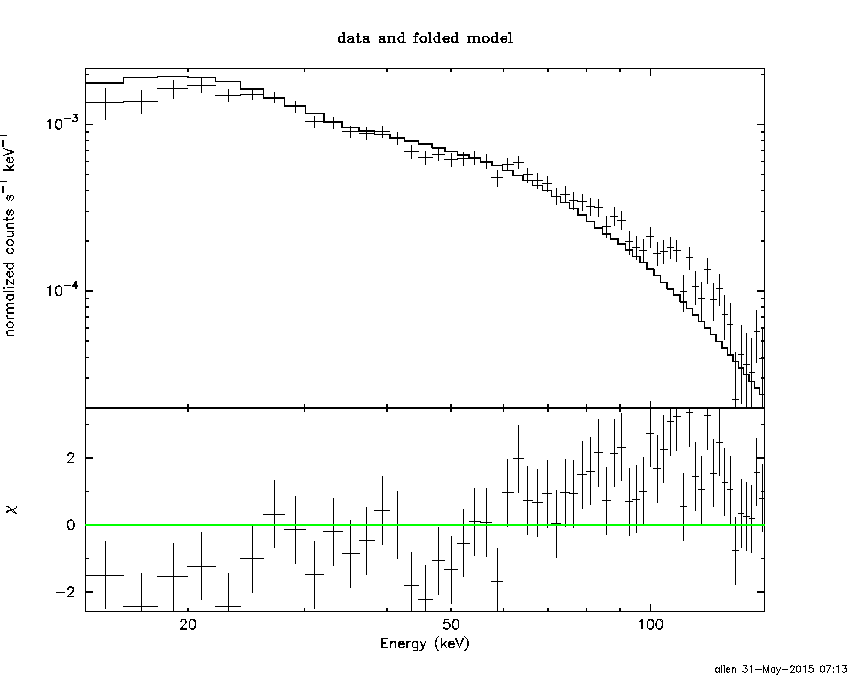
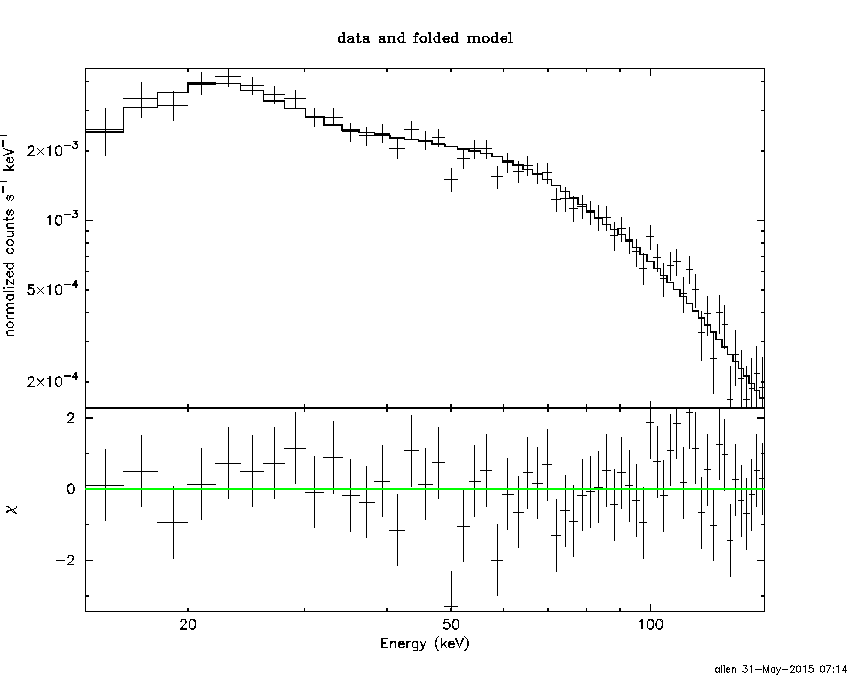
Time averaged spectrum fit using the average DRM
Power-law model

Time interval is from   -5.284 sec. to  129.836 sec.

Spectral model in power-law:
------------------------------------------------------------
Parameters  : value       lower 90%   higher 90%
Photon index: 1.33212     ( -0.047855   0.0476329 )
Norm@50keV  : 4.31470E-03    ( -0.000104787   0.000104732 )
------------------------------------------------------------
#Fit statistic : Chi-Squared =          54.61 using 59 PHA bins.
# Reduced chi-squared =         0.9580 for     57 degrees of freedom
# Null hypothesis probability =   5.654444e-01

Photon flux (15-150 keV)    in 135.1 sec: 0.517920 ( -0.0139079  0.0139673 ) ph/cm2/s
Energy fluence (15-150 keV)             : 5.71649e-06 ( -1.46575e-07  1.46993e-07 ) ergs/cm2
Cutoff power-law model
Time interval is from   -5.284 sec. to  129.836 sec.
Spectral model in the cutoff power-law:
------------------------------------------------------------
Parameters  : value       lower 90%   higher 90%
Photon index: 1.32836     ( -0.0861681   0.113779 )
Epeak [keV] : 9998.81      (   )
Norm@50keV  : 4.33163E-03    ( -0.0001047   0.000423522 )
------------------------------------------------------------
#Fit statistic : Chi-Squared =          54.69 using 59 PHA bins.
# Reduced chi-squared =         0.9766 for     56 degrees of freedom
# Null hypothesis probability =   5.246358e-01

Photon flux (15-150 keV)    in 135.1 sec: 0.518253 ( -0.014575  0.013397 ) ph/cm2/s
Energy fluence (15-150 keV)             : 5.7152e-06 ( -1.44557e-07  1.45314e-07 ) ergs/cm2
Band function

Time interval is from   -5.284 sec. to  129.836 sec.

Spectral model in the Band function:
------------------------------------------------------------
Parameters  : value       lower 90%   higher 90%
alpha       : 0.939043   ( -1.96029   -1.96029 )
beta        : -1.35483    ( -0.0548351   0.054399 )
Epeak [keV] : 32.5437      ( -28.2353 114.049 )
Norm@50keV   : 0.203643    ( -0.203195   178.613 )
------------------------------------------------------------
#Fit statistic : Chi-Squared =          52.36 using 59 PHA bins.
# Reduced chi-squared =         0.9520 for     55 degrees of freedom
# Null hypothesis probability =   5.762252e-01

Photon flux (15-150 keV)    in 135.1 sec:  (    ) ph/cm2/s
Energy fluence (15-150 keV)             : 0 ( 0  0 ) ergs/cm2
Single BB
Spectral model blackbody:
------------------------------------------------------------
Parameters  : value    Lower 90%  Upper 90%
kT [keV]    : 19.0877  (  )
R^2/D10^2   : 2.54954E-02  (   )
(R is the radius in km and D10 is the distance to the source in units of 10 kpc)
------------------------------------------------------------
#Fit statistic : Chi-Squared =         465.98 using 59 PHA bins.
# Reduced chi-squared =         8.1751 for     57 degrees of freedom
# Null hypothesis probability =   1.623923e-65

Energy  Fluence     90% Error
[keV]   [erg/cm2]   [erg/cm2]
15- 25  2.463e-07   1.270e-08
25- 50  1.188e-06   4.593e-08
50-150  3.185e-06   1.236e-07
15-150  4.619e-06   1.290e-07
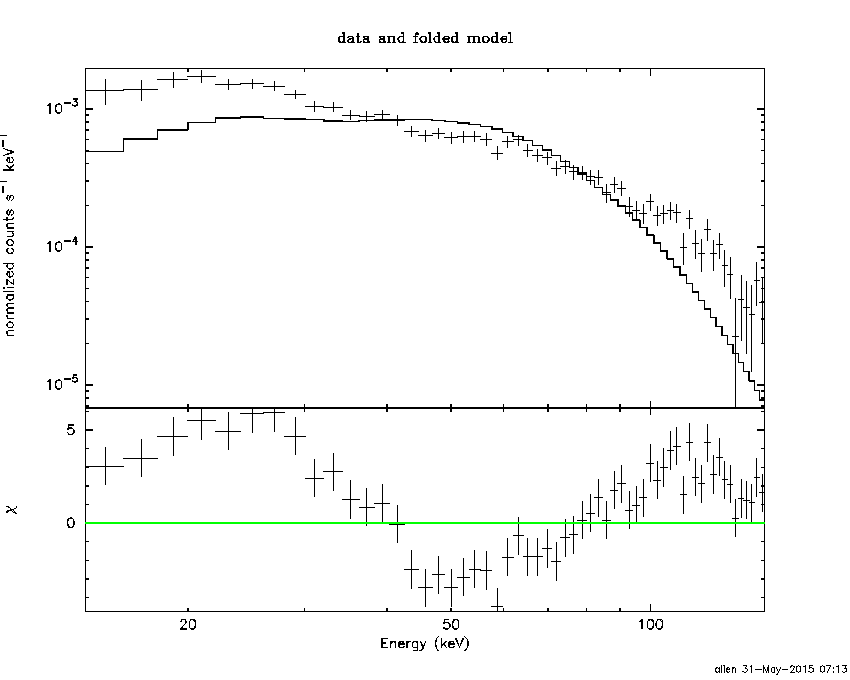
Thermal bremsstrahlung (OTTB)
Spectral model: thermal bremsstrahlung
------------------------------------------------------------
Parameters  : value         Lower 90%    Upper 90%
kT [keV]    : 199.363       (      )
Norm        : 2.18425       (     )
------------------------------------------------------------
#Fit statistic : Chi-Squared =         142.61 using 59 PHA bins.
# Reduced chi-squared =         2.5020 for     57 degrees of freedom
# Null hypothesis probability =   2.756677e-09

Energy  Fluence     90% Error
[keV]   [erg/cm2]   [erg/cm2]
15- 25  7.348e-07   2.047e-08
25- 50  1.414e-06   3.918e-08
50-150  3.100e-06   8.309e-08
15-150  5.248e-06   1.439e-07
Double BB

Spectral model: bbodyrad<1> + bbodyrad<2>
------------------------------------------------------------
Parameters  : value         Lower 90%    Upper 90%
kT1 [keV]   : 7.80546        (-0.598018      0.640843)
R1^2/D10^2  : 0.357013        (-0.0846414      0.116252)
kT2 [keV]   : 34.7005        (-3.1014      3.97725)
R2^2/D10^2  : 3.05394E-03    (-0.000866927   0.00106725)
------------------------------------------------------------
#Fit statistic : Chi-Squared =          42.95 using 59 PHA bins.
# Reduced chi-squared =         0.7809 for     55 degrees of freedom
# Null hypothesis probability =   8.811218e-01

Energy  Fluence     90% Error
[keV]   [erg/cm2]   [erg/cm2]
15- 25  5.922e-07   4.958e-08
25- 50  1.335e-06   6.937e-08
50-150  3.865e-06   2.297e-07
15-150  5.793e-06   3.013e-07
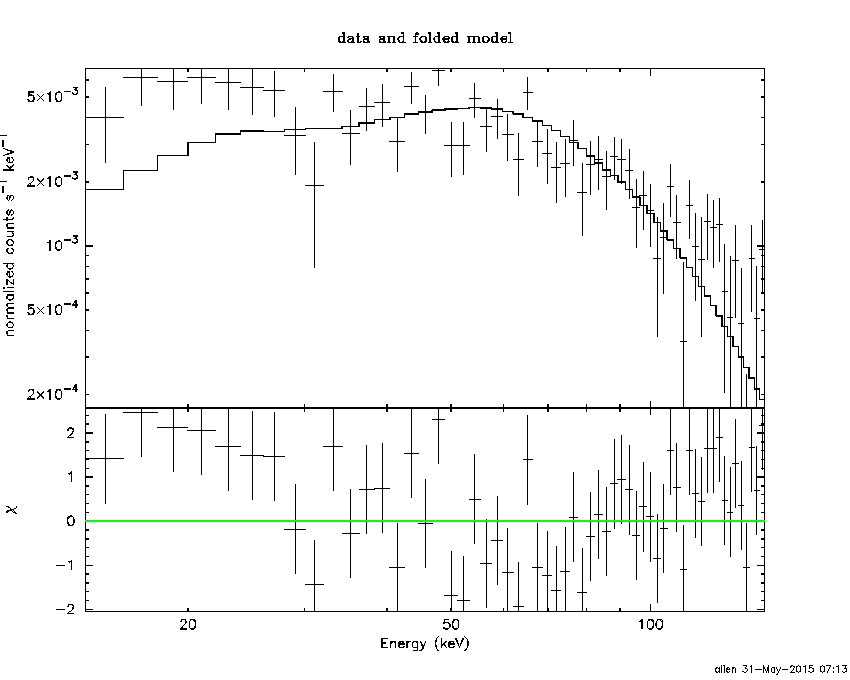
Peak spectrum fit
Power-law model

Time interval is from    2.228 sec. to    3.228 sec.

Spectral model in power-law:
------------------------------------------------------------
Parameters  : value       lower 90%   higher 90%
Photon index: 0.744502     ( -0.118734   0.115558 )
Norm@50keV  : 2.38537E-02    ( -0.00157979   0.00156619 )
------------------------------------------------------------
#Fit statistic : Chi-Squared =          54.31 using 59 PHA bins.
# Reduced chi-squared =         0.9528 for     57 degrees of freedom
# Null hypothesis probability =   5.766764e-01

Photon flux (15-150 keV)    in 1 sec: 2.74880 ( -0.17532  0.175605 ) ph/cm2/s
Energy fluence (15-150 keV)             : 2.85467e-07 ( -1.93505e-08  1.94355e-08 ) ergs/cm2
Cutoff power-law model

Time interval is from    2.228 sec. to    3.228 sec.
Spectral model in the cutoff power-law:
------------------------------------------------------------
Parameters  : value       lower 90%   higher 90%
Photon index: 0.740879     ( -0.122709   0.113758 )
Epeak [keV] : 9999.36      ( -9999.36 -9999.36 )
Norm@50keV  : 2.40361E-02    ( -0.00149074   0.0100724 )
------------------------------------------------------------
#Fit statistic : Chi-Squared =          54.33 using 59 PHA bins.
# Reduced chi-squared =         0.9702 for     56 degrees of freedom
# Null hypothesis probability =   5.382811e-01

Photon flux (15-150 keV)    in 1 sec: 2.74983 ( -0.17453  0.17373 ) ph/cm2/s
Energy fluence (15-150 keV)             : 2.85358e-07 ( -1.9176e-08  1.9191e-08 ) ergs/cm2
Band function

Time interval is from    2.228 sec. to    3.228 sec.

Spectral model in the Band function:
------------------------------------------------------------
Parameters  : value       lower 90%   higher 90%
alpha       : -0.885225   ( 0.885226   0.885226 )
beta        : -0.744502    ( -0.115456   0.118911 )
Epeak [keV] : 16.5846      ( -16.5846 -16.5846 )
Norm@50keV   : 3.31855E-02    ( -0.0119869   506902 )
------------------------------------------------------------
#Fit statistic : Chi-Squared =          54.31 using 59 PHA bins.
# Reduced chi-squared =         0.9874 for     55 degrees of freedom
# Null hypothesis probability =   5.009972e-01

Photon flux (15-150 keV)    in 1 sec:  (    ) ph/cm2/s
Energy fluence (15-150 keV)             : 0 ( 0  0 ) ergs/cm2
Single BB
Spectral model blackbody:
------------------------------------------------------------
Parameters  : value    Lower 90%  Upper 90%
kT [keV]    : 27.3384  (-2.58814  3.04818)
R^2/D10^2   : 5.38170E-02  (-0.0140251   0.0181017)
(R is the radius in km and D10 is the distance to the source in units of 10 kpc)
------------------------------------------------------------
#Fit statistic : Chi-Squared =          93.46 using 59 PHA bins.
# Reduced chi-squared =          1.640 for     57 degrees of freedom
# Null hypothesis probability =   1.660587e-03

Energy  Fluence     90% Error
[keV]   [erg/cm2]   [erg/cm2]
15- 25  6.650e-09   9.080e-10
25- 50  3.940e-08   3.810e-09
50-150  2.144e-07   2.305e-08
15-150  2.605e-07   2.155e-08
Thermal bremsstrahlung (OTTB)
Spectral model: thermal bremsstrahlung
------------------------------------------------------------
Parameters  : value         Lower 90%    Upper 90%
kT [keV]    : 199.363       (      )
Norm        : 10.5582       (     )
------------------------------------------------------------
#Fit statistic : Chi-Squared =         183.93 using 59 PHA bins.
# Reduced chi-squared =         3.2268 for     57 degrees of freedom
# Null hypothesis probability =   2.838457e-15

Energy  Fluence     90% Error
[keV]   [erg/cm2]   [erg/cm2]
15- 25  2.629e-08   2.140e-09
25- 50  5.057e-08   5.570e-09
50-150  1.109e-07   3.421e-08
15-150  1.878e-07   4.400e-08
Double BB
Spectral model: bbodyrad<1> + bbodyrad<2>
------------------------------------------------------------
Parameters  : value         Lower 90%    Upper 90%
kT1 [keV]   : 10.1154        (-3.68412      4.38007)
R1^2/D10^2  : 0.533194        (-0.309897      1.50778)
kT2 [keV]   : 48.8687        (-14.2112      77.9459)
R2^2/D10^2  : 9.41374E-03    (-0.00758264   0.0154543)
------------------------------------------------------------
#Fit statistic : Chi-Squared =          56.92 using 59 PHA bins.
# Reduced chi-squared =          1.035 for     55 degrees of freedom
# Null hypothesis probability =   4.033534e-01

Energy  Fluence     90% Error
[keV]   [erg/cm2]   [erg/cm2]
15- 25  1.365e-08   5.444e-09
25- 50  4.614e-08   1.346e-08
50-150  2.298e-07   1.055e-07
15-150  2.896e-07   1.113e-07
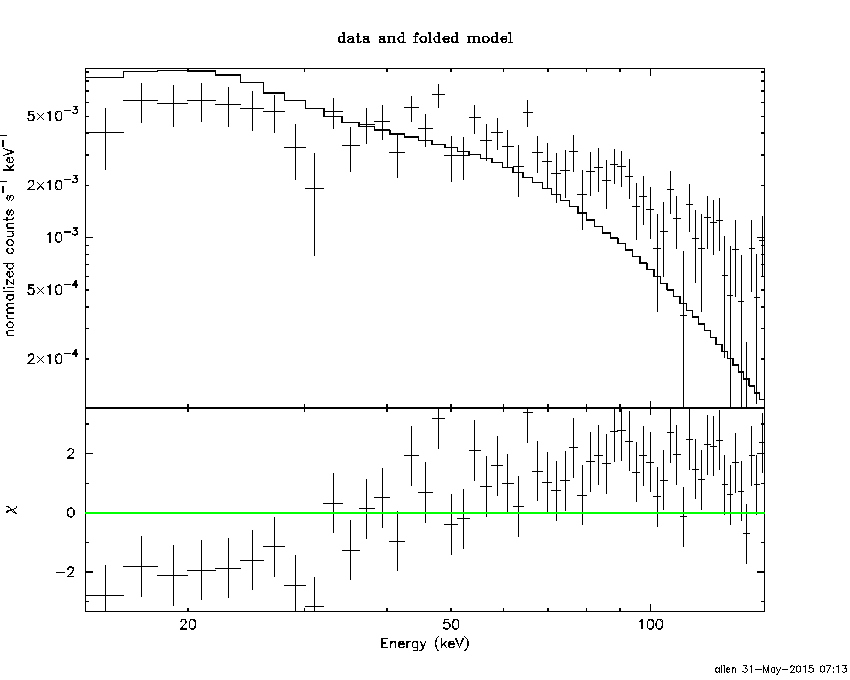
Pre-slew spectrum (Pre-slew PHA with pre-slew DRM)
Power-law model

Spectral model in power-law:
------------------------------------------------------------
Parameters  : value       lower 90%   higher 90%
Photon index: 1.04796     ( -0.0490748   0.0486928 )
Norm@50keV  : 1.29318E-02    ( -0.000340396   0.000339305 )
------------------------------------------------------------
#Fit statistic : Chi-Squared =          56.56 using 59 PHA bins.
# Reduced chi-squared =         0.9922 for     57 degrees of freedom
# Null hypothesis probability =   4.916769e-01

Photon flux (15-150 keV)    in 18.35 sec: 1.49336 ( -0.0409422  0.0410534 ) ph/cm2/s
Energy fluence (15-150 keV)             : 2.52379e-06 ( -6.82247e-08  6.83523e-08 ) ergs/cm2
Cutoff power-law model

Spectral model in the cutoff power-law:
------------------------------------------------------------
Parameters  : value       lower 90%   higher 90%
Photon index: 1.04137     ( -0.0486408   0.0498981 )
Epeak [keV] : 9997.27      ( -9998.02 -9998.02 )
Norm@50keV  : 1.30028E-02    ( -0.000335014   0.0013515 )
------------------------------------------------------------
#Fit statistic : Chi-Squared =          56.66 using 59 PHA bins.
# Reduced chi-squared =          1.012 for     56 degrees of freedom
# Null hypothesis probability =   4.501918e-01

Photon flux (15-150 keV)    in 18.35 sec: 1.49273 ( -0.04093  0.04099 ) ph/cm2/s
Energy fluence (15-150 keV)             : 2.53254e-06 ( -8.02262e-08  6.40599e-08 ) ergs/cm2
Band function
Spectral model in the Band function:
------------------------------------------------------------
Parameters  : value       lower 90%   higher 90%
alpha       : 3.60211   ( -9.09817   -3.60211 )
beta        : -1.07882    ( -0.0569277   0.0552094 )
Epeak [keV] : 28.7294      ( -5.69774 48.1144 )
Norm@50keV   : 43.7831    ( -43.7831   155.279 )
------------------------------------------------------------
#Fit statistic : Chi-Squared =          52.10 using 59 PHA bins.
# Reduced chi-squared =         0.9472 for     55 degrees of freedom
# Null hypothesis probability =   5.862806e-01

Photon flux (15-150 keV)    in 18.35 sec:  (    ) ph/cm2/s
Energy fluence (15-150 keV)             : 0 ( 0  0 ) ergs/cm2
S(25-50 keV) vs. S(50-100 keV) plot
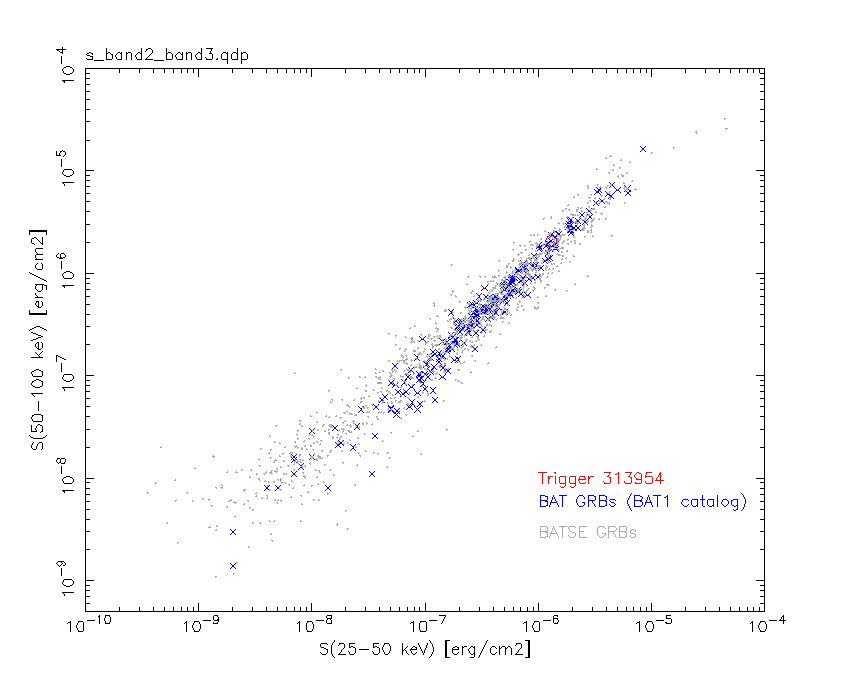
S(25-50 keV)  = 1.30e-06
S(50-100 keV) = 2.06e-06
T90 vs. Hardness ratio plot
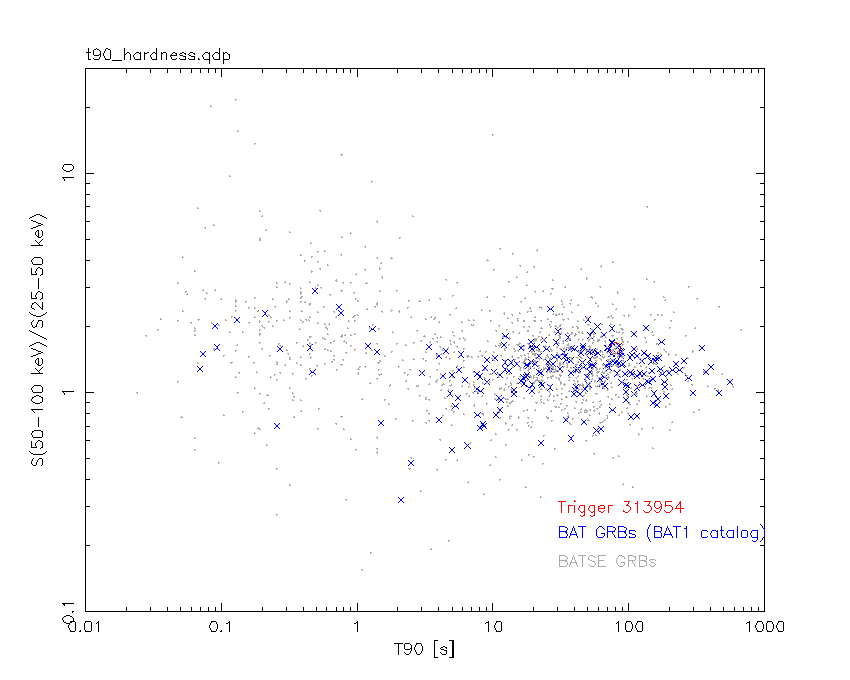
T90                                   = 79.4480000138283 sec.
Hardness ratio (energy fluence ratio) = 1.58462
Color vs. Color plot

Count Ratio  (25-50 keV) / (15-25 keV) = 1.52635
Count Ratio (50-100 keV) / (15-25 keV) = 1.27837
Mask shadow pattern

IMX = 4.475861496632544E-01, IMY = -3.600562921280936E-02
TIME vs. PHA plot around the trigger time
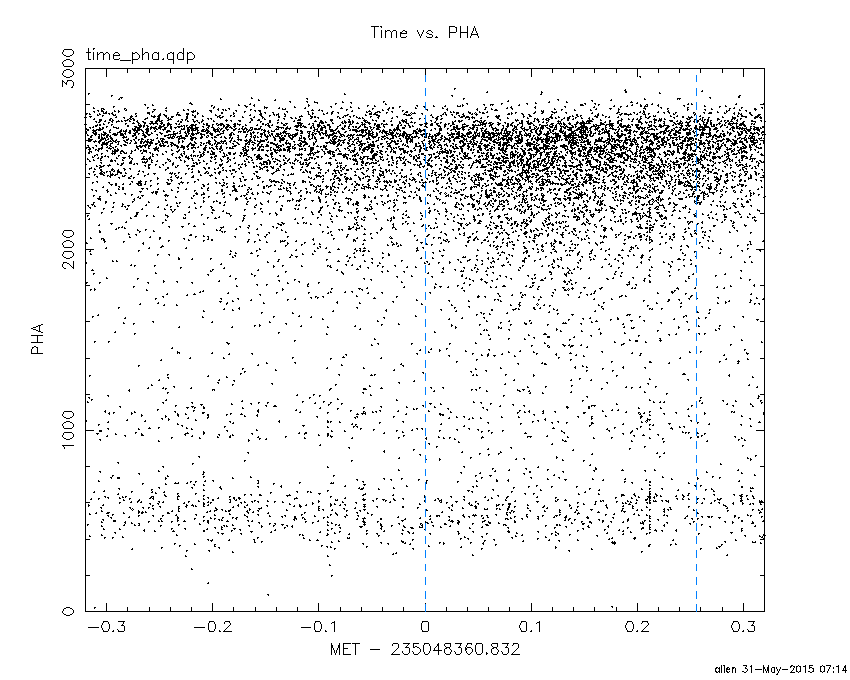
Blue+Cyan dotted lines: Time interval of the scaled map
From 0.000000 to 0.256000
TIME vs. DetID plot around the trigger time

Blue+Cyan dotted lines: Time interval of the scaled map
From 0.000000 to 0.256000
100 us light curve (15-350 keV)

Blue+Cyan dotted lines: Time interval of the scaled map
From 0.000000 to 0.256000
Spacecraft aspect plot

Bright source in the pre-burst/pre-slew/post-slew images
Pre-burst image of 15-350 keV band
Time interval of the image:
-239.832000 -5.284000

# RAcent  DECcent POSerr Theta    Phi  PeakCts   SNR AngSep     Name
#  [deg]    [deg]    ['] [deg]  [deg]                   [']
135.5262 -40.5481    0.4  23.9 -163.0   4.7210  25.9    0.4	Vela X-1
170.4539 -60.6026    2.5  34.4  138.0   1.4653   4.6    4.2	Cen X-3
186.6113 -62.7166    7.2  39.9  128.5   0.8148   1.6    3.5	GX 301-2
193.3668 -31.7757    2.4  29.8   74.9   1.4103   4.9 ------	UNKNOWN
169.8290 -24.6541    2.4   9.7   45.6   0.7685   4.9 ------	UNKNOWN
183.5003   7.1500    2.5  41.4    5.3   1.2945   4.6 ------	UNKNOWN
 86.2651 -49.6195    3.5  59.1 -166.2   4.2633   3.3 ------	UNKNOWN
138.3801   7.2071    2.4  39.8  -66.2   2.7638   4.9 ------	UNKNOWN
 95.0508 -32.7315    4.9  55.2 -145.1   2.8397   2.4 ------	UNKNOWN
145.5851  19.3666    2.9  48.3  -50.0   3.9908   3.9 ------	UNKNOWN
Pre-slew background subtracted image of 15-350 keV band
Time interval of the image:
-5.284000 13.068600

# RAcent  DECcent POSerr Theta    Phi  PeakCts   SNR AngSep     Name
#  [deg]    [deg]    ['] [deg]  [deg]                   [']
135.4289 -40.5961    2.6  24.0 -163.0  -0.2312  -4.4    5.2	Vela X-1
169.9036 -60.6996    0.0  34.4  138.5   0.1280   1.3   13.0	Cen X-3
186.6276 -62.6391    5.4  39.8  128.4  -0.3118  -2.1    7.9	GX 301-2
184.1285 -73.9759    2.2  48.7  138.7   1.3279   5.2 ------	UNKNOWN
197.0017  12.0616    2.0  53.5   15.5   1.4076   5.9 ------	UNKNOWN
173.8051  -7.1016    0.2  24.2    4.6   3.6078  60.7 ------	UNKNOWN
Post-slew image of 15-350 keV band
Time interval of the image:
58.668600 962.203800

# RAcent  DECcent POSerr Theta    Phi  PeakCts   SNR AngSep     Name
#  [deg]    [deg]    ['] [deg]  [deg]                   [']
135.5348 -40.5506    0.7  47.8 -163.3  16.8993  16.3    0.4	Vela X-1
170.5251 -60.6502    5.9  53.6  159.2   5.1779   1.9    6.4	Cen X-3
198.2218 -41.4579    2.9  40.6  128.8   5.0031   4.0 ------	UNKNOWN
194.6408  29.0729    3.3  41.4    5.3   2.3605   3.5 ------	UNKNOWN
151.9474  39.4633    4.2  50.8  -44.5   7.9730   2.8 ------	UNKNOWN
125.3444 -17.4977    3.0  48.3 -129.9   7.6147   3.8 ------	UNKNOWN
Plot creation:
Sun May 31 07:14:33 EDT 2015