Special notes of this burst
Image
Pre-slew 15.0-350.0 keV image (Event data)
#   RAcent    DECcent   POSerr    Theta     Phi              Peak Cts       SNR   Name
    8.2576    19.4701   0.0210    25.6600    85.0457         2.4665149      9.207 TRIG_00316534

Foreground time interval of the image:
-96.216  66.548 (delta_t = 162.764 [sec])
Background time interval of the image:
-239.728 -96.216 (delta_t = 143.512 [sec])
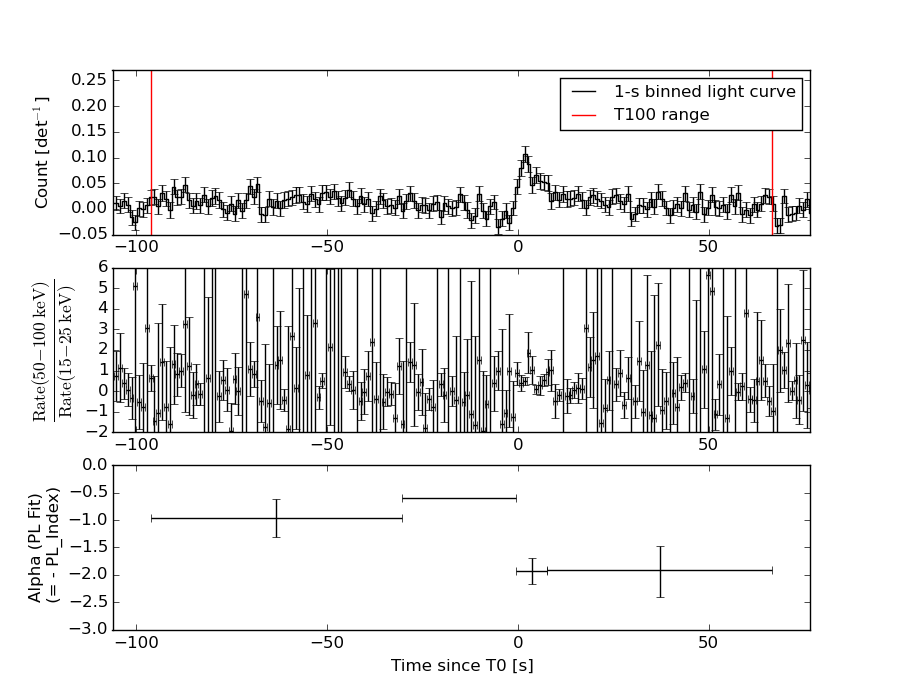
Lightcurves
Notes:
- 1) The mask-weighted light curves are using the flight position.
- 2) Multiple plots of different time binning/intervals are shown to cover all scenarios of short/long GRBs, rate/image triggers, and real/false positives.
- 3) For all the mask-weighted lightcurves, the y-axis units are counts/sec/det where a det is 0.4 x 0.4 = 0.16 sq cm.
- 4) The verticle lines correspond to following: green dotted lines are T50 interval, black dotted lines are T90 interval, blue solid line(s) is a spacecraft slew start time, and orange solid line(s) is a spacecraft slew end time.
- 5) Time of each bin is in the middle of the bin.
1 s binning
From T0-310 s to T0+310 s

From T100_start - 20 s to T100_end + 30 s

Full time interval
64 ms binning
Full time interval
From T100_start to T100_end

From T0-5 sec to T0+5 sec

16 ms binning
From T100_start-5 s to T100_start+5 s

Blue+Cyan dotted lines: Time interval of the scaled map
From 0.000000 to 4.096000
8 ms binning
From T100_start-3 s to T100_start+3 s

Blue+Cyan dotted lines: Time interval of the scaled map
From 0.000000 to 4.096000
2 ms binning
From T100_start-1 s to T100_start+1 s
Blue+Cyan dotted lines: Time interval of the scaled map
From 0.000000 to 4.096000
SN=5 or 10 sec. binning (whichever binning is satisfied first)

SN=5 or 10 sec. binning (T < 200 sec)

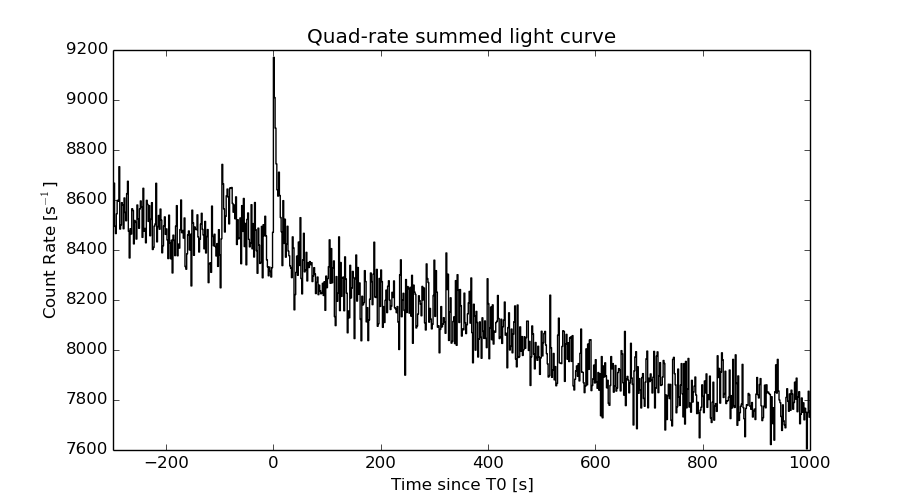
Quad-rate summed light curves (from T0-300s to T0+1000s)
Spectral Evolution
Spectra
Notes:
- 1) The fitting includes the systematic errors.
- 2) When the burst includes telescope slew time periods, the fitting uses an average response file made from multiple 5-s response files through out the slew time plus single time preiod for the non-slew times, and weighted by the total counts in the corresponding time period using addrmf. An average response file is needed becuase a spectral fit using the pre-slew DRM will introduce some errors in both a spectral shape and a normalization if the PHA file contains a lot of the slew/post-slew time interval.
- 3) For fits to more complicated models (e.g. a power-law over a cutoff power-law), the BAT team has decided to require a chi-square improvement of more than 6 for each extra dof.
Time averaged spectrum fit using the average DRM
Power-law model

Time interval is from  -96.216 sec. to   66.548 sec.

Spectral model in power-law:
------------------------------------------------------------
Parameters  : value       lower 90%   higher 90%
Photon index: 1.44785     ( -0.226238   0.229321 )
Norm@50keV  : 9.80042E-04    ( -0.00012326   0.000121684 )
------------------------------------------------------------
#Fit statistic : Chi-Squared =          62.61 using 59 PHA bins.
# Reduced chi-squared =          1.098 for     57 degrees of freedom
# Null hypothesis probability =   2.841058e-01

Photon flux (15-150 keV)    in 162.8 sec: 0.120712 ( -0.014492  0.0145149 ) ph/cm2/s
Energy fluence (15-150 keV)             : 1.52739e-06 ( -2.16558e-07  2.20596e-07 ) ergs/cm2
Cutoff power-law model

Time interval is from  -96.216 sec. to   66.548 sec.
Spectral model in the cutoff power-law:
------------------------------------------------------------
Parameters  : value       lower 90%   higher 90%
Photon index: 2.23058     (     )
Epeak [keV] : 83.3215      (   )
Norm@50keV  : 3.56757E-04    (     )
------------------------------------------------------------
#Fit statistic : Chi-Squared =          60.95 using 59 PHA bins.
# Reduced chi-squared =          1.088 for     56 degrees of freedom
# Null hypothesis probability =   3.024972e-01

Photon flux (15-150 keV)    in 162.8 sec: 0.120803 ( -0.014644  0.014399 ) ph/cm2/s
Energy fluence (15-150 keV)             : 1.51742e-06 ( -2.08166e-07  2.27927e-07 ) ergs/cm2
Band function

Time interval is from  -96.216 sec. to   66.548 sec.

Spectral model in the Band function:
------------------------------------------------------------
Parameters  : value       lower 90%   higher 90%
alpha       : -1.26645   ( 1.26645   1.26645 )
beta        : -1.44784    ( 1.44784   0.226217 )
Epeak [keV] : 27.4135      ( -27.4135 -27.4135 )
Norm@50keV   : 1.68823E-03    ( -0.000825322   357.972 )
------------------------------------------------------------
#Fit statistic : Chi-Squared =          62.61 using 59 PHA bins.
# Reduced chi-squared =          1.138 for     55 degrees of freedom
# Null hypothesis probability =   2.244995e-01

Photon flux (15-150 keV)    in 162.8 sec:  (    ) ph/cm2/s
Energy fluence (15-150 keV)             : 0 ( 0  0 ) ergs/cm2
Single BB

Spectral model blackbody:
------------------------------------------------------------
Parameters  : value    Lower 90%  Upper 90%
kT [keV]    : 14.5471  (-2.27628  2.91691)
R^2/D10^2   : 1.48053E-02  (-0.00690008   0.0120094)
(R is the radius in km and D10 is the distance to the source in units of 10 kpc)
------------------------------------------------------------
#Fit statistic : Chi-Squared =          83.52 using 59 PHA bins.
# Reduced chi-squared =          1.465 for     57 degrees of freedom
# Null hypothesis probability =   1.259089e-02

Energy  Fluence     90% Error
[keV]   [erg/cm2]   [erg/cm2]
15- 25  1.073e-07   2.729e-08
25- 50  4.142e-07   8.026e-08
50-150  5.881e-07   1.483e-07
15-150  1.110e-06   1.970e-07
Thermal bremsstrahlung (OTTB)

Spectral model: thermal bremsstrahlung
------------------------------------------------------------
Parameters  : value         Lower 90%    Upper 90%
kT [keV]    : 200.000       (      )
Norm        : 0.491506       (-0.0586801     0.0586781)
------------------------------------------------------------
#Fit statistic : Chi-Squared =          64.29 using 59 PHA bins.
# Reduced chi-squared =          1.128 for     57 degrees of freedom
# Null hypothesis probability =   2.366348e-01

Energy  Fluence     90% Error
[keV]   [erg/cm2]   [erg/cm2]
15- 25  1.993e-07   1.119e-07
25- 50  3.833e-07   2.096e-07
50-150  8.407e-07   4.667e-07
15-150  1.423e-06   7.911e-07
Double BB

R1^2/D10^2  : 6.05362E-02        (-1.70464      50.1027)
kT2 [keV]   : 50.2345        (      )
R2^2/D10^2  : 2.26318E-04    (   )
------------------------------------------------------------
#Fit statistic : Chi-Squared =          66.87 using 59 PHA bins.
#Fit statistic : Chi-Squared =          65.81 using 59 PHA bins.
#Fit statistic : Chi-Squared =          65.76 using 59 PHA bins.
# Reduced chi-squared =          1.216 for     55 degrees of freedom
# Reduced chi-squared =          1.196 for     55 degrees of freedom
# Reduced chi-squared =          1.196 for     55 degrees of freedom
# Null hypothesis probability =   1.308965e-01
# Null hypothesis probability =   1.509870e-01
# Null hypothesis probability =   1.518257e-01

Energy  Fluence     90% Error
[keV]   [erg/cm2]   [erg/cm2]
15- 25  2.070e-07   9.786e-08
25- 50  3.230e-07   1.017e-07
50-150  8.413e-07   3.477e-07
15-150  1.371e-06   3.956e-07
Peak spectrum fit
Power-law model

Time interval is from    0.888 sec. to    1.888 sec.

Spectral model in power-law:
------------------------------------------------------------
Parameters  : value       lower 90%   higher 90%
Photon index: 1.84278     ( -0.353935   0.384311 )
Norm@50keV  : 6.57776E-03    ( -0.00173463   0.00168482 )
------------------------------------------------------------
#Fit statistic : Chi-Squared =          67.71 using 59 PHA bins.
# Reduced chi-squared =          1.188 for     57 degrees of freedom
# Null hypothesis probability =   1.567148e-01

Photon flux (15-150 keV)    in 1 sec: 0.921874 ( -0.191257  0.191312 ) ph/cm2/s
Energy fluence (15-150 keV)             : 6.04915e-08 ( -1.54555e-08  1.63332e-08 ) ergs/cm2
Cutoff power-law model

Time interval is from    0.888 sec. to    1.888 sec.
Spectral model in the cutoff power-law:
------------------------------------------------------------
Parameters  : value       lower 90%   higher 90%
Photon index: 0.494990     ( -5.50053   1.64474 )
Epeak [keV] : 41.4807      (   )
Norm@50keV  : 4.55311E-02    (     )
------------------------------------------------------------
#Fit statistic : Chi-Squared =          65.93 using 59 PHA bins.
# Reduced chi-squared =          1.177 for     56 degrees of freedom
# Null hypothesis probability =   1.711287e-01

Photon flux (15-150 keV)    in 1 sec: 0.883848 ( -0.194558  0.196372 ) ph/cm2/s
Energy fluence (15-150 keV)             : 5.05801e-08 ( -1.704e-08  2.03296e-08 ) ergs/cm2
Band function

Time interval is from    0.888 sec. to    1.888 sec.

Spectral model in the Band function:
------------------------------------------------------------
Parameters  : value       lower 90%   higher 90%
alpha       : -0.554883   ( -1.62396   1.88807 )
beta        : -10.00000    ( 10   5.92681e-09 )
Epeak [keV] : 42.0090      ( -13.5101 -42.009 )
Norm@50keV   : 4.14901E-02    ( -0.00847929   108.716 )
------------------------------------------------------------
#Fit statistic : Chi-Squared =          65.93 using 59 PHA bins.
# Reduced chi-squared =          1.199 for     55 degrees of freedom
# Null hypothesis probability =   1.485339e-01

Photon flux (15-150 keV)    in 1 sec:  (    ) ph/cm2/s
Energy fluence (15-150 keV)             : 5.4068e-08 ( -5.4061e-08  -1.68592e-08 ) ergs/cm2
Single BB

Spectral model blackbody:
------------------------------------------------------------
Parameters  : value    Lower 90%  Upper 90%
kT [keV]    : 8.96579  (-1.69641  2.35014)
R^2/D10^2   : 0.682442  (-0.40491   0.841861)
(R is the radius in km and D10 is the distance to the source in units of 10 kpc)
------------------------------------------------------------
#Fit statistic : Chi-Squared =          67.02 using 59 PHA bins.
# Reduced chi-squared =          1.176 for     57 degrees of freedom
# Null hypothesis probability =   1.709866e-01

Energy  Fluence     90% Error
[keV]   [erg/cm2]   [erg/cm2]
15- 25  1.066e-08   4.156e-09
25- 50  2.252e-08   8.015e-09
50-150  8.492e-09   5.024e-09
15-150  4.167e-08   1.484e-08
Thermal bremsstrahlung (OTTB)

Spectral model: thermal bremsstrahlung
------------------------------------------------------------
Parameters  : value         Lower 90%    Upper 90%
kT [keV]    : 74.9598       (-35.5153      123.026)
Norm        : 4.47668       (-1.14327     1.71286)
------------------------------------------------------------
#Fit statistic : Chi-Squared =          66.39 using 59 PHA bins.
# Reduced chi-squared =          1.165 for     57 degrees of freedom
# Null hypothesis probability =   1.847620e-01

Energy  Fluence     90% Error
[keV]   [erg/cm2]   [erg/cm2]
15- 25  1.156e-08   3.462e-09
25- 50  1.873e-08   6.856e-09
50-150  2.527e-08   2.123e-08
15-150  5.556e-08   2.857e-08
Double BB

Spectral model: bbodyrad<1> + bbodyrad<2>
------------------------------------------------------------
Parameters  : value         Lower 90%    Upper 90%
kT1 [keV]   : 7.26079        (-2.33446      1.95063)
R1^2/D10^2  : 1.23925        (-0.788683      2.80424)
kT2 [keV]   : 26.4913        (-26.4399      -26.4913)
R2^2/D10^2  : 6.35669E-03    (-0.00634417   0.254025)
------------------------------------------------------------
#Fit statistic : Chi-Squared =          63.70 using 59 PHA bins.
# Reduced chi-squared =          1.158 for     55 degrees of freedom
# Null hypothesis probability =   1.970444e-01

Energy  Fluence     90% Error
[keV]   [erg/cm2]   [erg/cm2]
15- 25  1.163e-08   6.885e-09
25- 50  2.037e-08   1.228e-08
50-150  2.559e-08   1.499e-08
15-150  5.759e-08   2.950e-08
Pre-slew spectrum (Pre-slew PHA with pre-slew DRM)
Power-law model

Spectral model in power-law:
------------------------------------------------------------
Parameters  : value       lower 90%   higher 90%
Photon index: 1.44785     ( -0.226238   0.229321 )
Norm@50keV  : 9.80042E-04    ( -0.00012326   0.000121684 )
------------------------------------------------------------
#Fit statistic : Chi-Squared =          62.61 using 59 PHA bins.
# Reduced chi-squared =          1.098 for     57 degrees of freedom
# Null hypothesis probability =   2.841058e-01

Photon flux (15-150 keV)    in 162.8 sec: 0.120712 ( -0.014492  0.0145149 ) ph/cm2/s
Energy fluence (15-150 keV)             : 1.52739e-06 ( -2.16558e-07  2.20596e-07 ) ergs/cm2
Cutoff power-law model

Spectral model in the cutoff power-law:
------------------------------------------------------------
Parameters  : value       lower 90%   higher 90%
Photon index: 2.23058     (     )
Epeak [keV] : 83.3215      (   )
Norm@50keV  : 3.56757E-04    (     )
------------------------------------------------------------
#Fit statistic : Chi-Squared =          60.95 using 59 PHA bins.
# Reduced chi-squared =          1.088 for     56 degrees of freedom
# Null hypothesis probability =   3.024972e-01

Photon flux (15-150 keV)    in 162.8 sec: 0.120803 ( -0.014644  0.014399 ) ph/cm2/s
Energy fluence (15-150 keV)             : 1.51742e-06 ( -2.08166e-07  2.27927e-07 ) ergs/cm2
Band function

Spectral model in the Band function:
------------------------------------------------------------
Parameters  : value       lower 90%   higher 90%
alpha       : -1.26645   ( 1.26645   1.26645 )
beta        : -1.44784    ( 1.44784   0.226217 )
Epeak [keV] : 27.4135      ( -27.4135 -27.4135 )
Norm@50keV   : 1.68823E-03    ( -0.000825322   188.602 )
------------------------------------------------------------
#Fit statistic : Chi-Squared =          62.61 using 59 PHA bins.
# Reduced chi-squared =          1.138 for     55 degrees of freedom
# Null hypothesis probability =   2.244995e-01

Photon flux (15-150 keV)    in 162.8 sec:  (    ) ph/cm2/s
Energy fluence (15-150 keV)             : 0 ( 0  0 ) ergs/cm2
S(25-50 keV) vs. S(50-100 keV) plot

S(25-50 keV)  = 3.68e-07
S(50-100 keV) = 5.40e-07
T90 vs. Hardness ratio plot

T90                                   = 142.988000005484 sec.
Hardness ratio (energy fluence ratio) = 1.46739
Color vs. Color plot
Count Ratio  (25-50 keV) / (15-25 keV) = 1.23281
Count Ratio (50-100 keV) / (15-25 keV) = 1.02216
Mask shadow pattern

IMX = 4.148834867826598E-02, IMY = -4.786129414824871E-01
TIME vs. PHA plot around the trigger time
Blue+Cyan dotted lines: Time interval of the scaled map
From 0.000000 to 4.096000
TIME vs. DetID plot around the trigger time

Blue+Cyan dotted lines: Time interval of the scaled map
From 0.000000 to 4.096000
100 us light curve (15-350 keV)

Blue+Cyan dotted lines: Time interval of the scaled map
From 0.000000 to 4.096000
Spacecraft aspect plot

Bright source in the pre-burst/pre-slew/post-slew images
Pre-burst image of 15-350 keV band
Time interval of the image:
-239.728000 -96.216000

# RAcent  DECcent POSerr Theta    Phi  PeakCts   SNR AngSep     Name
#  [deg]    [deg]    ['] [deg]  [deg]                   [']
316.7616  82.0426    3.2  55.3 -168.3   1.6493   3.7 ------	UNKNOWN
326.5259  83.5243    2.7  54.5 -166.2   1.8543   4.2 ------	UNKNOWN
284.5800  83.5486    2.9  59.1 -166.1   3.5918   3.9 ------	UNKNOWN
Pre-slew background subtracted image of 15-350 keV band
Time interval of the image:
-96.216000 66.548000

# RAcent  DECcent POSerr Theta    Phi  PeakCts   SNR AngSep     Name
#  [deg]    [deg]    ['] [deg]  [deg]                   [']
  8.2576  19.4701    1.3  25.7   85.0   2.4642   9.2 ------	UNKNOWN
105.8565  81.1773    2.4  54.8 -148.6   3.9830   4.9 ------	UNKNOWN
Post-slew image of 15-350 keV band
Time interval of the image:
289.772600 962.281600

# RAcent  DECcent POSerr Theta    Phi  PeakCts   SNR AngSep     Name
#  [deg]    [deg]    ['] [deg]  [deg]                   [']
135.6480 -40.4694    4.5  54.6 -165.6  -3.3917  -2.6    7.5	Vela X-1
181.8044 -35.9041    3.1  49.6  148.5   6.2771   3.7 ------	UNKNOWN
156.1128 -22.5913    2.8  32.1  178.6   1.6248   4.1 ------	UNKNOWN
133.4573   7.1635    2.6  26.5 -100.8   2.1513   4.4 ------	UNKNOWN
Plot creation:
Sun May 31 07:02:58 EDT 2015