Click here for the BAT GCN circular template
Image
Pre-slew 15.0-350.0 keV image (Event data)
#   RAcent    DECcent   POSerr    Theta     Phi              Peak Cts       SNR   Name
  121.6993   -13.9858   0.0093    38.0321  -134.6840         5.9565465     20.709 TRIG_00317888

Foreground time interval of the image:
-105.516  50.024 (delta_t = 155.540 [sec])
Background time interval of the image:
-239.600 -105.516 (delta_t = 134.084 [sec])
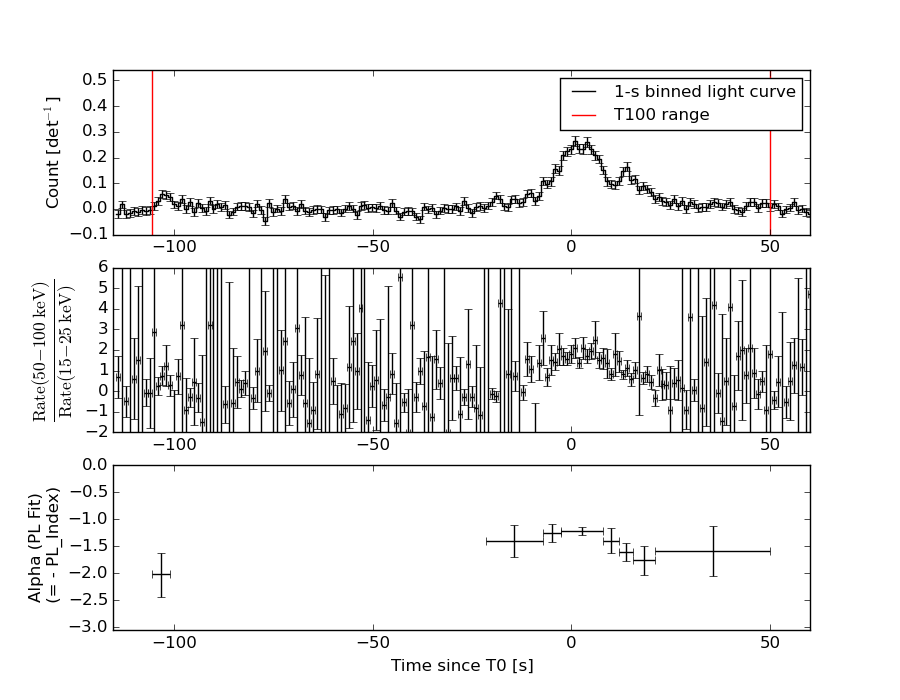
Lightcurves
Notes:
- 1) The mask-weighted light curves are using the flight position.
- 2) Multiple plots of different time binning/intervals are shown to cover all scenarios of short/long GRBs, rate/image triggers, and real/false positives.
- 3) For all the mask-weighted lightcurves, the y-axis units are counts/sec/det where a det is 0.4 x 0.4 = 0.16 sq cm.
- 4) The verticle lines correspond to following: green dotted lines are T50 interval, black dotted lines are T90 interval, blue solid line(s) is a spacecraft slew start time, and orange solid line(s) is a spacecraft slew end time.
- 5) Time of each bin is in the middle of the bin.
1 s binning
From T0-310 s to T0+310 s
From T100_start - 20 s to T100_end + 30 s
Full time interval
64 ms binning
Full time interval
From T100_start to T100_end
From T0-5 sec to T0+5 sec
16 ms binning
From T100_start-5 s to T100_start+5 s
Blue+Cyan dotted lines: Time interval of the scaled map
From 0.000000 to 1.024000
8 ms binning
From T100_start-3 s to T100_start+3 s
Blue+Cyan dotted lines: Time interval of the scaled map
From 0.000000 to 1.024000
2 ms binning
From T100_start-1 s to T100_start+1 s
Blue+Cyan dotted lines: Time interval of the scaled map
From 0.000000 to 1.024000
SN=5 or 10 sec. binning (whichever binning is satisfied first)
SN=5 or 10 sec. binning (T < 200 sec)
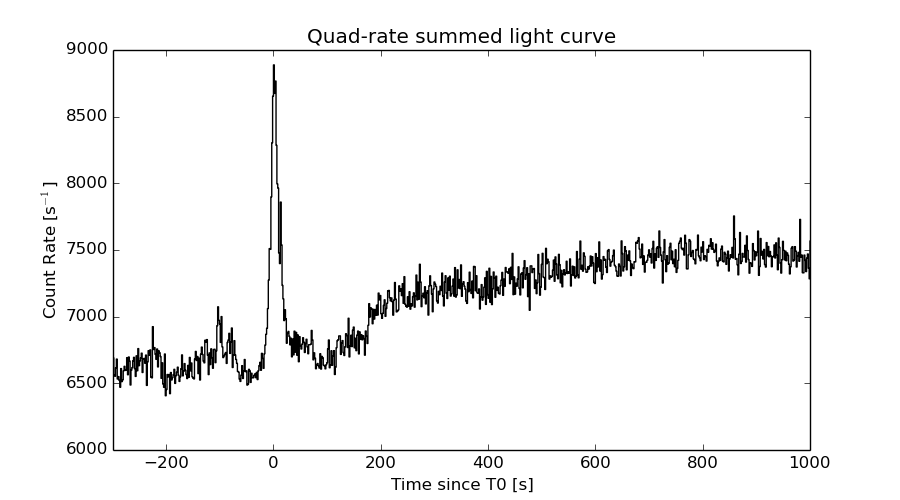
Quad-rate summed light curves (from T0-300s to T0+1000s)
Spectral Evolution
Spectra
Notes:
- 1) The fitting includes the systematic errors.
- 2) When the burst includes telescope slew time periods, the fitting uses an average response file made from multiple 5-s response files through out the slew time plus single time preiod for the non-slew times, and weighted by the total counts in the corresponding time period using addrmf. An average response file is needed becuase a spectral fit using the pre-slew DRM will introduce some errors in both a spectral shape and a normalization if the PHA file contains a lot of the slew/post-slew time interval.
- 3) For fits to more complicated models (e.g. a power-law over a cutoff power-law), the BAT team has decided to require a chi-square improvement of more than 6 for each extra dof.
Time averaged spectrum fit using the average DRM
Power-law model
Time interval is from -105.516 sec. to   50.024 sec.

Spectral model in power-law:
------------------------------------------------------------
Parameters  : value       lower 90%   higher 90%
Photon index: 1.42058     ( -0.0985692   0.0981488 )
Norm@50keV  : 2.57467E-03    ( -0.000140589   0.000140526 )
------------------------------------------------------------
#Fit statistic : Chi-Squared =          38.44 using 59 PHA bins.
# Reduced chi-squared =         0.6743 for     57 degrees of freedom
# Null hypothesis probability =   9.719174e-01

Photon flux (15-150 keV)    in 155.5 sec: 0.315043 ( -0.0182096  0.0182671 ) ph/cm2/s
Energy fluence (15-150 keV)             : 3.85265e-06 ( -2.27187e-07  2.28252e-07 ) ergs/cm2
Cutoff power-law model

Time interval is from -105.516 sec. to   50.024 sec.
Spectral model in the cutoff power-law:
------------------------------------------------------------
Parameters  : value       lower 90%   higher 90%
Photon index: 1.35157     ( -0.363867   0.135824 )
Epeak [keV] : 461.004      ( -739.573 -739.573 )
Norm@50keV  : 2.77854E-03    ( -0.000252855   0.00126411 )
------------------------------------------------------------
#Fit statistic : Chi-Squared =          38.45 using 59 PHA bins.
# Reduced chi-squared =         0.6867 for     56 degrees of freedom
# Null hypothesis probability =   9.646188e-01

Photon flux (15-150 keV)    in 155.5 sec: 0.314128 ( -0.018788  0.018844 ) ph/cm2/s
Energy fluence (15-150 keV)             : 3.84166e-06 ( -2.38786e-07  2.37993e-07 ) ergs/cm2
Band function
Time interval is from -105.516 sec. to   50.024 sec.

Spectral model in the Band function:
------------------------------------------------------------
Parameters  : value       lower 90%   higher 90%
alpha       : 4.91737   ( -5.66021   -4.91737 )
beta        : -1.48959    ( -0.123445   0.110341 )
Epeak [keV] : 25.2153      ( -9.7738 3.36342 )
Norm@50keV   : 208.573    ( -11.3377   1001.17 )
------------------------------------------------------------
#Fit statistic : Chi-Squared =          34.78 using 59 PHA bins.
# Reduced chi-squared =         0.6324 for     55 degrees of freedom
# Null hypothesis probability =   9.848778e-01

Photon flux (15-150 keV)    in 155.5 sec: 0.310743 ( 6.68926  -0.018873 ) ph/cm2/s
Energy fluence (15-150 keV)             : 0 ( 0  0 ) ergs/cm2
Single BB
Spectral model blackbody:
------------------------------------------------------------
Parameters  : value    Lower 90%  Upper 90%
kT [keV]    : 17.3775  (  )
R^2/D10^2   : 2.12185E-02  (   )
(R is the radius in km and D10 is the distance to the source in units of 10 kpc)
------------------------------------------------------------
#Fit statistic : Chi-Squared =         132.15 using 59 PHA bins.
# Reduced chi-squared =         2.3184 for     57 degrees of freedom
# Null hypothesis probability =   6.656013e-08

Energy  Fluence     90% Error
[keV]   [erg/cm2]   [erg/cm2]
15- 25  2.017e-07   2.301e-08
25- 50  9.079e-07   7.526e-08
50-150  1.971e-06   1.850e-07
15-150  3.080e-06   2.301e-07
Thermal bremsstrahlung (OTTB)
Spectral model: thermal bremsstrahlung
------------------------------------------------------------
Parameters  : value         Lower 90%    Upper 90%
kT [keV]    : 200.000       (      )
Norm        : 1.30697       (-0.071495     0.0714858)
------------------------------------------------------------
#Fit statistic : Chi-Squared =          45.88 using 59 PHA bins.
# Reduced chi-squared =         0.8050 for     57 degrees of freedom
# Null hypothesis probability =   8.540985e-01

Energy  Fluence     90% Error
[keV]   [erg/cm2]   [erg/cm2]
15- 25  5.062e-07   3.320e-08
25- 50  9.737e-07   5.940e-08
50-150  2.136e-06   3.980e-07
15-150  3.616e-06   4.292e-07
Double BB
Spectral model: bbodyrad<1> + bbodyrad<2>
------------------------------------------------------------
Parameters  : value         Lower 90%    Upper 90%
kT1 [keV]   : 6.68217        (-0.930009      1.09079)
R1^2/D10^2  : 0.391785        (-0.163689      0.293113)
kT2 [keV]   : 29.1630        (-4.00333      5.8423)
R2^2/D10^2  : 3.09518E-03    (-0.00139116   0.00203708)
------------------------------------------------------------
#Fit statistic : Chi-Squared =          32.06 using 59 PHA bins.
# Reduced chi-squared =         0.5830 for     55 degrees of freedom
# Null hypothesis probability =   9.943059e-01

Energy  Fluence     90% Error
[keV]   [erg/cm2]   [erg/cm2]
15- 25  4.805e-07   1.025e-07
25- 50  9.161e-07   1.482e-07
50-150  2.484e-06   4.844e-07
15-150  3.880e-06   6.772e-07
Peak spectrum fit
Power-law model

Time interval is from    3.548 sec. to    4.548 sec.

Spectral model in power-law:
------------------------------------------------------------
Parameters  : value       lower 90%   higher 90%
Photon index: 1.30006     ( -0.176997   0.176604 )
Norm@50keV  : 1.96657E-02    ( -0.00209386   0.00209153 )
------------------------------------------------------------
#Fit statistic : Chi-Squared =          70.07 using 59 PHA bins.
# Reduced chi-squared =          1.229 for     57 degrees of freedom
# Null hypothesis probability =   1.145962e-01

Photon flux (15-150 keV)    in 1 sec: 2.34619 ( -0.255118  0.255563 ) ph/cm2/s
Energy fluence (15-150 keV)             : 1.94329e-07 ( -2.27698e-08  2.29409e-08 ) ergs/cm2
Cutoff power-law model
Time interval is from    3.548 sec. to    4.548 sec.
Spectral model in the cutoff power-law:
------------------------------------------------------------
Parameters  : value       lower 90%   higher 90%
Photon index: 0.497443     ( -0.874049   0.72741 )
Epeak [keV] : 100.433      ( -27.9815 343.185 )
Norm@50keV  : 4.73573E-02    ( -0.0255862   0.0703118 )
------------------------------------------------------------
#Fit statistic : Chi-Squared =          66.47 using 59 PHA bins.
# Reduced chi-squared =          1.187 for     56 degrees of freedom
# Null hypothesis probability =   1.597253e-01

Photon flux (15-150 keV)    in 1 sec: 2.27348 ( -0.26536  0.26437 ) ph/cm2/s
Energy fluence (15-150 keV)             : 1.86373e-07 ( -2.4243e-08  2.4343e-08 ) ergs/cm2
Band function
Time interval is from    3.548 sec. to    4.548 sec.

Spectral model in the Band function:
------------------------------------------------------------
Parameters  : value       lower 90%   higher 90%
alpha       : -0.526922   ( -0.432552   0.669331 )
beta        : -9.37167    ( 9.37167   19.3717 )
Epeak [keV] : 102.903      ( -43.847 222.549 )
Norm@50keV   : 4.56615E-02    ( -0.0238188   0.0305136 )
------------------------------------------------------------
#Fit statistic : Chi-Squared =          66.47 using 59 PHA bins.
# Reduced chi-squared =          1.209 for     55 degrees of freedom
# Null hypothesis probability =   1.381468e-01

Photon flux (15-150 keV)    in 1 sec: 2.27705 (    ) ph/cm2/s
Energy fluence (15-150 keV)             : 0 ( 0  0 ) ergs/cm2
Single BB
Spectral model blackbody:
------------------------------------------------------------
Parameters  : value    Lower 90%  Upper 90%
kT [keV]    : 17.9751  (-2.16033  2.51904)
R^2/D10^2   : 0.154168  (-0.0552161   0.0835857)
(R is the radius in km and D10 is the distance to the source in units of 10 kpc)
------------------------------------------------------------
#Fit statistic : Chi-Squared =          76.70 using 59 PHA bins.
# Reduced chi-squared =          1.346 for     57 degrees of freedom
# Null hypothesis probability =   4.200108e-02

Energy  Fluence     90% Error
[keV]   [erg/cm2]   [erg/cm2]
15- 25  9.978e-09   2.060e-09
25- 50  4.610e-08   7.530e-09
50-150  1.081e-07   2.158e-08
15-150  1.641e-07   2.475e-08
Thermal bremsstrahlung (OTTB)
Spectral model: thermal bremsstrahlung
------------------------------------------------------------
Parameters  : value         Lower 90%    Upper 90%
kT [keV]    : 200.000       (      )
Norm        : 9.74648       (-1.04214     1.04208)
------------------------------------------------------------
#Fit statistic : Chi-Squared =          73.77 using 59 PHA bins.
# Reduced chi-squared =          1.294 for     57 degrees of freedom
# Null hypothesis probability =   6.688376e-02

Energy  Fluence     90% Error
[keV]   [erg/cm2]   [erg/cm2]
15- 25  2.427e-08   1.342e-08
25- 50  4.668e-08   2.548e-08
50-150  1.024e-07   5.555e-08
15-150  1.733e-07   9.141e-08
Double BB
Spectral model: bbodyrad<1> + bbodyrad<2>
------------------------------------------------------------
Parameters  : value         Lower 90%    Upper 90%
kT1 [keV]   : 6.01479        (-2.33446      3.46483)
R1^2/D10^2  : 2.73686        (-2.12685      16.6891)
kT2 [keV]   : 22.8836        (-4.03493      7.29013)
R2^2/D10^2  : 6.00217E-02    (-0.0388697   0.0522218)
------------------------------------------------------------
#Fit statistic : Chi-Squared =          64.92 using 59 PHA bins.
# Reduced chi-squared =          1.180 for     55 degrees of freedom
# Null hypothesis probability =   1.692440e-01

Energy  Fluence     90% Error
[keV]   [erg/cm2]   [erg/cm2]
15- 25  1.891e-08   9.657e-09
25- 50  4.413e-08   1.814e-08
50-150  1.221e-07   5.647e-08
15-150  1.851e-07   8.270e-08
Pre-slew spectrum (Pre-slew PHA with pre-slew DRM)
Power-law model
Spectral model in power-law:
------------------------------------------------------------
Parameters  : value       lower 90%   higher 90%
Photon index: 1.42058     ( -0.0985692   0.0981488 )
Norm@50keV  : 2.57467E-03    ( -0.000140589   0.000140526 )
------------------------------------------------------------
#Fit statistic : Chi-Squared =          38.44 using 59 PHA bins.
# Reduced chi-squared =         0.6743 for     57 degrees of freedom
# Null hypothesis probability =   9.719174e-01

Photon flux (15-150 keV)    in 155.5 sec: 0.315043 ( -0.0182096  0.0182671 ) ph/cm2/s
Energy fluence (15-150 keV)             : 3.85265e-06 ( -2.27187e-07  2.28252e-07 ) ergs/cm2
Cutoff power-law model

Spectral model in the cutoff power-law:
------------------------------------------------------------
Parameters  : value       lower 90%   higher 90%
Photon index: 1.35157     ( -0.363867   0.135824 )
Epeak [keV] : 461.004      ( -739.573 -739.573 )
Norm@50keV  : 2.77854E-03    ( -0.000252855   0.00126411 )
------------------------------------------------------------
#Fit statistic : Chi-Squared =          38.45 using 59 PHA bins.
# Reduced chi-squared =         0.6867 for     56 degrees of freedom
# Null hypothesis probability =   9.646188e-01

Photon flux (15-150 keV)    in 155.5 sec: 0.314128 ( -0.018788  0.018844 ) ph/cm2/s
Energy fluence (15-150 keV)             : 3.84166e-06 ( -2.38786e-07  2.37993e-07 ) ergs/cm2
Band function

Spectral model in the Band function:
------------------------------------------------------------
Parameters  : value       lower 90%   higher 90%
alpha       : 4.91737   ( -13.538   -4.91737 )
beta        : -1.48959    ( -0.123445   0.110341 )
Epeak [keV] : 25.2153      ( -9.7738 3.36342 )
Norm@50keV   : 208.573    ( -11.3377   1001.17 )
------------------------------------------------------------
#Fit statistic : Chi-Squared =          34.78 using 59 PHA bins.
# Reduced chi-squared =         0.6324 for     55 degrees of freedom
# Null hypothesis probability =   9.848778e-01

Photon flux (15-150 keV)    in 155.5 sec: 0.310743 ( 6.68926  -0.018873 ) ph/cm2/s
Energy fluence (15-150 keV)             : 0 ( 0  0 ) ergs/cm2
S(25-50 keV) vs. S(50-100 keV) plot
S(25-50 keV)  = 9.15e-07
S(50-100 keV) = 1.37e-06
T90 vs. Hardness ratio plot
T90                                   = 92.7360000014305 sec.
Hardness ratio (energy fluence ratio) = 1.49727
Color vs. Color plot
Count Ratio  (25-50 keV) / (15-25 keV) = 1.45031
Count Ratio (50-100 keV) / (15-25 keV) = 1.26861
Mask shadow pattern
IMX = -5.500314165766547E-01, IMY = 5.561327987189398E-01
TIME vs. PHA plot around the trigger time
Blue+Cyan dotted lines: Time interval of the scaled map
From 0.000000 to 1.024000
TIME vs. DetID plot around the trigger time
Blue+Cyan dotted lines: Time interval of the scaled map
From 0.000000 to 1.024000
100 us light curve (15-350 keV)
Blue+Cyan dotted lines: Time interval of the scaled map
From 0.000000 to 1.024000
Spacecraft aspect plot
Bright source in the pre-burst/pre-slew/post-slew images
Pre-burst image of 15-350 keV band
Time interval of the image:
-239.600000 -105.516000

# RAcent  DECcent POSerr Theta    Phi  PeakCts   SNR AngSep     Name
#  [deg]    [deg]    ['] [deg]  [deg]                   [']
135.5361 -40.5661    0.7  22.3  173.4   2.0133  16.6    0.8	Vela X-1
170.6190 -60.6993    6.1  32.1  109.1   0.4568   1.9   10.0	Cen X-3
186.7087 -62.7416    5.5  37.7   99.4   0.7990   2.1    2.2	GX 301-2
183.8097 -33.3999    2.1  21.2   46.4   0.7306   5.5 ------	UNKNOWN
168.4946  10.5909    2.6  41.0  -46.7   1.0077   4.4 ------	UNKNOWN
135.5652   4.6658    3.8  41.1  -98.2   2.1673   3.0 ------	UNKNOWN
Pre-slew background subtracted image of 15-350 keV band
Time interval of the image:
-105.516000 50.024000

# RAcent  DECcent POSerr Theta    Phi  PeakCts   SNR AngSep     Name
#  [deg]    [deg]    ['] [deg]  [deg]                   [']
135.4364 -40.6276    7.1  22.4  173.3  -0.2874  -1.6    6.1	Vela X-1
170.3370 -60.4357    0.0  31.8  109.2   0.2180   0.7   11.3	Cen X-3
186.7061 -62.7109   70.8  37.6   99.3   0.0868   0.2    3.8	GX 301-2
214.4771 -20.0166    2.2  50.5   32.0   4.6692   5.3 ------	UNKNOWN
161.1943   3.4430    2.3  33.0  -57.1   1.2809   4.9 ------	UNKNOWN
121.6993 -13.9858    0.6  38.0 -134.7   5.9561  20.7 ------	UNKNOWN
Post-slew image of 15-350 keV band
Time interval of the image:
200.500600 962.462500

# RAcent  DECcent POSerr Theta    Phi  PeakCts   SNR AngSep     Name
#  [deg]    [deg]    ['] [deg]  [deg]                   [']
244.9770 -15.6313    0.3  20.3   81.4  25.3777  40.7    0.6	Sco X-1
254.4593  35.3413  166.4  54.9    7.9  -0.1567  -0.1    0.1	Her X-1
256.0093 -37.8598    2.2  38.4  116.3   8.1920   5.2    1.4	4U 1700-377
256.4339 -36.4230    6.6  37.9  114.1   2.6935   1.7    0.1	GX 349+2
263.0280 -24.6297    4.9  38.7   92.9   4.3025   2.4    7.0	GX 1+4
257.1748 -11.6269    2.7  32.0   71.2   3.8953   4.3 ------	UNKNOWN
210.8993 -55.8703    2.7  45.4  168.6   4.8592   4.3 ------	UNKNOWN
203.2988  34.8927    3.6  50.7  -44.5  11.9865   3.3 ------	UNKNOWN
Plot creation:
Sun May 31 06:56:03 EDT 2015