Click here for the BAT GCN circular template
Image
Pre-slew 15-350 keV image (Event data; bkg subtracted)

#   RAcent  DECcent POSerr  Theta    Phi     Peak Cts     SNR  Name
  255.4026 -40.8519 0.0226   38.0 -167.3       0.3957     8.6  TRIG_00318166
------------------------------------------

Foreground time interval of the image:
 -2.816   6.184 (delta_t =   9.000 [sec])
Background time interval of the image:
-202.615 -13.966 (delta_t = 188.649 [sec])
-12.816  -2.816 (delta_t =  10.000 [sec])
Lightcurves
Notes:
- 1) All plots contain as much data as has been downloaded to date.
- 2) Multiple plots of different time binning/intervals are shown to cover all scenarios of short/long GRBs, rate/image triggers, and real/false positives.
- 3) For all the mask-weighted lightcurves, the y-axis units are counts/sec/det where a det is 0.4 x 0.4 = 0.16 sq cm.
- 4) The verticle lines correspond to following: green dotted lines are T50 interval, black dotted lines are T90 interval, blue solid line(s) is a spacecraft slew start time, and orange solid line(s) is a spacecraft slew end time.
- 5) Time of each bin is in the middle of the bin.
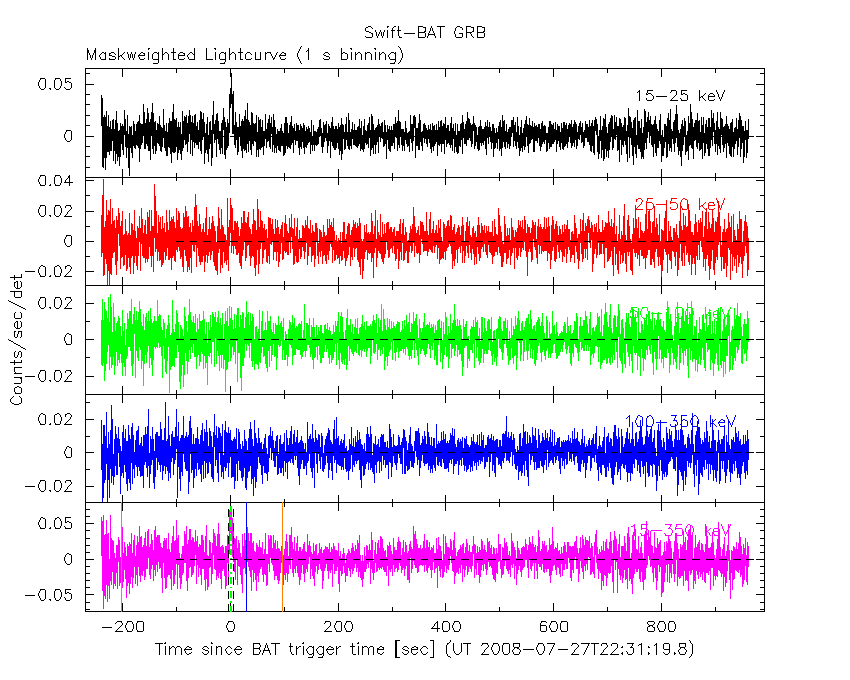
1 s binning
From T0-310 s to T0+310 s

From T100_start - 20 s to T100_end + 30 s
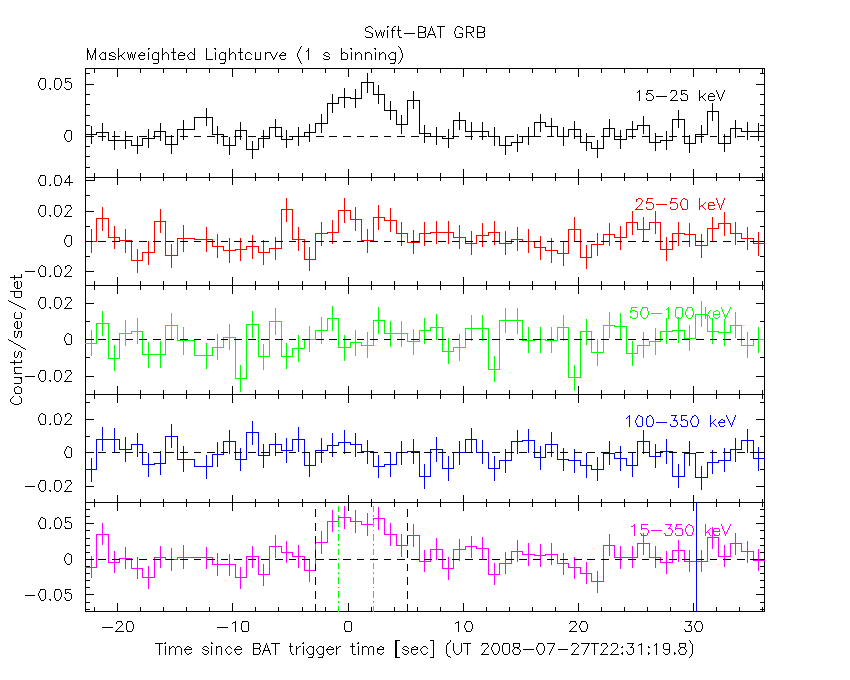
Full time interval
64 ms binning
Full time interval

From T100_start to T100_end
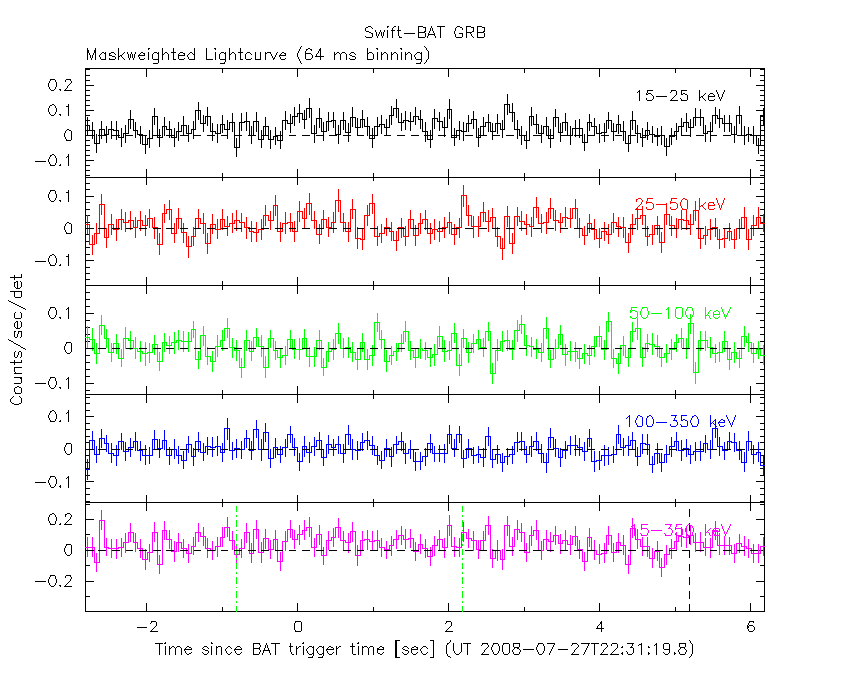
From T0-5 sec to T0+5 sec

16 ms binning
From T100_start-5 s to T100_start+5 s

Blue+Cyan dotted lines: Time interval of the scaled map
From 0.000000 to 2.048000
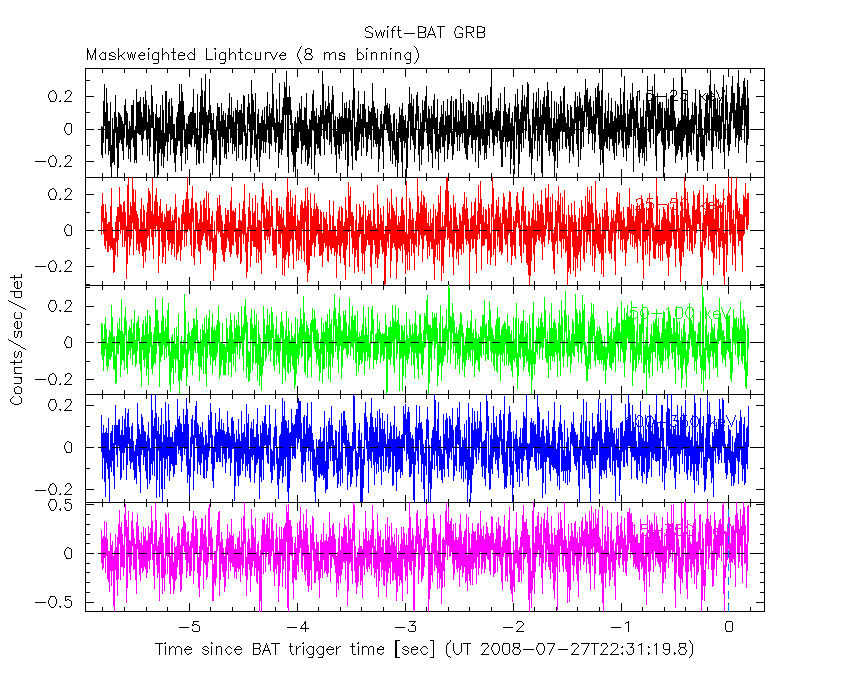
8 ms binning
From T100_start-3 s to T100_start+3 s
Blue+Cyan dotted lines: Time interval of the scaled map
From 0.000000 to 2.048000
2 ms binning
From T100_start-1 s to T100_start+1 s

Blue+Cyan dotted lines: Time interval of the scaled map
From 0.000000 to 2.048000
SN=5 or 10 sec. binning (whichever binning is satisfied first)

SN=5 or 10 sec. binning (T < 200 sec)

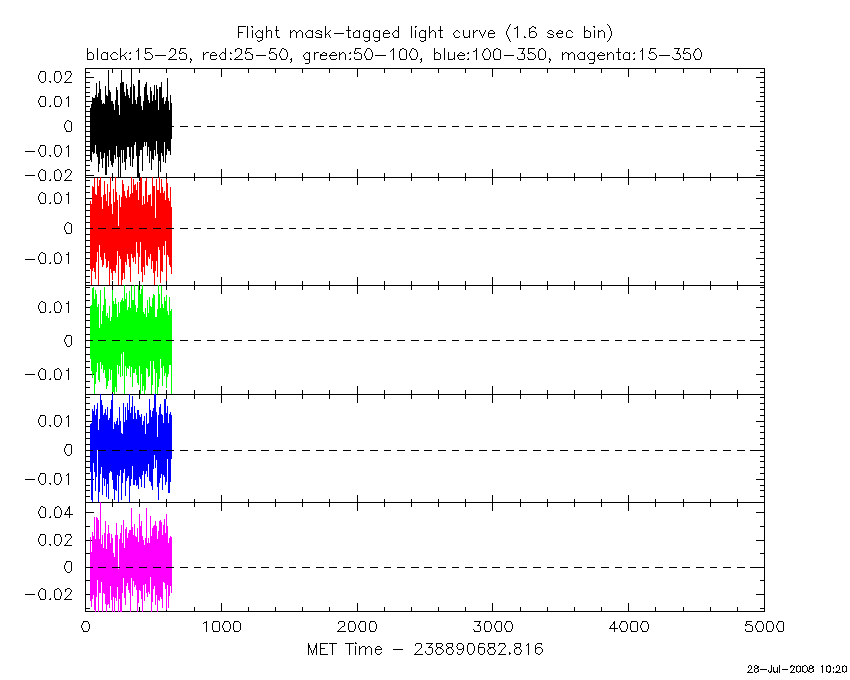
Flight mask-tagged light curves
Caution: Mask-weight map is always using the same on-axis map


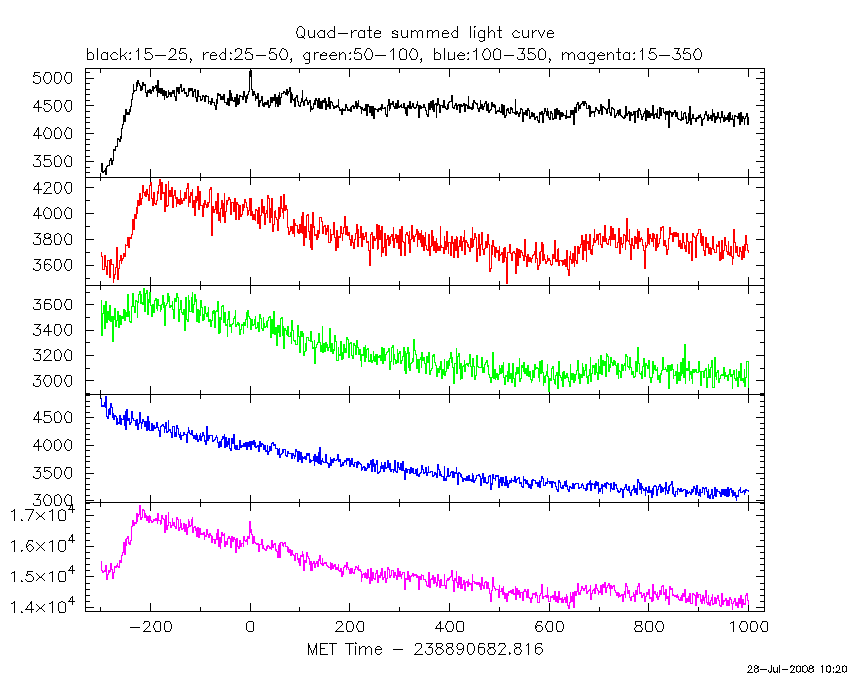
Quad-rate summed light curves (from T0-300 to T0+1000)
Spectra
Notes:
- 1) The fitting includes the systematic errors.
- 2) For long bursts, a spectral fit of the pre-slew DRM will introduce some errors in both a spectral shape and a normalization if the PHA file contains a lot of the slew/post-slew time interval.
- 3) For fits to more complicated models (e.g. a power-law over a cutoff power-law), the BAT team has decided to require a chi-square improvement of more than 6 for each extra dof.
- 4) For short bursts (T90<1sec), the specrtum is also fit with Blackbody, OTTB, and Double Blackbody.
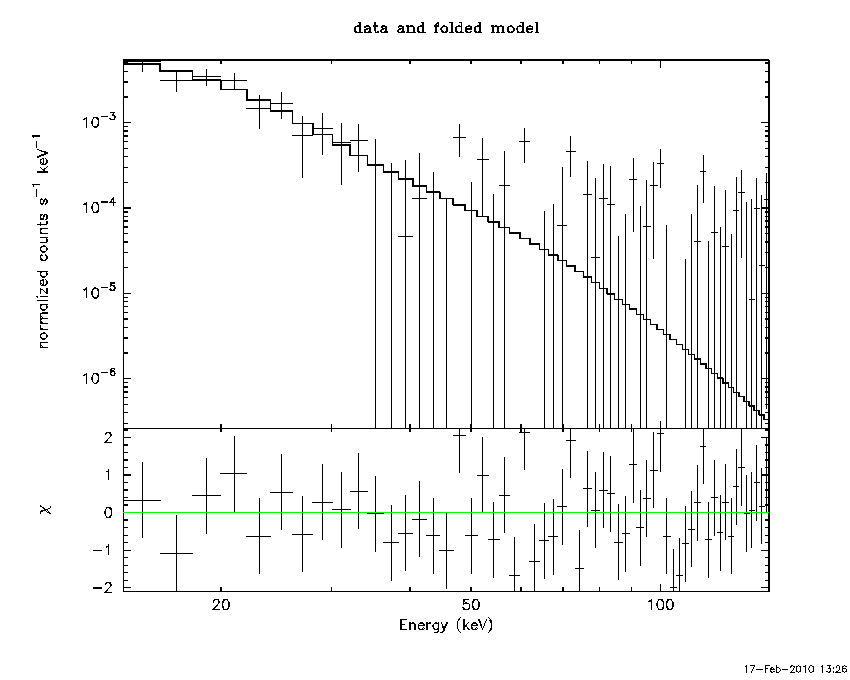
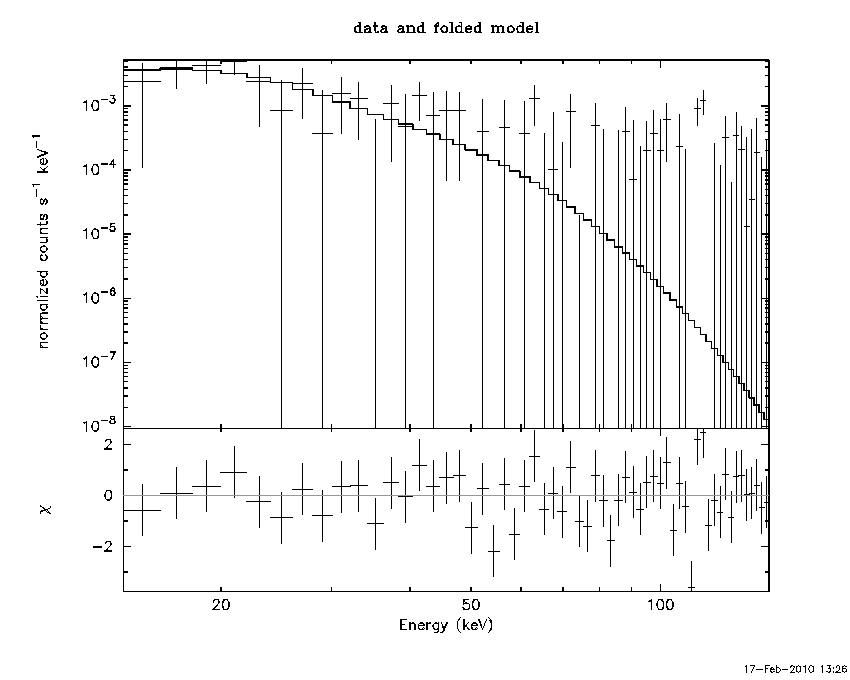
Time averaged spectrum fit using the pre-slew DRM
Power-law model

Time interval is from   -2.816 sec. to    6.184 sec.

Spectral model in power-law:
------------------------------------------------------------
Parameters  : value       lower 90%   higher 90%
Photon index: 4.05428     ( -0.604015   0.72865 )
Norm@50keV  : 6.93537E-04    ( -0.000693537   0.000495488 )
------------------------------------------------------------
# Chi-Squared =          54.70 using 59 PHA bins.
# Reduced chi-squared =         0.9597 for     57 degrees of freedom
# Null hypothesis probability =   5.617957e-01

Photon flux (15-150 keV)    in 9 sec: 0.448501 ( -0.0752568  0.075334 ) ph/cm2/s
Energy fluence (15-150 keV)             : 1.43068e-07 ( -2.79357e-08  2.99112e-08 ) ergs/cm2
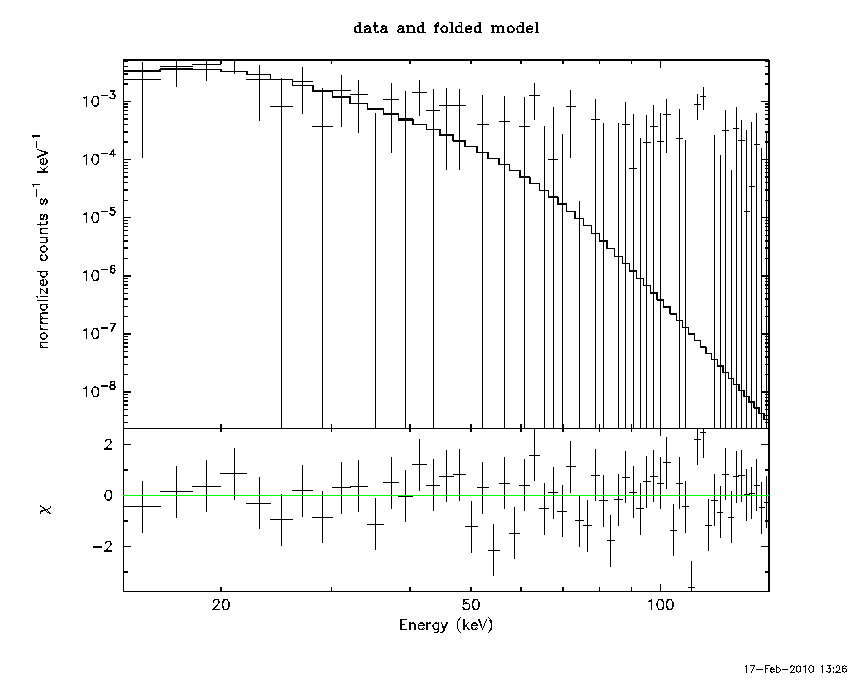
Cutoff power-law model

Time interval is from   -2.816 sec. to    6.184 sec.
Spectral model in the cutoff power-law:
------------------------------------------------------------
Parameters  : value       lower 90%   higher 90%
Photon index: 1.79747     (     )
Epeak [keV] : 2.07793      (   )
Norm@50keV  : 4.11984E-02    (     )
------------------------------------------------------------
# Chi-Squared =          54.68 using 59 PHA bins.
# Reduced chi-squared =         0.9764 for     56 degrees of freedom
# Null hypothesis probability =   5.249577e-01

Photon flux (15-150 keV)    in 9 sec: 0.448212 ( -0.075216  0.075294 ) ph/cm2/s
Energy fluence (15-150 keV)             : 1.43042e-07 ( -2.79369e-08  2.99088e-08 ) ergs/cm2
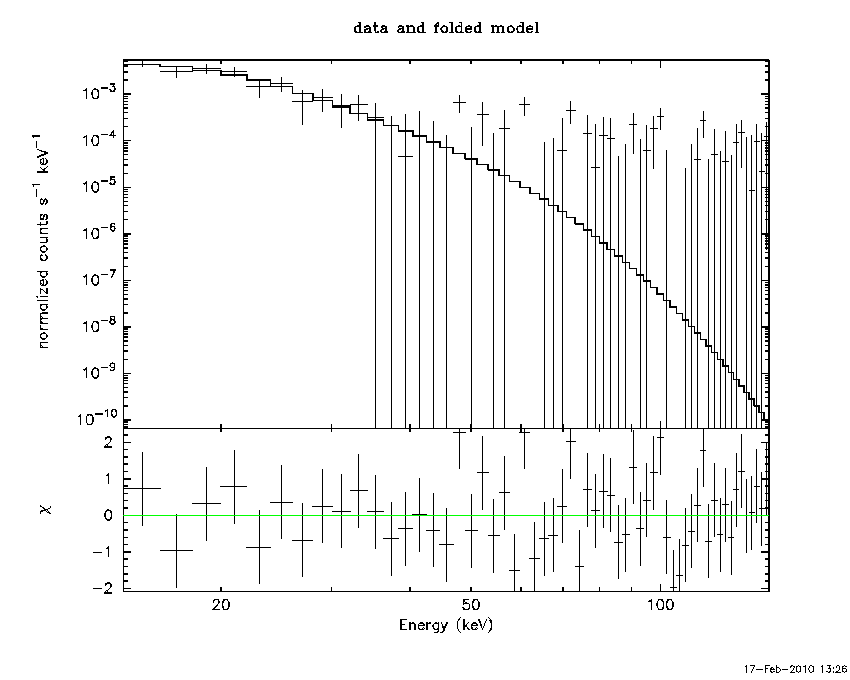
Band function
Time interval is from   -2.816 sec. to    6.184 sec.

Spectral model in the Band function:
------------------------------------------------------------
Parameters  : value       lower 90%   higher 90%
alpha       : -5.11312   ( 0.822496   3.51324 )
beta        : -4.05427    ( -0.728313   0.603432 )
Epeak [keV] : 17.0218      ( -17.0218 -17.0218 )
Norm@50keV   : 9.42615E-02    ( -0.0487244   0.0673408 )
------------------------------------------------------------
# Chi-Squared =          54.70 using 59 PHA bins.
# Reduced chi-squared =         0.9946 for     55 degrees of freedom
# Null hypothesis probability =   4.859813e-01

Photon flux (15-150 keV)    in 9 sec: 0.449030 ( -0.07474  0.074738 ) ph/cm2/s
Energy fluence (15-150 keV)             : 1.4086e-07 ( -2.5974e-08  3.09591e-08 ) ergs/cm2
Peak spectrum fit
Power-law model
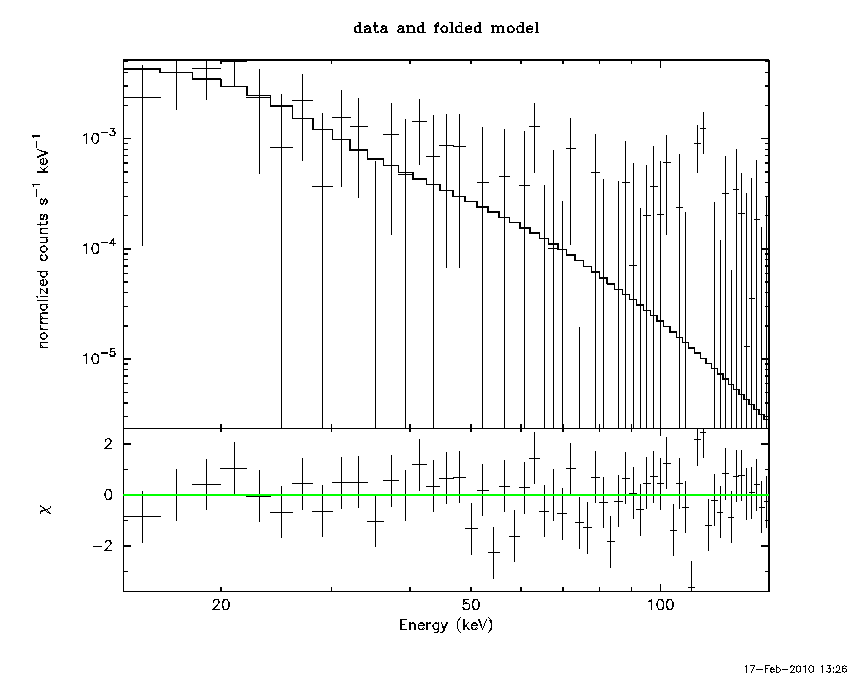
Time interval is from   -0.816 sec. to    0.184 sec.

Spectral model in power-law:
------------------------------------------------------------
Parameters  : value       lower 90%   higher 90%
Photon index: 3.08247     ( -0.798439   1.13196 )
Norm@50keV  : 1.95626E-03    ( -0.00195627   0.0016762 )
------------------------------------------------------------
# Chi-Squared =          62.68 using 59 PHA bins.
# Reduced chi-squared =          1.100 for     57 degrees of freedom
# Null hypothesis probability =   2.817766e-01

Photon flux (15-150 keV)    in 1 sec: 0.571543 ( -0.207611  0.208747 ) ph/cm2/s
Energy fluence (15-150 keV)             : 2.44396e-08 ( -1.03864e-08  1.20294e-08 ) ergs/cm2
Cutoff power-law model
Time interval is from   -0.816 sec. to    0.184 sec.
Spectral model in the cutoff power-law:
------------------------------------------------------------
Parameters  : value       lower 90%   higher 90%
Photon index: 1.01679     ( -0.979203   1.01491 )
Epeak [keV] : 13.5888      (   )
Norm@50keV  : 5.89730E-02    (     )
------------------------------------------------------------
# Chi-Squared =          61.63 using 59 PHA bins.
# Reduced chi-squared =          1.100 for     56 degrees of freedom
# Null hypothesis probability =   2.818376e-01

Photon flux (15-150 keV)    in 1 sec: 0.566370 ( -0.200376  0.201947 ) ph/cm2/s
Energy fluence (15-150 keV)             : 2.1987e-08 ( -8.521e-09  1.13003e-08 ) ergs/cm2
Band function
Time interval is from   -0.816 sec. to    0.184 sec.

Spectral model in the Band function:
------------------------------------------------------------
Parameters  : value       lower 90%   higher 90%
alpha       : 0.128723   ( 1.23486   1.23486 )
beta        : -9.99997    ( 115244   115254 )
Epeak [keV] : 18.4960      ( -10.3361 18.7265 )
Norm@50keV   : 0.403560    ( -0.361468   1148.14 )
------------------------------------------------------------
# Chi-Squared =          61.58 using 59 PHA bins.
# Reduced chi-squared =          1.120 for     55 degrees of freedom
# Null hypothesis probability =   2.524579e-01

Photon flux (15-150 keV)    in 1 sec: 0.587933 ( -0.212189  0.212555 ) ph/cm2/s
Energy fluence (15-150 keV)             : 2.24329e-08 ( -8.6289e-09  1.19392e-08 ) ergs/cm2
Pre-slew spectrum (Pre-slew PHA with pre-slew DRM)
Power-law model

Spectral model in power-law:
------------------------------------------------------------
Parameters  : value       lower 90%   higher 90%
Photon index: 4.05428     ( -0.604015   0.72865 )
Norm@50keV  : 6.93537E-04    ( -0.000693537   0.000495488 )
------------------------------------------------------------
# Chi-Squared =          54.70 using 59 PHA bins.
# Reduced chi-squared =         0.9597 for     57 degrees of freedom
# Null hypothesis probability =   5.617957e-01

Photon flux (15-150 keV)    in 9 sec: 0.448501 ( -0.0752568  0.075334 ) ph/cm2/s
Energy fluence (15-150 keV)             : 1.43068e-07 ( -2.79357e-08  2.99112e-08 ) ergs/cm2
Cutoff power-law model
Spectral model in the cutoff power-law:
------------------------------------------------------------
Parameters  : value       lower 90%   higher 90%
Photon index: 1.79747     (     )
Epeak [keV] : 2.07793      (   )
Norm@50keV  : 4.11984E-02    (     )
------------------------------------------------------------
# Chi-Squared =          54.68 using 59 PHA bins.
# Reduced chi-squared =         0.9764 for     56 degrees of freedom
# Null hypothesis probability =   5.249577e-01

Photon flux (15-150 keV)    in 9 sec: 0.448212 ( -0.075216  0.075294 ) ph/cm2/s
Energy fluence (15-150 keV)             : 1.43042e-07 ( -2.79369e-08  2.99088e-08 ) ergs/cm2
Band function

Spectral model in the Band function:
------------------------------------------------------------
Parameters  : value       lower 90%   higher 90%
alpha       : -5.11312   ( 0.822496   3.51324 )
beta        : -4.05427    ( -0.728313   0.603432 )
Epeak [keV] : 17.0218      ( -17.0218 -17.0218 )
Norm@50keV   : 9.42615E-02    ( -0.0487244   0.0673408 )
------------------------------------------------------------
# Chi-Squared =          54.70 using 59 PHA bins.
# Reduced chi-squared =         0.9946 for     55 degrees of freedom
# Null hypothesis probability =   4.859813e-01

Photon flux (15-150 keV)    in 9 sec: 0.449030 ( -0.07474  0.074738 ) ph/cm2/s
Energy fluence (15-150 keV)             : 1.4086e-07 ( -2.5974e-08  3.09591e-08 ) ergs/cm2
S(25-50 keV) vs. S(50-100 keV) plot
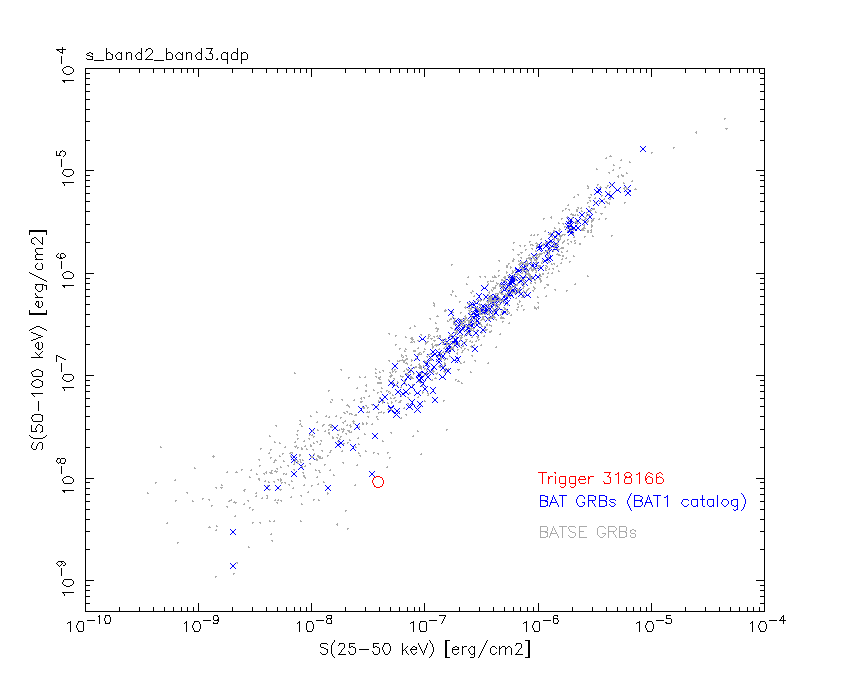
S(25-50 keV)  = 3.83731e-08
S(50-100 keV) = 9.23904e-09
T90 vs. Hardness ratio plot

T90                                   = 8 sec.
Hardness ratio (energy fluence ratio) = 0.240769
Color vs. Color plot

Count Ratio  (25-50 keV) / (15-25 keV) = 0.290434
Count Ratio (50-100 keV) / (15-25 keV) = 0.0807916
Mask shadow pattern

IMX = 0, IMY = 0
TIME vs. PHA plot around the trigger time

Blue+Cyan dotted lines: Time interval of the scaled map
From 0.000000 to 2.048000
TIME vs. DetID plot around the trigger time

Blue+Cyan dotted lines: Time interval of the scaled map
From 0.000000 to 2.048000
100 us light curve (15-350 keV)
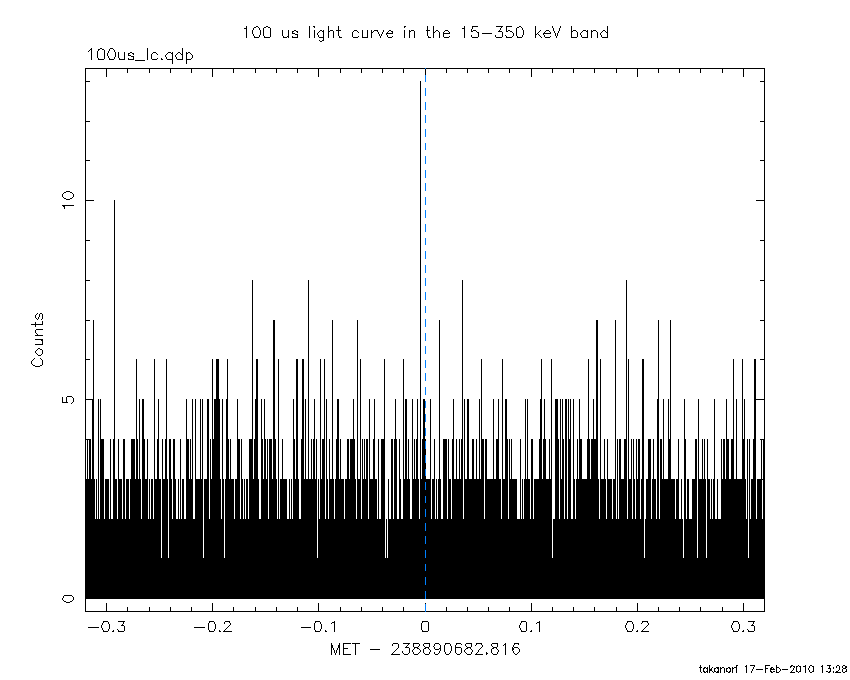
Blue+Cyan dotted lines: Time interval of the scaled map
From 0.000000 to 2.048000
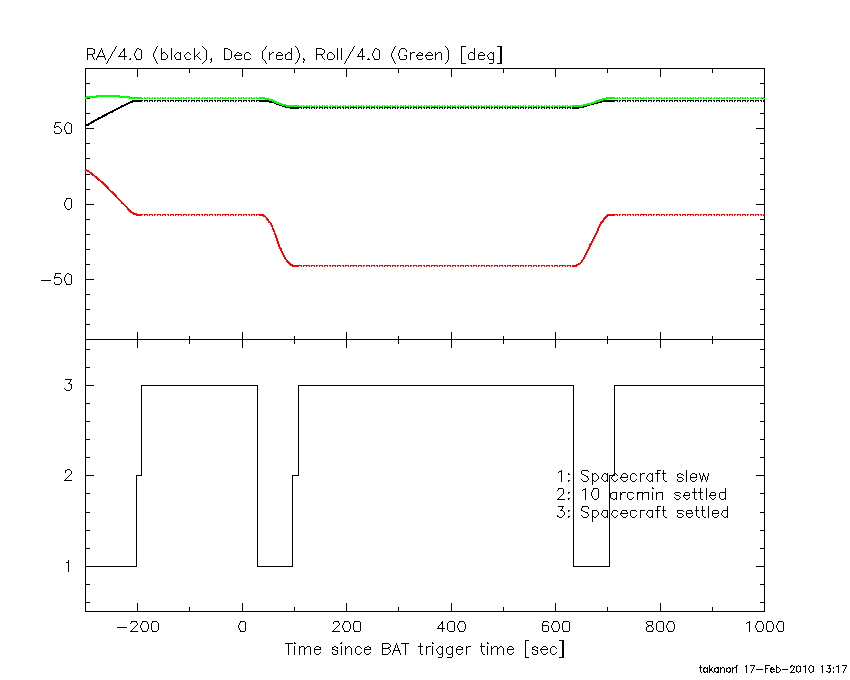
Spacecraft aspect plot
Bright source in the pre-burst/pre-slew/post-slew images
Pre-burst image of 15-350 keV band
Time interval of the image:
-202.615400 -13.966000
-12.816000 -2.816000

# RAcent  DECcent POSerr Theta    Phi  PeakCts   SNR AngSep     Name
#  [deg]    [deg]    ['] [deg]  [deg]                   [']
244.9919 -15.6448    0.4  30.2 -120.4   9.2116  30.9    0.8	Sco X-1
254.4598  35.3412   57.0  46.2  -33.7  -0.0975  -0.2    0.1	Her X-1
256.0073 -37.8486    1.1  35.2 -165.3   2.4821  10.5    1.0	4U 1700-377
256.5337 -36.4496    5.2  33.8 -164.6   0.5016   2.2    5.0	GX 349+2
262.9070 -24.7991    8.2  21.1 -160.6  -0.2862  -1.4    6.4	GX 1+4
264.6586 -44.5891   12.9  38.7 -179.8  -0.2776  -0.9    9.1	4U 1735-44
268.4084  -1.4262    2.0   8.1  -59.1   1.0792   5.8    2.9	SW J1753.5-0127
270.2107 -25.0436    3.6  18.6 -178.9   0.6021   3.3    4.5	GX 5-1
270.3344 -25.7695    6.6  19.3 -179.7   0.3280   1.7    2.3	GRS 1758-258
274.1142 -14.1130    2.8   7.2  171.6   0.7536   4.1    7.8	GX 17+2
276.0034 -30.4398    3.5  23.6  165.7   0.7023   3.3    6.0	H1820-303
284.9398 -24.9353    3.9  20.7  141.1   0.6657   2.9    5.3	HT1900.1-2455
288.8090  10.9335    1.4  22.8   27.9   1.7868   8.0    1.0	GRS 1915+105
299.6022  35.1948    1.4  48.3   16.7   4.7051   8.4    0.7	Cyg X-1
265.3392 -63.2367    2.3  56.7  173.9   6.9412   5.0 ------	UNKNOWN
266.8155 -27.2955    2.8  21.7 -172.3   0.8196   4.1 ------	UNKNOWN
245.8388 -61.1548    3.3  58.3 -175.2   4.1307   3.4 ------	UNKNOWN
225.2239 -44.4988    4.2  56.9 -150.8   3.2585   2.7 ------	UNKNOWN
243.2441  34.3941    3.2  50.7  -44.5   4.0538   3.6 ------	UNKNOWN
233.3089  -3.3065    3.9  41.1  -98.1   3.5737   3.0 ------	UNKNOWN
Pre-slew background subtracted image of 15-350 keV band
Time interval of the image:
-2.816000 6.184000

# RAcent  DECcent POSerr Theta    Phi  PeakCts   SNR AngSep     Name
#  [deg]    [deg]    ['] [deg]  [deg]                   [']
245.0286 -15.5135    4.4  30.1 -120.2  -0.1318  -2.6    8.1	Sco X-1
254.2532  35.1953    0.0  46.2  -34.0   0.2526   3.0   13.3	Her X-1
256.0234 -37.8977    7.1  35.2 -165.4  -0.0723  -1.6    3.7	4U 1700-377
256.5067 -36.2861    6.2  33.7 -164.4  -0.0766  -1.8    8.9	GX 349+2
262.9308 -24.8806    5.5  21.1 -160.8   0.0755   2.1    9.2	GX 1+4
264.6939 -44.5961    4.5  38.7 -179.8   0.1302   2.6    9.0	4U 1735-44
268.2336  -1.4083    6.6   8.3  -59.8   0.0610   1.7    8.5	SW J1753.5-0127
270.1656 -24.9024    0.0  18.5 -178.6  -0.0508  -1.4   12.4	GX 5-1
270.1326 -25.7811   11.1  19.3 -179.2  -0.0368  -1.0    9.5	GRS 1758-258
273.8834 -14.1009    3.9   7.2  173.4   0.0944   2.9    8.1	GX 17+2
275.9569 -30.5229   85.8  23.7  165.8  -0.0050  -0.1    9.5	H1820-303
284.8788 -24.8987    9.3  20.6  141.2  -0.0446  -1.2    8.7	HT1900.1-2455
288.9631  11.0585    0.0  23.0   28.0   0.0154   0.4   11.8	GRS 1915+105
299.4980  35.3749    9.0  48.4   16.5  -0.1196  -1.3   11.3	Cyg X-1
291.5609 -52.1567    2.6  47.4  154.8   0.4762   4.5 ------	UNKNOWN
255.4026 -40.8520    1.4  38.0 -167.3   0.3959   8.4 ------	UNKNOWN
Post-slew image of 15-350 keV band
Time interval of the image:
96.784590 633.484590

# RAcent  DECcent POSerr Theta    Phi  PeakCts   SNR AngSep     Name
#  [deg]    [deg]    ['] [deg]  [deg]                   [']
186.6719 -62.8744    5.5  45.0 -132.7   2.8646   2.1    6.3	GX 301-2
244.9867 -15.6378    0.3  26.8  -12.5  19.3344  44.4    0.4	Sco X-1
255.9891 -37.8356    1.0   3.0   18.3   4.5308  11.6    0.5	4U 1700-377
256.5258 -36.4509    3.9   4.4   21.5   1.1525   3.0    4.7	GX 349+2
262.9622 -24.6277    3.3  17.4   33.8   1.2955   3.5    7.5	GX 1+4
264.6331 -44.5264    4.5   7.7  132.3   1.0031   2.6    6.6	4U 1735-44
268.3928  -1.4029    3.9  41.1   30.3   2.3624   3.0    3.3	SW J1753.5-0127
270.2382 -25.2142    5.7  19.9   53.2   0.9679   2.2    8.5	GX 5-1
270.3416 -25.6795    3.4  19.5   54.2   1.9223   4.3    4.4	GRS 1758-258
273.8512 -13.9978    4.6  31.2   46.6   1.5974   2.5    9.3	GX 17+2
276.0792 -30.4669    4.6  19.6   75.1   1.1422   2.5   10.0	H1820-303
285.1199 -24.8924    3.4  29.3   76.7   2.0854   3.3    4.9	HT1900.1-2455
271.8994 -56.5306    2.9  19.0  161.7   1.7227   4.1 ------	UNKNOWN
255.1923 -41.7394    2.5   0.9 -157.2   2.0142   4.5 ------	UNKNOWN
 14.7699 -80.9617    3.5  54.0 -179.4   4.7338   3.3 ------	UNKNOWN
238.9942  12.7532    3.8  55.7   -9.2   4.3245   3.1 ------	UNKNOWN
Plot creation:
Wed Feb 17 13:28:49 EST 2010