Click here for the BAT GCN circular template
Image
Pre-slew 15.0-350.0 keV image (Event data)
#   RAcent    DECcent   POSerr    Theta     Phi              Peak Cts       SNR   Name
   32.6397    64.1301   0.0044    20.2392   -64.6463         2.7711897     44.235 TRIG_00318170

Foreground time interval of the image:
 -3.300  18.533 (delta_t =  21.833 [sec])
Background time interval of the image:
-239.368  -3.300 (delta_t = 236.068 [sec])
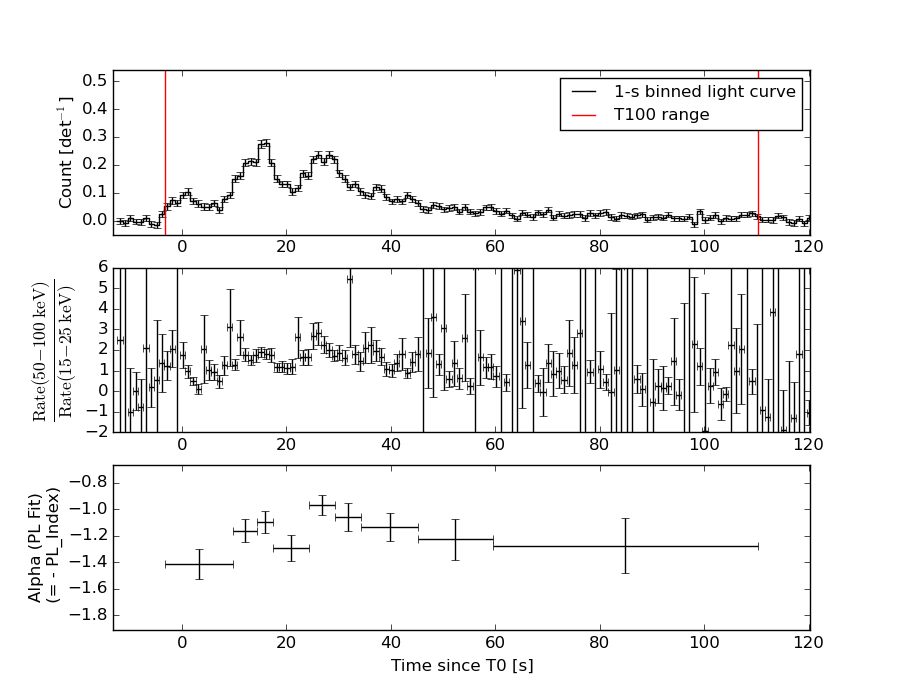
Lightcurves
Notes:
- 1) The mask-weighted light curves are using the flight position.
- 2) Multiple plots of different time binning/intervals are shown to cover all scenarios of short/long GRBs, rate/image triggers, and real/false positives.
- 3) For all the mask-weighted lightcurves, the y-axis units are counts/sec/det where a det is 0.4 x 0.4 = 0.16 sq cm.
- 4) The verticle lines correspond to following: green dotted lines are T50 interval, black dotted lines are T90 interval, blue solid line(s) is a spacecraft slew start time, and orange solid line(s) is a spacecraft slew end time.
- 5) Time of each bin is in the middle of the bin.
1 s binning
From T0-310 s to T0+310 s
From T100_start - 20 s to T100_end + 30 s

Full time interval
64 ms binning
Full time interval
From T100_start to T100_end
From T0-5 sec to T0+5 sec

16 ms binning
From T100_start-5 s to T100_start+5 s
Blue+Cyan dotted lines: Time interval of the scaled map
From 0.000000 to 1.024000
8 ms binning
From T100_start-3 s to T100_start+3 s
Blue+Cyan dotted lines: Time interval of the scaled map
From 0.000000 to 1.024000
2 ms binning
From T100_start-1 s to T100_start+1 s
Blue+Cyan dotted lines: Time interval of the scaled map
From 0.000000 to 1.024000
SN=5 or 10 sec. binning (whichever binning is satisfied first)
SN=5 or 10 sec. binning (T < 200 sec)
Quad-rate summed light curves (from T0-300s to T0+1000s)

Spectral Evolution
Spectra
Notes:
- 1) The fitting includes the systematic errors.
- 2) When the burst includes telescope slew time periods, the fitting uses an average response file made from multiple 5-s response files through out the slew time plus single time preiod for the non-slew times, and weighted by the total counts in the corresponding time period using addrmf. An average response file is needed becuase a spectral fit using the pre-slew DRM will introduce some errors in both a spectral shape and a normalization if the PHA file contains a lot of the slew/post-slew time interval.
- 3) For fits to more complicated models (e.g. a power-law over a cutoff power-law), the BAT team has decided to require a chi-square improvement of more than 6 for each extra dof.
Time averaged spectrum fit using the average DRM
Power-law model
Time interval is from   -3.300 sec. to  110.248 sec.

Spectral model in power-law:
------------------------------------------------------------
Parameters  : value       lower 90%   higher 90%
Photon index: 1.22108     ( -0.0473229   0.0471193 )
Norm@50keV  : 4.74126E-03    ( -0.000120603   0.000120567 )
------------------------------------------------------------
#Fit statistic : Chi-Squared =          68.62 using 59 PHA bins.
# Reduced chi-squared =          1.204 for     57 degrees of freedom
# Null hypothesis probability =   1.392519e-01

Photon flux (15-150 keV)    in 113.5 sec: 0.558234 ( -0.0151255  0.0151522 ) ph/cm2/s
Energy fluence (15-150 keV)             : 5.42763e-06 ( -1.47903e-07  1.48171e-07 ) ergs/cm2
Cutoff power-law model
Time interval is from   -3.300 sec. to  110.248 sec.
Spectral model in the cutoff power-law:
------------------------------------------------------------
Parameters  : value       lower 90%   higher 90%
Photon index: 0.864335     ( -0.197145   0.188406 )
Epeak [keV] : 178.906      ( -43.8743 129.495 )
Norm@50keV  : 6.85075E-03    ( -0.00117953   0.00149286 )
------------------------------------------------------------
#Fit statistic : Chi-Squared =          57.75 using 59 PHA bins.
# Reduced chi-squared =          1.031 for     56 degrees of freedom
# Null hypothesis probability =   4.104455e-01

Photon flux (15-150 keV)    in 113.5 sec: 0.545664 ( -0.016358  0.016387 ) ph/cm2/s
Energy fluence (15-150 keV)             : 5.30465e-06 ( -1.6369e-07  1.62793e-07 ) ergs/cm2
Band function
Time interval is from   -3.300 sec. to  110.248 sec.

Spectral model in the Band function:
------------------------------------------------------------
Parameters  : value       lower 90%   higher 90%
alpha       : 1.36234   ( -1.87319   -1.36309 )
beta        : -1.31152    ( -0.0926621   0.0669797 )
Epeak [keV] : 40.2881      ( -8.18006 49.2611 )
Norm@50keV   : 0.233168    ( -0.234328   56.6652 )
------------------------------------------------------------
#Fit statistic : Chi-Squared =          52.82 using 59 PHA bins.
# Reduced chi-squared =         0.9604 for     55 degrees of freedom
# Null hypothesis probability =   5.582491e-01

Photon flux (15-150 keV)    in 113.5 sec:  (    ) ph/cm2/s
Energy fluence (15-150 keV)             : 0 ( 0  0 ) ergs/cm2
Single BB
Spectral model blackbody:
------------------------------------------------------------
Parameters  : value    Lower 90%  Upper 90%
kT [keV]    : 19.4562  (  )
R^2/D10^2   : 2.73638E-02  (   )
(R is the radius in km and D10 is the distance to the source in units of 10 kpc)
------------------------------------------------------------
#Fit statistic : Chi-Squared =         287.10 using 59 PHA bins.
# Reduced chi-squared =         5.0368 for     57 degrees of freedom
# Null hypothesis probability =   2.032451e-32

Energy  Fluence     90% Error
[keV]   [erg/cm2]   [erg/cm2]
15- 25  2.291e-07   1.266e-08
25- 50  1.120e-06   4.495e-08
50-150  3.130e-06   1.356e-07
15-150  4.479e-06   1.300e-07
Thermal bremsstrahlung (OTTB)

Spectral model: thermal bremsstrahlung
------------------------------------------------------------
Parameters  : value         Lower 90%    Upper 90%
kT [keV]    : 199.363       (      )
Norm        : 2.36061       (     )
------------------------------------------------------------
#Fit statistic : Chi-Squared =         205.50 using 59 PHA bins.
# Reduced chi-squared =         3.6052 for     57 degrees of freedom
# Null hypothesis probability =   1.189941e-18

Energy  Fluence     90% Error
[keV]   [erg/cm2]   [erg/cm2]
15- 25  6.672e-07   1.856e-08
25- 50  1.283e-06   3.689e-08
50-150  2.815e-06   7.548e-08
15-150  4.765e-06   1.379e-07
Double BB
Spectral model: bbodyrad<1> + bbodyrad<2>
------------------------------------------------------------
Parameters  : value         Lower 90%    Upper 90%
kT1 [keV]   : 8.51092        (-0.873063      0.959507)
R1^2/D10^2  : 0.240004        (-0.0655194      0.0966244)
kT2 [keV]   : 31.8162        (-3.06687      4.2261)
R2^2/D10^2  : 4.49903E-03    (-0.00153031   0.00188145)
------------------------------------------------------------
#Fit statistic : Chi-Squared =          50.92 using 59 PHA bins.
# Reduced chi-squared =         0.9259 for     55 degrees of freedom
# Null hypothesis probability =   6.310303e-01

Energy  Fluence     90% Error
[keV]   [erg/cm2]   [erg/cm2]
15- 25  4.501e-07   4.444e-08
25- 50  1.215e-06   8.104e-08
50-150  3.663e-06   3.047e-07
15-150  5.329e-06   3.604e-07
Peak spectrum fit
Power-law model

Time interval is from   15.232 sec. to   16.232 sec.

Spectral model in power-law:
------------------------------------------------------------
Parameters  : value       lower 90%   higher 90%
Photon index: 1.04968     ( -0.121956   0.120358 )
Norm@50keV  : 1.98789E-02    ( -0.00144378   0.00144335 )
------------------------------------------------------------
#Fit statistic : Chi-Squared =          77.44 using 59 PHA bins.
# Reduced chi-squared =          1.359 for     57 degrees of freedom
# Null hypothesis probability =   3.717234e-02

Photon flux (15-150 keV)    in 1 sec: 2.29589 ( -0.169255  0.169425 ) ph/cm2/s
Energy fluence (15-150 keV)             : 2.11296e-07 ( -1.70347e-08  1.71941e-08 ) ergs/cm2
Cutoff power-law model
Time interval is from   15.232 sec. to   16.232 sec.
Spectral model in the cutoff power-law:
------------------------------------------------------------
Parameters  : value       lower 90%   higher 90%
Photon index: 0.251374     ( -0.587278   0.513448 )
Epeak [keV] : 121.347      ( -29.7206 112.134 )
Norm@50keV  : 4.64149E-02    ( -0.0190896   0.0376419 )
------------------------------------------------------------
#Fit statistic : Chi-Squared =          69.91 using 59 PHA bins.
# Reduced chi-squared =          1.248 for     56 degrees of freedom
# Null hypothesis probability =   1.001374e-01

Photon flux (15-150 keV)    in 1 sec: 2.23139 ( -0.17492  0.17467 ) ph/cm2/s
Energy fluence (15-150 keV)             : 2.02601e-07 ( -1.8344e-08  1.8317e-08 ) ergs/cm2
Band function

Time interval is from   15.232 sec. to   16.232 sec.

Spectral model in the Band function:
------------------------------------------------------------
Parameters  : value       lower 90%   higher 90%
alpha       : -0.251410   ( -0.457963   0.503122 )
beta        : -10.0000    ( 10   20 )
Epeak [keV] : 121.336      ( -22.0377 112.077 )
Norm@50keV   : 4.64140E-02    ( -0.0190708   0.0376897 )
------------------------------------------------------------
#Fit statistic : Chi-Squared =          69.91 using 59 PHA bins.
# Reduced chi-squared =          1.271 for     55 degrees of freedom
# Null hypothesis probability =   8.495413e-02

Photon flux (15-150 keV)    in 1 sec:  (    ) ph/cm2/s
Energy fluence (15-150 keV)             : 0 ( 0  0 ) ergs/cm2
Single BB
Spectral model blackbody:
------------------------------------------------------------
Parameters  : value    Lower 90%  Upper 90%
kT [keV]    : 20.4455  (-1.79213  2.02688)
R^2/D10^2   : 0.104890  (-0.0273815   0.035967)
(R is the radius in km and D10 is the distance to the source in units of 10 kpc)
------------------------------------------------------------
#Fit statistic : Chi-Squared =          86.33 using 59 PHA bins.
# Reduced chi-squared =          1.515 for     57 degrees of freedom
# Null hypothesis probability =   7.325413e-03

Energy  Fluence     90% Error
[keV]   [erg/cm2]   [erg/cm2]
15- 25  8.377e-09   1.255e-09
25- 50  4.234e-08   4.360e-09
50-150  1.316e-07   1.590e-08
15-150  1.823e-07   1.765e-08
Thermal bremsstrahlung (OTTB)
Spectral model: thermal bremsstrahlung
------------------------------------------------------------
Parameters  : value         Lower 90%    Upper 90%
kT [keV]    : 199.363       (      )
Norm        : 9.22161       (     )
------------------------------------------------------------
#Fit statistic : Chi-Squared =         118.24 using 59 PHA bins.
# Reduced chi-squared =         2.0744 for     57 degrees of freedom
# Null hypothesis probability =   3.546734e-06

Energy  Fluence     90% Error
[keV]   [erg/cm2]   [erg/cm2]
15- 25  2.296e-08   1.860e-09
25- 50  4.417e-08   1.019e-08
50-150  9.688e-08   3.358e-08
15-150  1.640e-07   4.379e-08
Double BB
Spectral model: bbodyrad<1> + bbodyrad<2>
------------------------------------------------------------
Parameters  : value         Lower 90%    Upper 90%
kT1 [keV]   : 7.40889        (-2.54818      4.16223)
R1^2/D10^2  : 1.04939        (-0.726044      3.25699)
kT2 [keV]   : 26.6522        (-4.28608      10.117)
R2^2/D10^2  : 3.92365E-02    (-0.0270321   0.033807)
------------------------------------------------------------
#Fit statistic : Chi-Squared =          69.03 using 59 PHA bins.
# Reduced chi-squared =          1.255 for     55 degrees of freedom
# Null hypothesis probability =   9.672467e-02

Energy  Fluence     90% Error
[keV]   [erg/cm2]   [erg/cm2]
15- 25  1.445e-08   6.661e-09
25- 50  4.228e-08   1.651e-08
50-150  1.455e-07   5.060e-08
15-150  2.022e-07   6.736e-08
Pre-slew spectrum (Pre-slew PHA with pre-slew DRM)
Power-law model
Spectral model in power-law:
------------------------------------------------------------
Parameters  : value       lower 90%   higher 90%
Photon index: 1.26889     ( -0.0597858   0.059601 )
Norm@50keV  : 8.77444E-03    ( -0.000297209   0.000297208 )
------------------------------------------------------------
#Fit statistic : Chi-Squared =          70.15 using 59 PHA bins.
# Reduced chi-squared =          1.231 for     57 degrees of freedom
# Null hypothesis probability =   1.133030e-01

Photon flux (15-150 keV)    in 21.83 sec: 1.04105 ( -0.0367133  0.0367585 ) ph/cm2/s
Energy fluence (15-150 keV)             : 1.9076e-06 ( -7.10032e-08  7.11996e-08 ) ergs/cm2
Cutoff power-law model

Spectral model in the cutoff power-law:
------------------------------------------------------------
Parameters  : value       lower 90%   higher 90%
Photon index: 0.594978     ( -0.27164   0.255263 )
Epeak [keV] : 111.904      ( -17.8179 35.4033 )
Norm@50keV  : 1.81957E-02    ( -0.00427944   0.00600486 )
------------------------------------------------------------
#Fit statistic : Chi-Squared =          47.74 using 59 PHA bins.
# Reduced chi-squared =         0.8524 for     56 degrees of freedom
# Null hypothesis probability =   7.760968e-01

Photon flux (15-150 keV)    in 21.83 sec: 1.00449 ( -0.038957  0.03898 ) ph/cm2/s
Energy fluence (15-150 keV)             : 1.8218e-06 ( -7.89853e-08  7.88041e-08 ) ergs/cm2
Band function
Spectral model in the Band function:
------------------------------------------------------------
Parameters  : value       lower 90%   higher 90%
alpha       : -0.594953   ( -0.179838   0.346606 )
beta        : -10.0000    ( 10   5.32907e-15 )
Epeak [keV] : 111.886      ( -10.6497 35.406 )
Norm@50keV   : 1.81959E-02    ( -0.00428678   0.00600774 )
------------------------------------------------------------
#Fit statistic : Chi-Squared =          47.74 using 59 PHA bins.
# Reduced chi-squared =         0.8679 for     55 degrees of freedom
# Null hypothesis probability =   7.457933e-01

Photon flux (15-150 keV)    in 21.83 sec: 1.00826 (    ) ph/cm2/s
Energy fluence (15-150 keV)             : 1.83343e-06 ( 0  0 ) ergs/cm2
S(25-50 keV) vs. S(50-100 keV) plot

S(25-50 keV)  = 1.15e-06
S(50-100 keV) = 1.98e-06
T90 vs. Hardness ratio plot
T90                                   = 77.363999992609 sec.
Hardness ratio (energy fluence ratio) = 1.72174
Color vs. Color plot
Count Ratio  (25-50 keV) / (15-25 keV) = 1.79225
Count Ratio (50-100 keV) / (15-25 keV) = 1.58187
Mask shadow pattern
IMX = 1.578814225197023E-01, IMY = 3.331922850841051E-01
TIME vs. PHA plot around the trigger time
Blue+Cyan dotted lines: Time interval of the scaled map
From 0.000000 to 1.024000
TIME vs. DetID plot around the trigger time
Blue+Cyan dotted lines: Time interval of the scaled map
From 0.000000 to 1.024000
100 us light curve (15-350 keV)
Blue+Cyan dotted lines: Time interval of the scaled map
From 0.000000 to 1.024000
Spacecraft aspect plot
Bright source in the pre-burst/pre-slew/post-slew images
Pre-burst image of 15-350 keV band
Time interval of the image:
-239.368000 -3.300000

# RAcent  DECcent POSerr Theta    Phi  PeakCts   SNR AngSep     Name
#  [deg]    [deg]    ['] [deg]  [deg]                   [']
299.5857  35.1879    0.7  40.7  135.9   8.7618  17.4    0.9	Cyg X-1
308.1612  40.9372    4.2  32.0  133.4   0.8160   2.8    2.5	Cyg X-3
326.0996  38.2689    3.9  26.0  106.9   0.8061   2.9    4.6	Cyg X-2
285.6341  33.0528    2.3  49.6  146.9   4.3002   4.9 ------	UNKNOWN
323.3445  31.6332    2.4  32.9  104.6   1.7250   4.9 ------	UNKNOWN
106.4056  73.0572    4.3  41.1  -98.2   3.1772   2.7 ------	UNKNOWN
Pre-slew background subtracted image of 15-350 keV band
Time interval of the image:
-3.300000 18.532610

# RAcent  DECcent POSerr Theta    Phi  PeakCts   SNR AngSep     Name
#  [deg]    [deg]    ['] [deg]  [deg]                   [']
299.4654  35.0703    4.4  40.9  135.9   0.3782   2.6   10.0	Cyg X-1
308.3157  40.8133   11.3  32.0  133.1  -0.0909  -1.0   12.5	Cyg X-3
326.3772  38.4336    0.0  25.7  106.6  -0.1144  -1.5   11.8	Cyg X-2
 37.4393  41.9851    3.0  33.2  -22.3   0.2569   3.8 ------	UNKNOWN
 32.6397  64.1301    0.3  20.2  -64.6   2.7713  44.2 ------	UNKNOWN
Post-slew image of 15-350 keV band
Time interval of the image:
61.532600 362.774100
420.632000 482.693600
600.632000 662.724100

# RAcent  DECcent POSerr Theta    Phi  PeakCts   SNR AngSep     Name
#  [deg]    [deg]    ['] [deg]  [deg]                   [']
270.1649  59.0226    3.4  49.4  158.2   2.8548   3.4 ------	UNKNOWN
 32.7203  64.1684    1.9   0.0 -105.4   1.5542   6.0 ------	UNKNOWN
 39.2630  44.4543    1.9  20.0   -0.8   1.3837   6.0 ------	UNKNOWN
 74.7641  19.5421    3.1  52.7  -39.5   4.3553   3.7 ------	UNKNOWN
Plot creation:
Sun May 31 06:48:32 EDT 2015