Click here for the BAT GCN circular template
Image
Pre-slew 15.0-350.0 keV image (Event data)
#   RAcent    DECcent   POSerr    Theta     Phi              Peak Cts       SNR   Name
  270.7229   -32.3302   0.0116     4.8637   173.5421         1.6623892     16.617 TRIG_00318832

Foreground time interval of the image:
-26.552  41.437 (delta_t =  67.989 [sec])
Background time interval of the image:
-239.064 -26.552 (delta_t = 212.512 [sec])
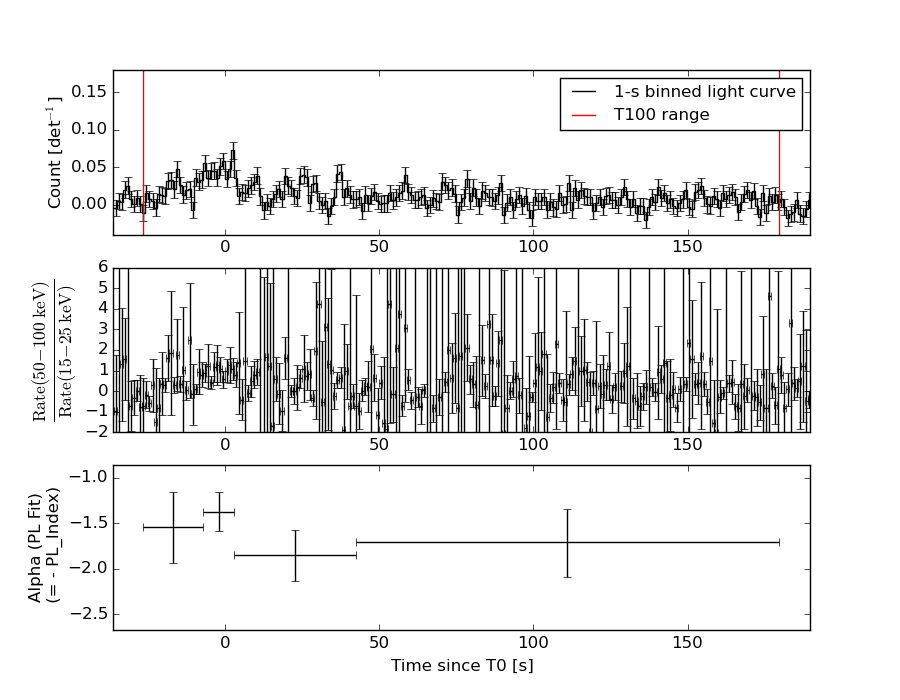
Lightcurves
Notes:
- 1) The mask-weighted light curves are using the flight position.
- 2) Multiple plots of different time binning/intervals are shown to cover all scenarios of short/long GRBs, rate/image triggers, and real/false positives.
- 3) For all the mask-weighted lightcurves, the y-axis units are counts/sec/det where a det is 0.4 x 0.4 = 0.16 sq cm.
- 4) The verticle lines correspond to following: green dotted lines are T50 interval, black dotted lines are T90 interval, blue solid line(s) is a spacecraft slew start time, and orange solid line(s) is a spacecraft slew end time.
- 5) Time of each bin is in the middle of the bin.
1 s binning
From T0-310 s to T0+310 s
From T100_start - 20 s to T100_end + 30 s

Full time interval

64 ms binning
Full time interval
From T100_start to T100_end

From T0-5 sec to T0+5 sec

16 ms binning
From T100_start-5 s to T100_start+5 s
Blue+Cyan dotted lines: Time interval of the scaled map
From 0.000000 to 4.096000
8 ms binning
From T100_start-3 s to T100_start+3 s
Blue+Cyan dotted lines: Time interval of the scaled map
From 0.000000 to 4.096000
2 ms binning
From T100_start-1 s to T100_start+1 s
Blue+Cyan dotted lines: Time interval of the scaled map
From 0.000000 to 4.096000
SN=5 or 10 sec. binning (whichever binning is satisfied first)

SN=5 or 10 sec. binning (T < 200 sec)

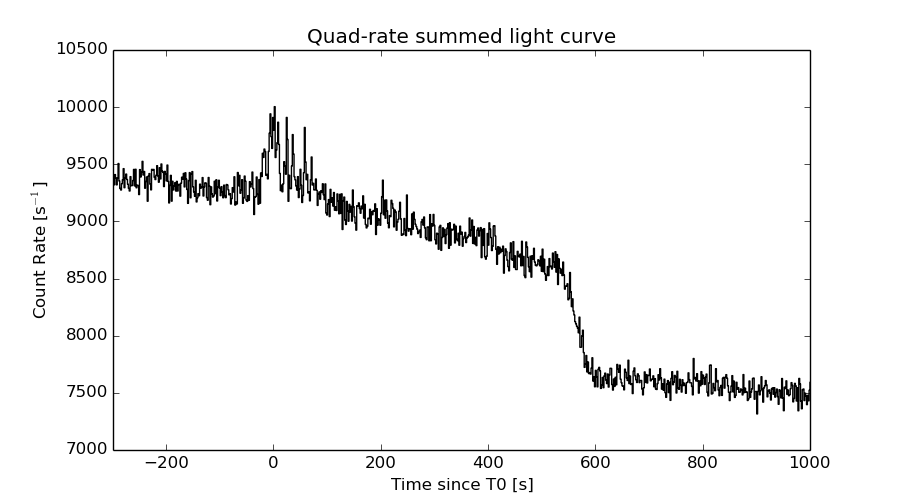
Quad-rate summed light curves (from T0-300s to T0+1000s)
Spectral Evolution
Spectra
Notes:
- 1) The fitting includes the systematic errors.
- 2) When the burst includes telescope slew time periods, the fitting uses an average response file made from multiple 5-s response files through out the slew time plus single time preiod for the non-slew times, and weighted by the total counts in the corresponding time period using addrmf. An average response file is needed becuase a spectral fit using the pre-slew DRM will introduce some errors in both a spectral shape and a normalization if the PHA file contains a lot of the slew/post-slew time interval.
- 3) For fits to more complicated models (e.g. a power-law over a cutoff power-law), the BAT team has decided to require a chi-square improvement of more than 6 for each extra dof.
Time averaged spectrum fit using the average DRM
Power-law model
Time interval is from  -26.552 sec. to  179.720 sec.

Spectral model in power-law:
------------------------------------------------------------
Parameters  : value       lower 90%   higher 90%
Photon index: 1.67467     ( -0.177902   0.181227 )
Norm@50keV  : 7.02763E-04    ( -7.84184e-05   7.74007e-05 )
------------------------------------------------------------
#Fit statistic : Chi-Squared =          53.29 using 59 PHA bins.
# Reduced chi-squared =         0.9350 for     57 degrees of freedom
# Null hypothesis probability =   6.149158e-01

Photon flux (15-150 keV)    in 206.3 sec: 9.25242E-02 ( -0.00928261  0.00928804 ) ph/cm2/s
Energy fluence (15-150 keV)             : 1.34519e-06 ( -1.57951e-07  1.61176e-07 ) ergs/cm2
Cutoff power-law model

Time interval is from  -26.552 sec. to  179.720 sec.
Spectral model in the cutoff power-law:
------------------------------------------------------------
Parameters  : value       lower 90%   higher 90%
Photon index: 0.976445     ( -0.906576   0.734504 )
Epeak [keV] : 63.3358      ( -16.7435 -63.3386 )
Norm@50keV  : 1.73385E-03    ( -0.00104595   0.00386776 )
------------------------------------------------------------
#Fit statistic : Chi-Squared =          50.70 using 59 PHA bins.
# Reduced chi-squared =         0.9053 for     56 degrees of freedom
# Null hypothesis probability =   6.751479e-01

Photon flux (15-150 keV)    in 206.3 sec: 8.94445E-02 ( -0.0098159  0.0098199 ) ph/cm2/s
Energy fluence (15-150 keV)             : 1.2348e-06 ( -1.86532e-07  1.96769e-07 ) ergs/cm2
Band function

Time interval is from  -26.552 sec. to  179.720 sec.

Spectral model in the Band function:
------------------------------------------------------------
Parameters  : value       lower 90%   higher 90%
alpha       : 4.90492   ( -6.08656   -4.90492 )
beta        : -1.91583    ( -0.310655   0.238364 )
Epeak [keV] : 26.8730      ( -4.15843 3.86209 )
Norm@50keV   : 49.3719    ( -4.86667   180.354 )
------------------------------------------------------------
#Fit statistic : Chi-Squared =          47.48 using 59 PHA bins.
# Reduced chi-squared =         0.8632 for     55 degrees of freedom
# Null hypothesis probability =   7.543835e-01

Photon flux (15-150 keV)    in 206.3 sec:  (    ) ph/cm2/s
Energy fluence (15-150 keV)             : 1.2829e-06 ( -1.28146e-06  -1.61221e-07 ) ergs/cm2
Single BB
Spectral model blackbody:
------------------------------------------------------------
Parameters  : value    Lower 90%  Upper 90%
kT [keV]    : 11.6838  (-1.36684  1.60154)
R^2/D10^2   : 2.46336E-02  (-0.0092902   0.0144398)
(R is the radius in km and D10 is the distance to the source in units of 10 kpc)
------------------------------------------------------------
#Fit statistic : Chi-Squared =          65.43 using 59 PHA bins.
# Reduced chi-squared =          1.148 for     57 degrees of freedom
# Null hypothesis probability =   2.074194e-01

Energy  Fluence     90% Error
[keV]   [erg/cm2]   [erg/cm2]
15- 25  1.463e-07   2.551e-08
25- 50  4.461e-07   6.055e-08
50-150  3.596e-07   9.046e-08
15-150  9.520e-07   1.269e-07
Thermal bremsstrahlung (OTTB)

Spectral model: thermal bremsstrahlung
------------------------------------------------------------
Parameters  : value         Lower 90%    Upper 90%
kT [keV]    : 125.692       (-44.371      -124.588)
Norm        : 0.391167       (-0.0461766     0.0596753)
------------------------------------------------------------
#Fit statistic : Chi-Squared =          51.05 using 59 PHA bins.
# Reduced chi-squared =         0.8957 for     57 degrees of freedom
# Null hypothesis probability =   6.965939e-01

Energy  Fluence     90% Error
[keV]   [erg/cm2]   [erg/cm2]
15- 25  2.097e-07   3.137e-08
25- 50  3.782e-07   7.901e-08
50-150  6.903e-07   3.451e-07
15-150  1.278e-06   4.277e-07
Double BB
Spectral model: bbodyrad<1> + bbodyrad<2>
------------------------------------------------------------
Parameters  : value         Lower 90%    Upper 90%
kT1 [keV]   : 7.22143        (-2.08657      2.3457)
R1^2/D10^2  : 9.88482E-02        (-0.0566718      0.191425)
kT2 [keV]   : 24.1308        (-8.05649      37.3916)
R2^2/D10^2  : 1.20588E-03    (-0.00113391   0.00467384)
------------------------------------------------------------
#Fit statistic : Chi-Squared =          48.94 using 59 PHA bins.
# Reduced chi-squared =         0.8899 for     55 degrees of freedom
# Null hypothesis probability =   7.040368e-01

Energy  Fluence     90% Error
[keV]   [erg/cm2]   [erg/cm2]
15- 25  2.019e-07   8.869e-08
25- 50  3.990e-07   1.702e-07
50-150  6.665e-07   3.579e-07
15-150  1.267e-06   5.873e-07
Peak spectrum fit
Power-law model

Time interval is from    1.708 sec. to    2.708 sec.

Spectral model in power-law:
------------------------------------------------------------
Parameters  : value       lower 90%   higher 90%
Photon index: 1.20474     ( -0.51574   0.483638 )
Norm@50keV  : 4.43585E-03    ( -0.00108748   0.00108754 )
------------------------------------------------------------
#Fit statistic : Chi-Squared =          60.95 using 59 PHA bins.
# Reduced chi-squared =          1.069 for     57 degrees of freedom
# Null hypothesis probability =   3.357925e-01

Photon flux (15-150 keV)    in 1 sec: 0.521027 ( -0.131541  0.132428 ) ph/cm2/s
Energy fluence (15-150 keV)             : 4.49441e-08 ( -1.248e-08  1.28709e-08 ) ergs/cm2
Cutoff power-law model

Time interval is from    1.708 sec. to    2.708 sec.
Spectral model in the cutoff power-law:
------------------------------------------------------------
Parameters  : value       lower 90%   higher 90%
Photon index: 1.21006     ( -0.527768   0.478214 )
Epeak [keV] : 9999.36      ( -9999.36 -9999.36 )
Norm@50keV  : 4.45500E-03    ( -0.00109313   0.0143847 )
------------------------------------------------------------
#Fit statistic : Chi-Squared =          60.96 using 59 PHA bins.
# Reduced chi-squared =          1.089 for     56 degrees of freedom
# Null hypothesis probability =   3.022308e-01

Photon flux (15-150 keV)    in 1 sec: 0.522681 ( -0.13346  0.130598 ) ph/cm2/s
Energy fluence (15-150 keV)             : 4.50208e-08 ( -1.27122e-08  1.24752e-08 ) ergs/cm2
Band function
Time interval is from    1.708 sec. to    2.708 sec.

Spectral model in the Band function:
------------------------------------------------------------
Parameters  : value       lower 90%   higher 90%
alpha       : 4.97830   ( -4.9783   -4.9783 )
beta        : -1.24999    ( -0.624195   0.539435 )
Epeak [keV] : 22.7017      ( -22.7017 16.7277 )
Norm@50keV   : 629.626    ( -153.959   2.23328e+06 )
------------------------------------------------------------
#Fit statistic : Chi-Squared =          60.73 using 59 PHA bins.
# Reduced chi-squared =          1.104 for     55 degrees of freedom
# Null hypothesis probability =   2.770856e-01

Photon flux (15-150 keV)    in 1 sec:  (    ) ph/cm2/s
Energy fluence (15-150 keV)             : 0 ( 0  0 ) ergs/cm2
Single BB

Spectral model blackbody:
------------------------------------------------------------
Parameters  : value    Lower 90%  Upper 90%
kT [keV]    : 18.0687  (-5.88136  11.4656)
R^2/D10^2   : 3.13878E-02  (-0.0309317   0.0852738)
(R is the radius in km and D10 is the distance to the source in units of 10 kpc)
------------------------------------------------------------
#Fit statistic : Chi-Squared =          66.62 using 59 PHA bins.
# Reduced chi-squared =          1.169 for     57 degrees of freedom
# Null hypothesis probability =   1.797562e-01

Energy  Fluence     90% Error
[keV]   [erg/cm2]   [erg/cm2]
15- 25  2.049e-09   1.297e-09
25- 50  9.504e-09   5.720e-09
50-150  2.255e-08   1.387e-08
15-150  3.410e-08   2.029e-08
Thermal bremsstrahlung (OTTB)
Spectral model: thermal bremsstrahlung
------------------------------------------------------------
Parameters  : value         Lower 90%    Upper 90%
kT [keV]    : 199.363       (-101.037      -199.363)
Norm        : 2.14542       (-0.536575     0.536575)
------------------------------------------------------------
#Fit statistic : Chi-Squared =          62.73 using 59 PHA bins.
# Reduced chi-squared =          1.100 for     57 degrees of freedom
# Null hypothesis probability =   2.805232e-01

Energy  Fluence     90% Error
[keV]   [erg/cm2]   [erg/cm2]
15- 25  5.342e-09   3.201e-09
25- 50  1.028e-08   6.200e-09
50-150  2.254e-08   1.363e-08
15-150  3.816e-08   2.229e-08
Double BB

R1^2/D10^2  : 0.189304        (      )
kT2 [keV]   : 200.000        (      )
R2^2/D10^2  : 1.08693E-04    (-3.47393e-05   0.000122712)
------------------------------------------------------------
#Fit statistic : Chi-Squared =          60.51 using 59 PHA bins.
#Fit statistic : Chi-Squared =          60.45 using 59 PHA bins.
#Fit statistic : Chi-Squared =          60.44 using 59 PHA bins.
# Reduced chi-squared =          1.100 for     55 degrees of freedom
# Reduced chi-squared =          1.099 for     55 degrees of freedom
# Reduced chi-squared =          1.099 for     55 degrees of freedom
# Null hypothesis probability =   2.838015e-01
# Null hypothesis probability =   2.854491e-01
# Null hypothesis probability =   2.859257e-01

Energy  Fluence     90% Error
[keV]   [erg/cm2]   [erg/cm2]
15- 25  4.214e-09   2.643e-09
25- 50  1.012e-08   5.620e-09
50-150  3.419e-08   2.087e-08
15-150  4.853e-08   2.543e-08
Pre-slew spectrum (Pre-slew PHA with pre-slew DRM)
Power-law model
Spectral model in power-law:
------------------------------------------------------------
Parameters  : value       lower 90%   higher 90%
Photon index: 1.63644     ( -0.171574   0.173852 )
Norm@50keV  : 1.29144E-03    ( -0.000136974   0.000135437 )
------------------------------------------------------------
#Fit statistic : Chi-Squared =          69.50 using 59 PHA bins.
# Reduced chi-squared =          1.219 for     57 degrees of freedom
# Null hypothesis probability =   1.238643e-01

Photon flux (15-150 keV)    in 67.99 sec: 0.167885 ( -0.016303  0.0163143 ) ph/cm2/s
Energy fluence (15-150 keV)             : 8.17763e-07 ( -9.23522e-08  9.40859e-08 ) ergs/cm2
Cutoff power-law model
Spectral model in the cutoff power-law:
------------------------------------------------------------
Parameters  : value       lower 90%   higher 90%
Photon index: 0.916301     ( -0.942401   0.747549 )
Epeak [keV] : 64.9025      ( -17.1384 -64.9081 )
Norm@50keV  : 3.28204E-03    ( -0.00200704   0.00787782 )
------------------------------------------------------------
#Fit statistic : Chi-Squared =          66.84 using 59 PHA bins.
# Reduced chi-squared =          1.193 for     56 degrees of freedom
# Null hypothesis probability =   1.523258e-01

Photon flux (15-150 keV)    in 67.99 sec: 0.162041 ( -0.017431  0.017377 ) ph/cm2/s
Energy fluence (15-150 keV)             : 7.46306e-07 ( -1.13184e-07  1.18955e-07 ) ergs/cm2
Band function
Spectral model in the Band function:
------------------------------------------------------------
Parameters  : value       lower 90%   higher 90%
alpha       : 4.97951   ( -14.8662   -4.97951 )
beta        : -1.83832    ( -0.283068   0.218961 )
Epeak [keV] : 25.9110      ( -4.85765 4.0955 )
Norm@50keV   : 124.652    ( -11.8718   349.811 )
------------------------------------------------------------
#Fit statistic : Chi-Squared =          63.04 using 59 PHA bins.
# Reduced chi-squared =          1.146 for     55 degrees of freedom
# Null hypothesis probability =   2.133117e-01

Photon flux (15-150 keV)    in 67.99 sec:  (    ) ph/cm2/s
Energy fluence (15-150 keV)             : 7.60115e-07 ( 0  0 ) ergs/cm2
S(25-50 keV) vs. S(50-100 keV) plot
S(25-50 keV)  = 3.60e-07
S(50-100 keV) = 4.51e-07
T90 vs. Hardness ratio plot
T90                                   = 179.503999978304 sec.
Hardness ratio (energy fluence ratio) = 1.25278
Color vs. Color plot
Count Ratio  (25-50 keV) / (15-25 keV) = 1.25585
Count Ratio (50-100 keV) / (15-25 keV) = 0.708067
Mask shadow pattern

IMX = -8.455161124743028E-02, IMY = -9.570568996833929E-03
TIME vs. PHA plot around the trigger time
Blue+Cyan dotted lines: Time interval of the scaled map
From 0.000000 to 4.096000
TIME vs. DetID plot around the trigger time

Blue+Cyan dotted lines: Time interval of the scaled map
From 0.000000 to 4.096000
100 us light curve (15-350 keV)
Blue+Cyan dotted lines: Time interval of the scaled map
From 0.000000 to 4.096000
Spacecraft aspect plot

Bright source in the pre-burst/pre-slew/post-slew images
Pre-burst image of 15-350 keV band
Time interval of the image:
-239.064000 -26.552000

# RAcent  DECcent POSerr Theta    Phi  PeakCts   SNR AngSep     Name
#  [deg]    [deg]    ['] [deg]  [deg]                   [']
244.9731 -15.6420    0.4  25.0  -49.4   6.6167  28.2    0.4	Sco X-1
256.1350 -37.8474   16.7  14.4 -120.9   0.1352   0.7    7.0	4U 1700-377
256.5846 -36.4187    3.4  13.2 -117.1   0.6741   3.4    7.2	GX 349+2
263.1259 -24.8734    6.4   5.7  -43.2   0.3624   1.8   10.0	GX 1+4
264.5781 -44.5712    7.7  17.0 -154.2   0.3023   1.5   10.1	4U 1735-44
268.3795  -1.4286    2.2  26.4   15.9   1.1544   5.3    1.6	SW J1753.5-0127
270.2948 -25.0071    2.2   3.3   45.9   1.0045   5.2    4.4	GX 5-1
270.4288 -25.6493    4.8   2.8   54.5   0.5026   2.5    8.9	GRS 1758-258
274.0042 -14.0585    3.3  14.7   37.7   0.7002   3.5    1.3	GX 17+2
275.8785 -30.3995    2.5   6.9  129.5   0.8769   4.7    3.1	H1820-303
285.2162 -25.0018    4.8  15.2   99.2   0.4917   2.4   11.0	HT1900.1-2455
288.7934  10.9009    4.1  43.5   45.9   1.8694   2.9    2.7	GRS 1915+105
262.9319 -33.8924    2.4   7.7 -126.8   0.9618   4.8    4.5	GX 354-0
333.1862 -55.0116    3.1  53.2  155.8   4.3603   3.7 ------	UNKNOWN
278.3592  13.9271    2.1  42.9   30.3   2.3278   5.6 ------	UNKNOWN
278.5370 -13.0355    2.1  17.5   50.5   1.0699   5.5 ------	UNKNOWN
325.7487 -73.1877    3.2  54.1  178.7   2.8485   3.6 ------	UNKNOWN
278.6495 -53.5424    2.3  26.7 -177.2   1.0434   5.0 ------	UNKNOWN
275.7964 -65.7524    2.0  38.2 -168.6   1.4430   5.8 ------	UNKNOWN
206.5144 -72.6773    4.8  55.3 -145.1   3.3360   2.4 ------	UNKNOWN
225.9556   1.9574    2.5  50.6  -44.8   4.8379   4.6 ------	UNKNOWN
Pre-slew background subtracted image of 15-350 keV band
Time interval of the image:
-26.552000 41.436620

# RAcent  DECcent POSerr Theta    Phi  PeakCts   SNR AngSep     Name
#  [deg]    [deg]    ['] [deg]  [deg]                   [']
245.1044 -15.4743   24.7  25.0  -48.9   0.0594   0.5   12.3	Sco X-1
256.0550 -37.9841    4.7  14.5 -121.1   0.2802   2.5    9.0	4U 1700-377
256.5854 -36.2548    0.0  13.1 -116.6  -0.2377  -2.2   12.4	GX 349+2
263.1014 -24.8789    3.0   5.7  -43.4  -0.3836  -3.8    9.5	GX 1+4
264.6709 -44.5204   12.2  16.9 -154.4  -0.0952  -0.9    5.2	4U 1735-44
268.2848  -1.3206    5.9  26.5   15.7  -0.2330  -2.0    9.4	SW J1753.5-0127
270.2153 -24.9415   17.1   3.3   44.3  -0.0706  -0.7    9.1	GX 5-1
270.4794 -25.7513   20.4   2.7   56.5   0.0605   0.6    9.6	GRS 1758-258
273.9111 -14.2201    0.0  14.5   37.5   0.1579   1.5   12.3	GX 17+2
275.7051 -30.2796  737.0   6.7  129.0   0.0016   0.0   12.5	H1820-303
285.1515 -24.7851    5.1  15.2   98.4   0.2652   2.3   10.3	HT1900.1-2455
288.8396  10.9785   10.5  43.5   45.9  -0.4051  -1.1    3.1	GRS 1915+105
263.1762 -33.9114    8.5   7.6 -128.0   0.1368   1.4   10.4	GX 354-0
270.7229 -32.3301    0.7   4.9  173.5   1.6623  16.6 ------	UNKNOWN
279.8439 -53.0811    2.2  26.6 -179.1   0.5914   5.2 ------	UNKNOWN
Post-slew image of 15-350 keV band
Time interval of the image:
67.036600 404.336600

# RAcent  DECcent POSerr Theta    Phi  PeakCts   SNR AngSep     Name
#  [deg]    [deg]    ['] [deg]  [deg]                   [']
244.9764 -15.6408    0.5  28.7  -49.7   9.2757  24.7    0.2	Sco X-1
256.1260 -37.7435    3.4  13.1 -107.5   0.9525   3.4    9.0	4U 1700-377
256.4093 -36.3859   13.1  12.5 -102.0   0.2461   0.9    2.6	GX 349+2
263.1090 -24.8840    6.5  10.0  -33.0   0.4637   1.8    9.9	GX 1+4
264.9622 -44.5755   95.6  13.1 -150.5  -0.0350  -0.1   12.0	4U 1735-44
268.3428  -1.4878    1.6  30.9    6.3   2.2694   7.0    2.6	SW J1753.5-0127
270.2905 -25.0505    1.7   7.3    7.7   1.7417   7.0    1.8	GX 5-1
270.3108 -25.6880    4.0   6.6    7.5   0.7760   3.1    3.3	GRS 1758-258
274.0193 -13.9909    3.4  18.6   21.0   0.9039   3.4    2.8	GX 17+2
275.8567 -30.3120    3.0   4.8   77.6   1.0181   3.8    4.8	H1820-303
285.0520 -25.0538    4.3  14.5   74.5   0.7171   2.7    8.0	HT1900.1-2455
288.7976  10.9824    3.0  46.6   35.7   3.4171   3.9    2.2	GRS 1915+105
263.0938 -33.7964    3.3   6.6  -94.1   0.9851   3.5    5.7	GX 354-0
322.4896 -36.6978    2.6  42.4  121.8   4.8780   4.4 ------	UNKNOWN
311.5024 -46.1973    3.1  34.0  137.0   1.7563   3.8 ------	UNKNOWN
236.0012  11.9969    3.2  55.4  -31.7   5.6540   3.6 ------	UNKNOWN
229.3365  -5.4242    3.7  47.0  -53.2   4.3568   3.2 ------	UNKNOWN
Plot creation:
Sun May 31 06:45:44 EDT 2015