Special notes of this burst
Image
Pre-slew 15.0-350.0 keV image (Event data)
#   RAcent    DECcent   POSerr    Theta     Phi              Peak Cts       SNR   Name
  328.6731   -53.1895   0.0078    45.8481   158.5852         3.1199011     24.663 TRIG_00319016

Foreground time interval of the image:
 -0.352  11.237 (delta_t =  11.589 [sec])
Background time interval of the image:
-239.664  -0.352 (delta_t = 239.312 [sec])
Lightcurves
Notes:
- 1) The mask-weighted light curves are using the flight position.
- 2) Multiple plots of different time binning/intervals are shown to cover all scenarios of short/long GRBs, rate/image triggers, and real/false positives.
- 3) For all the mask-weighted lightcurves, the y-axis units are counts/sec/det where a det is 0.4 x 0.4 = 0.16 sq cm.
- 4) The verticle lines correspond to following: green dotted lines are T50 interval, black dotted lines are T90 interval, blue solid line(s) is a spacecraft slew start time, and orange solid line(s) is a spacecraft slew end time.
- 5) Time of each bin is in the middle of the bin.
1 s binning
From T0-310 s to T0+310 s

From T100_start - 20 s to T100_end + 30 s

Full time interval
64 ms binning
Full time interval
From T100_start to T100_end

From T0-5 sec to T0+5 sec
16 ms binning
From T100_start-5 s to T100_start+5 s
Blue+Cyan dotted lines: Time interval of the scaled map
From 0.000000 to 1.024000
8 ms binning
From T100_start-3 s to T100_start+3 s
Blue+Cyan dotted lines: Time interval of the scaled map
From 0.000000 to 1.024000
2 ms binning
From T100_start-1 s to T100_start+1 s

Blue+Cyan dotted lines: Time interval of the scaled map
From 0.000000 to 1.024000
SN=5 or 10 sec. binning (whichever binning is satisfied first)

SN=5 or 10 sec. binning (T < 200 sec)
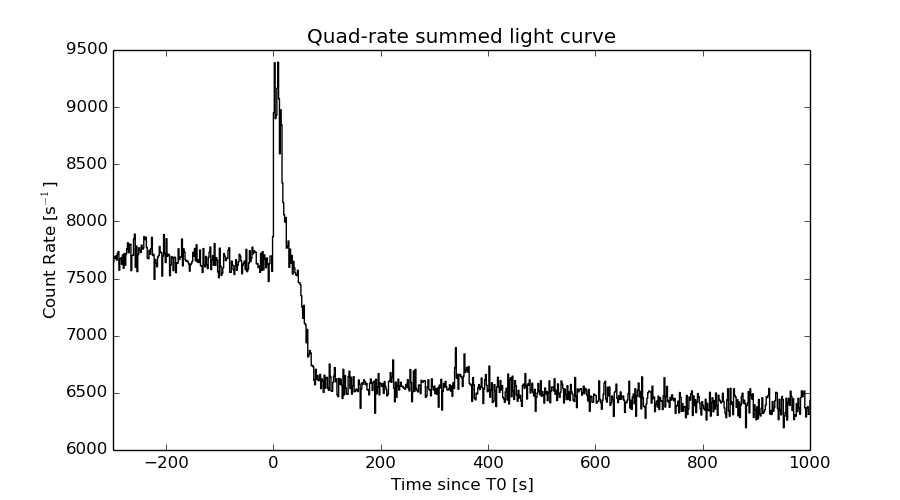
Quad-rate summed light curves (from T0-300s to T0+1000s)
Spectral Evolution

Spectra
Notes:
- 1) The fitting includes the systematic errors.
- 2) When the burst includes telescope slew time periods, the fitting uses an average response file made from multiple 5-s response files through out the slew time plus single time preiod for the non-slew times, and weighted by the total counts in the corresponding time period using addrmf. An average response file is needed becuase a spectral fit using the pre-slew DRM will introduce some errors in both a spectral shape and a normalization if the PHA file contains a lot of the slew/post-slew time interval.
- 3) For fits to more complicated models (e.g. a power-law over a cutoff power-law), the BAT team has decided to require a chi-square improvement of more than 6 for each extra dof.
Time averaged spectrum fit using the average DRM
Power-law model
Time interval is from   -0.352 sec. to  112.856 sec.

Spectral model in power-law:
------------------------------------------------------------
Parameters  : value       lower 90%   higher 90%
Photon index: 1.08729     ( -0.104098   0.102103 )
Norm@50keV  : 3.19232E-03    ( -0.000185688   0.000184387 )
------------------------------------------------------------
#Fit statistic : Chi-Squared =          47.86 using 59 PHA bins.
# Reduced chi-squared =         0.8396 for     57 degrees of freedom
# Null hypothesis probability =   8.005593e-01

Photon flux (15-150 keV)    in 113.2 sec: 0.369843 ( -0.0227895  0.0229227 ) ph/cm2/s
Energy fluence (15-150 keV)             : 3.79368e-06 ( -2.12415e-07  2.12662e-07 ) ergs/cm2
Cutoff power-law model

Time interval is from   -0.352 sec. to  112.856 sec.
Spectral model in the cutoff power-law:
------------------------------------------------------------
Parameters  : value       lower 90%   higher 90%
Photon index: 1.08150     ( -0.430703   0.118299 )
Epeak [keV] : 9999.99      (   )
Norm@50keV  : 3.20960E-03    ( -0.00018575   0.000174597 )
------------------------------------------------------------
#Fit statistic : Chi-Squared =          47.85 using 59 PHA bins.
# Reduced chi-squared =         0.8545 for     56 degrees of freedom
# Null hypothesis probability =   7.725379e-01

Photon flux (15-150 keV)    in 113.2 sec: 0.369681 ( -0.025071  0.022912 ) ph/cm2/s
Energy fluence (15-150 keV)             : 3.78888e-06 ( -2.14718e-07  2.18318e-07 ) ergs/cm2
Band function
Time interval is from   -0.352 sec. to  112.856 sec.

Spectral model in the Band function:
------------------------------------------------------------
Parameters  : value       lower 90%   higher 90%
alpha       : -0.856973   ( 0.857003   0.857003 )
beta        : -1.08729    ( -0.101982   0.104228 )
Epeak [keV] : 55.8122      ( -55.7907 -55.7907 )
Norm@50keV   : 5.66724E-03    ( -0.00208789   0 )
------------------------------------------------------------
#Fit statistic : Chi-Squared =          47.86 using 59 PHA bins.
# Reduced chi-squared =         0.8701 for     55 degrees of freedom
# Null hypothesis probability =   7.417399e-01

Photon flux (15-150 keV)    in 113.2 sec:  (    ) ph/cm2/s
Energy fluence (15-150 keV)             : 0 ( 0  0 ) ergs/cm2
Single BB

Spectral model blackbody:
------------------------------------------------------------
Parameters  : value    Lower 90%  Upper 90%
kT [keV]    : 24.2502  (-1.79247  2.01505)
R^2/D10^2   : 9.32723E-03  (-0.00209972   0.00262865)
(R is the radius in km and D10 is the distance to the source in units of 10 kpc)
------------------------------------------------------------
#Fit statistic : Chi-Squared =         104.93 using 59 PHA bins.
# Reduced chi-squared =         1.8409 for     57 degrees of freedom
# Null hypothesis probability =   1.144996e-04

Energy  Fluence     90% Error
[keV]   [erg/cm2]   [erg/cm2]
15- 25  1.096e-07   1.394e-08
25- 50  6.120e-07   5.779e-08
50-150  2.679e-06   2.224e-07
15-150  3.400e-06   2.270e-07
Thermal bremsstrahlung (OTTB)
Spectral model: thermal bremsstrahlung
------------------------------------------------------------
Parameters  : value         Lower 90%    Upper 90%
kT [keV]    : 199.363       (      )
Norm        : 1.61905       (     )
------------------------------------------------------------
#Fit statistic : Chi-Squared =         115.57 using 59 PHA bins.
# Reduced chi-squared =         2.0276 for     57 degrees of freedom
# Null hypothesis probability =   7.312917e-06

Energy  Fluence     90% Error
[keV]   [erg/cm2]   [erg/cm2]
15- 25  4.564e-07   3.039e-08
25- 50  8.779e-07   6.034e-08
50-150  1.925e-06   3.062e-07
15-150  3.260e-06   4.160e-07
Double BB

Spectral model: bbodyrad<1> + bbodyrad<2>
------------------------------------------------------------
Parameters  : value         Lower 90%    Upper 90%
kT1 [keV]   : 6.43022        (-1.40002      1.81108)
R1^2/D10^2  : 0.394591        (-0.235099      0.668985)
kT2 [keV]   : 31.9189        (-3.79449      5.61349)
R2^2/D10^2  : 3.59127E-03    (-0.00144489   0.00182724)
------------------------------------------------------------
#Fit statistic : Chi-Squared =          45.37 using 59 PHA bins.
# Reduced chi-squared =         0.8248 for     55 degrees of freedom
# Null hypothesis probability =   8.196299e-01

Energy  Fluence     90% Error
[keV]   [erg/cm2]   [erg/cm2]
15- 25  3.316e-07   1.120e-07
25- 50  7.051e-07   1.669e-07
50-150  2.798e-06   3.554e-07
15-150  3.835e-06   5.813e-07
Peak spectrum fit
Power-law model
Time interval is from    1.604 sec. to    2.604 sec.

Spectral model in power-law:
------------------------------------------------------------
Parameters  : value       lower 90%   higher 90%
Photon index: 1.31032     ( -0.24034   0.238197 )
Norm@50keV  : 2.56359E-02    ( -0.00352884   0.00352854 )
------------------------------------------------------------
#Fit statistic : Chi-Squared =          44.63 using 59 PHA bins.
# Reduced chi-squared =         0.7830 for     57 degrees of freedom
# Null hypothesis probability =   8.831824e-01

Photon flux (15-150 keV)    in 1 sec: 3.06433 ( -0.444482  0.446716 ) ph/cm2/s
Energy fluence (15-150 keV)             : 2.52697e-07 ( -3.72758e-08  3.7497e-08 ) ergs/cm2
Cutoff power-law model
Time interval is from    1.604 sec. to    2.604 sec.
Spectral model in the cutoff power-law:
------------------------------------------------------------
Parameters  : value       lower 90%   higher 90%
Photon index: 1.01661     ( -1.09073   0.516144 )
Epeak [keV] : 183.637      ( -183.711 -183.711 )
Norm@50keV  : 3.52087E-02    ( -0.0352026   0.0761767 )
------------------------------------------------------------
#Fit statistic : Chi-Squared =          44.34 using 59 PHA bins.
# Reduced chi-squared =         0.7917 for     56 degrees of freedom
# Null hypothesis probability =   8.697521e-01

Photon flux (15-150 keV)    in 1 sec: 3.02660 ( -0.45878  0.46085 ) ph/cm2/s
Energy fluence (15-150 keV)             : 2.49292e-07 ( -4.0128e-08  3.9132e-08 ) ergs/cm2
Band function
Time interval is from    1.604 sec. to    2.604 sec.

Spectral model in the Band function:
------------------------------------------------------------
Parameters  : value       lower 90%   higher 90%
alpha       : 0.160120   ( 0.109356   4.96901 )
beta        : -1.54081    ( 1.52645   0.397828 )
Epeak [keV] : 59.9142      ( -59.3992 51.3186 )
Norm@50keV   : 0.170311    ( -0.180032   418.81 )
------------------------------------------------------------
#Fit statistic : Chi-Squared =          43.46 using 59 PHA bins.
# Reduced chi-squared =         0.7901 for     55 degrees of freedom
# Null hypothesis probability =   8.694539e-01

Photon flux (15-150 keV)    in 1 sec:  (    ) ph/cm2/s
Energy fluence (15-150 keV)             : 0 ( 0  0 ) ergs/cm2
Single BB
Spectral model blackbody:
------------------------------------------------------------
Parameters  : value    Lower 90%  Upper 90%
kT [keV]    : 17.3920  (-3.0453  3.88973)
R^2/D10^2   : 0.218036  (-0.107671   0.202722)
(R is the radius in km and D10 is the distance to the source in units of 10 kpc)
------------------------------------------------------------
#Fit statistic : Chi-Squared =          54.63 using 59 PHA bins.
# Reduced chi-squared =         0.9584 for     57 degrees of freedom
# Null hypothesis probability =   5.645331e-01

Energy  Fluence     90% Error
[keV]   [erg/cm2]   [erg/cm2]
15- 25  1.334e-08   4.061e-09
25- 50  6.012e-08   1.445e-08
50-150  1.308e-07   3.633e-08
15-150  2.042e-07   4.290e-08
Thermal bremsstrahlung (OTTB)

Spectral model: thermal bremsstrahlung
------------------------------------------------------------
Parameters  : value         Lower 90%    Upper 90%
kT [keV]    : 200.000       (      )
Norm        : 12.8649       (-1.78931     1.78902)
------------------------------------------------------------
#Fit statistic : Chi-Squared =          47.47 using 59 PHA bins.
# Reduced chi-squared =         0.8328 for     57 degrees of freedom
# Null hypothesis probability =   8.117299e-01

Energy  Fluence     90% Error
[keV]   [erg/cm2]   [erg/cm2]
15- 25  3.205e-08   1.846e-08
25- 50  6.165e-08   3.432e-08
50-150  1.352e-07   7.500e-08
15-150  2.289e-07   1.292e-07
Double BB

Spectral model: bbodyrad<1> + bbodyrad<2>
------------------------------------------------------------
Parameters  : value         Lower 90%    Upper 90%
kT1 [keV]   : 10.5608        (-3.37665      3.76676)
R1^2/D10^2  : 0.870387        (-0.508636      1.78079)
kT2 [keV]   : 49.4856        (-26.9528      -52.2816)
R2^2/D10^2  : 5.52564E-03    (-0.00435682   0.0435001)
------------------------------------------------------------
#Fit statistic : Chi-Squared =          42.72 using 59 PHA bins.
# Reduced chi-squared =         0.7768 for     55 degrees of freedom
# Null hypothesis probability =   8.860982e-01

Energy  Fluence     90% Error
[keV]   [erg/cm2]   [erg/cm2]
15- 25  2.158e-08   1.228e-08
25- 50  6.460e-08   3.546e-08
50-150  1.627e-07   8.280e-08
15-150  2.489e-07   1.253e-07
Pre-slew spectrum (Pre-slew PHA with pre-slew DRM)
Power-law model

Spectral model in power-law:
------------------------------------------------------------
Parameters  : value       lower 90%   higher 90%
Photon index: 1.13056     ( -0.0963895   0.0948834 )
Norm@50keV  : 1.85255E-02    ( -0.00104513   0.00104128 )
------------------------------------------------------------
#Fit statistic : Chi-Squared =          47.39 using 59 PHA bins.
# Reduced chi-squared =         0.8313 for     57 degrees of freedom
# Null hypothesis probability =   8.141361e-01

Photon flux (15-150 keV)    in 11.59 sec: 2.15565 ( -0.128962  0.129494 ) ph/cm2/s
Energy fluence (15-150 keV)             : 2.22345e-06 ( -1.24867e-07  1.24987e-07 ) ergs/cm2
Cutoff power-law model

Spectral model in the cutoff power-law:
------------------------------------------------------------
Parameters  : value       lower 90%   higher 90%
Photon index: 0.550187     ( -0.439521   0.39789 )
Epeak [keV] : 151.873      ( -40.1584 181.851 )
Norm@50keV  : 3.23658E-02    ( -0.0100666   0.01604 )
------------------------------------------------------------
#Fit statistic : Chi-Squared =          40.94 using 59 PHA bins.
# Reduced chi-squared =         0.7310 for     56 degrees of freedom
# Null hypothesis probability =   9.346164e-01

Photon flux (15-150 keV)    in 11.59 sec: 2.09095 ( -0.13531  0.13598 ) ph/cm2/s
Energy fluence (15-150 keV)             : 2.18535e-06 ( -1.29866e-07  1.29333e-07 ) ergs/cm2
Band function
Spectral model in the Band function:
------------------------------------------------------------
Parameters  : value       lower 90%   higher 90%
alpha       : -0.550129   ( -0.256564   0.657258 )
beta        : -10.0000    ( 10   3.19744e-14 )
Epeak [keV] : 151.844      ( -34.4059 181.993 )
Norm@50keV   : 3.23670E-02    ( -0.0100697   0.0160329 )
------------------------------------------------------------
#Fit statistic : Chi-Squared =          40.94 using 59 PHA bins.
# Reduced chi-squared =         0.7443 for     55 degrees of freedom
# Null hypothesis probability =   9.208543e-01

Photon flux (15-150 keV)    in 11.59 sec: 2.10369 (    ) ph/cm2/s
Energy fluence (15-150 keV)             : 0 ( 0  0 ) ergs/cm2
S(25-50 keV) vs. S(50-100 keV) plot

S(25-50 keV)  = 7.43e-07
S(50-100 keV) = 1.40e-06
T90 vs. Hardness ratio plot
T90                                   = 37.8720000088215 sec.
Hardness ratio (energy fluence ratio) = 1.88425
Color vs. Color plot

Count Ratio  (25-50 keV) / (15-25 keV) = 1.55245
Count Ratio (50-100 keV) / (15-25 keV) = 1.96362
Mask shadow pattern

IMX = -9.589372706662448E-01, IMY = -3.760898952945209E-01
TIME vs. PHA plot around the trigger time

Blue+Cyan dotted lines: Time interval of the scaled map
From 0.000000 to 1.024000
TIME vs. DetID plot around the trigger time
Blue+Cyan dotted lines: Time interval of the scaled map
From 0.000000 to 1.024000
100 us light curve (15-350 keV)
Blue+Cyan dotted lines: Time interval of the scaled map
From 0.000000 to 1.024000
Spacecraft aspect plot

Bright source in the pre-burst/pre-slew/post-slew images
Pre-burst image of 15-350 keV band
Time interval of the image:
-239.664000 -0.352000

# RAcent  DECcent POSerr Theta    Phi  PeakCts   SNR AngSep     Name
#  [deg]    [deg]    ['] [deg]  [deg]                   [']
244.9825 -15.6379    0.4  28.7  -36.9   6.8397  30.7    0.2	Sco X-1
255.9877 -37.8502    3.1  13.2  -95.1   0.7682   3.8    0.4	4U 1700-377
256.4674 -36.4365    3.0  12.4  -89.6   0.7698   3.9    1.7	GX 349+2
263.1509 -24.6669   16.2  10.1  -19.1   0.1246   0.7    9.1	GX 1+4
264.8966 -44.3221   13.9  12.8 -137.3   0.1564   0.8   10.1	4U 1735-44
268.2079  -1.3543    3.6  31.1   18.8   0.7112   3.2   11.3	SW J1753.5-0127
270.3559 -24.9439    3.9   7.4   21.3   0.5463   3.0    9.0	GX 5-1
270.3696 -25.8288    5.1   6.5   21.1   0.4239   2.3    6.3	GRS 1758-258
273.8139 -13.9863    4.3  18.6   33.2   0.5135   2.7   11.6	GX 17+2
275.9311 -30.3649    2.5   4.9   91.4   0.8789   4.5    0.3	H1820-303
284.8983 -25.0040    8.1  14.4   86.8  -0.3080  -1.4    9.0	HT1900.1-2455
263.0922 -33.8339    3.2   6.5  -81.7   0.7166   3.6    5.1	GX 354-0
327.8765 -39.2014    2.9  46.1  139.1   3.0169   4.0 ------	UNKNOWN
286.1352   6.0921    2.4  41.1   47.4   2.5788   4.9 ------	UNKNOWN
208.4083 -71.9101    3.7  50.9 -135.6   3.6196   3.1 ------	UNKNOWN
Pre-slew background subtracted image of 15-350 keV band
Time interval of the image:
-0.352000 11.236600

# RAcent  DECcent POSerr Theta    Phi  PeakCts   SNR AngSep     Name
#  [deg]    [deg]    ['] [deg]  [deg]                   [']
244.9665 -15.4941    4.3  28.8  -36.7   0.1244   2.7    8.8	Sco X-1
255.8885 -37.9116   76.8  13.3  -95.3   0.0064   0.2    6.2	4U 1700-377
256.4868 -36.2594    6.5  12.4  -88.8  -0.0778  -1.8   10.1	GX 349+2
263.1052 -24.5537  284.4  10.2  -18.9  -0.0015  -0.0   12.7	GX 1+4
264.7765 -44.5722    3.7  13.1 -137.4   0.1223   3.1    7.5	4U 1735-44
268.2634  -1.3337    6.0  31.1   19.0  -0.0957  -1.9    9.5	SW J1753.5-0127
270.3731 -24.8919   31.4   7.4   21.4   0.0147   0.4   12.2	GX 5-1
270.2400 -25.6997   22.5   6.6   20.1  -0.0203  -0.5    4.3	GRS 1758-258
273.8279 -14.0136    9.2  18.5   33.3  -0.0514  -1.3   10.4	GX 17+2
275.8171 -30.4198   33.5   4.8   91.5  -0.0140  -0.3    6.4	H1820-303
285.1443 -24.9631    4.5  14.6   87.2   0.1177   2.6    6.4	HT1900.1-2455
263.0263 -33.7143    2.9   6.6  -80.6   0.1500   4.0    7.5	GX 354-0
328.6731 -53.1895    0.5  45.8  158.6   3.1200  24.7 ------	UNKNOWN
261.2148  -2.0594    2.1  31.6    5.3   0.2579   5.5 ------	UNKNOWN
326.9480 -71.7117    2.0  49.1 -176.5   0.5411   5.8 ------	UNKNOWN
263.1379 -74.1530    2.1  42.0 -153.3   0.3587   5.5 ------	UNKNOWN
233.6706  -5.1709    2.4  43.9  -36.1   0.3533   4.7 ------	UNKNOWN
202.9689 -78.7294    3.1  54.1 -143.4   0.7148   3.7 ------	UNKNOWN
222.4572 -26.7876    2.1  42.0  -71.7   0.8105   5.5 ------	UNKNOWN
Post-slew image of 15-350 keV band
Time interval of the image:
87.436600 962.426400

# RAcent  DECcent POSerr Theta    Phi  PeakCts   SNR AngSep     Name
#  [deg]    [deg]    ['] [deg]  [deg]                   [']
255.9610 -37.7252    4.5  50.9    8.0   3.2549   2.6    7.2	4U 1700-377
256.4659 -36.3281    7.6  51.5    9.7   2.0893   1.5    5.9	GX 349+2
264.7484 -44.4770    4.7  41.5    6.6   1.6141   2.5    1.6	4U 1735-44
270.2392 -25.8484    4.2  50.9   29.9   5.4183   2.7    7.2	GRS 1758-258
275.8514 -30.3308    2.9  44.2   30.8   4.1469   3.9    4.4	H1820-303
285.1053 -24.9657    5.7  43.0   44.9   2.5225   2.0    4.6	HT1900.1-2455
263.0130 -33.8607    3.1  49.4   16.8   4.1531   3.7    2.0	GX 354-0
341.0817 -47.3037    3.5   9.9  169.6   1.2836   3.3 ------	UNKNOWN
326.7799 -56.8035    2.7   3.8  -52.7   1.8842   4.4 ------	UNKNOWN
238.8310 -44.4972    2.8  55.8   -9.1   6.7723   4.2 ------	UNKNOWN
208.3047 -68.4781    4.8  50.7  -44.6   6.9363   2.4 ------	UNKNOWN
 48.1654 -43.5586    3.5  50.9 -135.4  10.0354   3.3 ------	UNKNOWN
Plot creation:
Sun May 31 06:43:16 EDT 2015