Special notes of this burst
Image
Pre-slew 15.0-350.0 keV image (Event data)
#   RAcent    DECcent   POSerr    Theta     Phi              Peak Cts       SNR   Name
  314.2230   -62.4366   0.0051    11.9906   -34.9244         1.9317205     37.938 TRIG_00319036

Foreground time interval of the image:
 -6.512  15.573 (delta_t =  22.085 [sec])
Background time interval of the image:
-239.728  -6.512 (delta_t = 233.216 [sec])
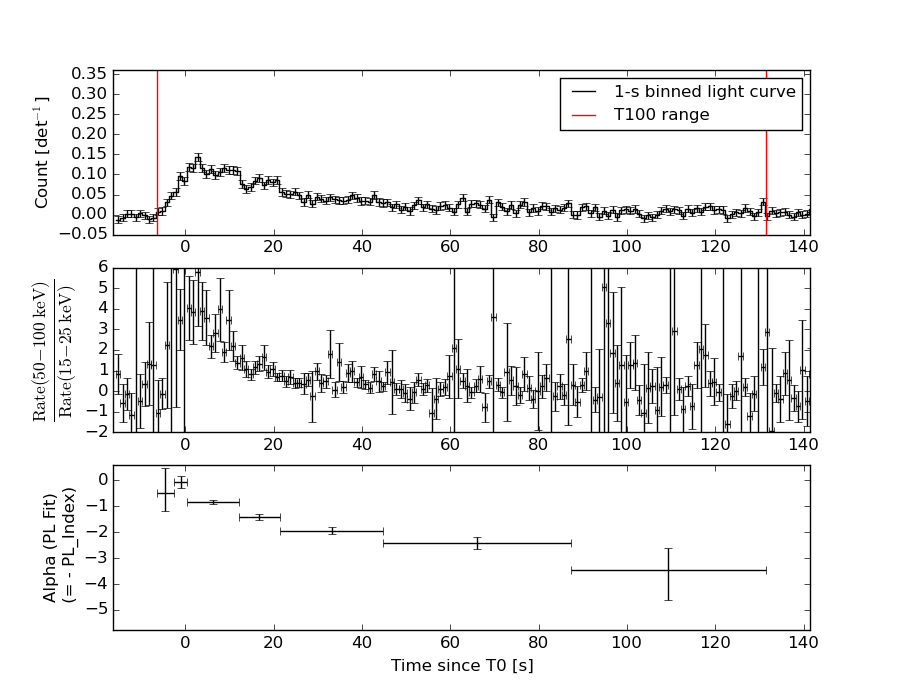
Lightcurves
Notes:
- 1) The mask-weighted light curves are using the flight position.
- 2) Multiple plots of different time binning/intervals are shown to cover all scenarios of short/long GRBs, rate/image triggers, and real/false positives.
- 3) For all the mask-weighted lightcurves, the y-axis units are counts/sec/det where a det is 0.4 x 0.4 = 0.16 sq cm.
- 4) The verticle lines correspond to following: green dotted lines are T50 interval, black dotted lines are T90 interval, blue solid line(s) is a spacecraft slew start time, and orange solid line(s) is a spacecraft slew end time.
- 5) Time of each bin is in the middle of the bin.
1 s binning
From T0-310 s to T0+310 s
From T100_start - 20 s to T100_end + 30 s
Full time interval

64 ms binning
Full time interval

From T100_start to T100_end
From T0-5 sec to T0+5 sec
16 ms binning
From T100_start-5 s to T100_start+5 s
Blue+Cyan dotted lines: Time interval of the scaled map
From 0.000000 to 1.024000
8 ms binning
From T100_start-3 s to T100_start+3 s
Blue+Cyan dotted lines: Time interval of the scaled map
From 0.000000 to 1.024000
2 ms binning
From T100_start-1 s to T100_start+1 s

Blue+Cyan dotted lines: Time interval of the scaled map
From 0.000000 to 1.024000
SN=5 or 10 sec. binning (whichever binning is satisfied first)
SN=5 or 10 sec. binning (T < 200 sec)
Quad-rate summed light curves (from T0-300s to T0+1000s)

Spectral Evolution
Spectra
Notes:
- 1) The fitting includes the systematic errors.
- 2) When the burst includes telescope slew time periods, the fitting uses an average response file made from multiple 5-s response files through out the slew time plus single time preiod for the non-slew times, and weighted by the total counts in the corresponding time period using addrmf. An average response file is needed becuase a spectral fit using the pre-slew DRM will introduce some errors in both a spectral shape and a normalization if the PHA file contains a lot of the slew/post-slew time interval.
- 3) For fits to more complicated models (e.g. a power-law over a cutoff power-law), the BAT team has decided to require a chi-square improvement of more than 6 for each extra dof.
Time averaged spectrum fit using the average DRM
Power-law model

Time interval is from   -6.512 sec. to  131.472 sec.

Spectral model in power-law:
------------------------------------------------------------
Parameters  : value       lower 90%   higher 90%
Photon index: 1.51567     ( -0.0808513   0.0811204 )
Norm@50keV  : 2.02720E-03    ( -8.60568e-05   8.57587e-05 )
------------------------------------------------------------
#Fit statistic : Chi-Squared =          56.77 using 59 PHA bins.
# Reduced chi-squared =         0.9960 for     57 degrees of freedom
# Null hypothesis probability =   4.835136e-01

Photon flux (15-150 keV)    in 138 sec: 0.254156 ( -0.011029  0.0110608 ) ph/cm2/s
Energy fluence (15-150 keV)             : 2.64723e-06 ( -1.23383e-07  1.24019e-07 ) ergs/cm2
Cutoff power-law model

Time interval is from   -6.512 sec. to  131.472 sec.
Spectral model in the cutoff power-law:
------------------------------------------------------------
Parameters  : value       lower 90%   higher 90%
Photon index: 1.51322     ( -0.195723   0.109005 )
Epeak [keV] : 1.00000E+04      (   )
Norm@50keV  : 2.03299E-03    ( -8.42665e-05   8.41075e-05 )
------------------------------------------------------------
#Fit statistic : Chi-Squared =          56.79 using 59 PHA bins.
# Reduced chi-squared =          1.014 for     56 degrees of freedom
# Null hypothesis probability =   4.453515e-01

Photon flux (15-150 keV)    in 138 sec: 0.254221 ( -0.011216  0.010882 ) ph/cm2/s
Energy fluence (15-150 keV)             : 2.64684e-06 ( -1.23758e-07  1.22268e-07 ) ergs/cm2
Band function
Time interval is from   -6.512 sec. to  131.472 sec.

Spectral model in the Band function:
------------------------------------------------------------
Parameters  : value       lower 90%   higher 90%
alpha       : -0.778793   ( 1.08716   1.08716 )
beta        : -1.53008    ( -0.100578   0.0880129 )
Epeak [keV] : 42.2784      ( -42.2184 583.077 )
Norm@50keV   : 7.04162E-03    ( -0.00715889   460.101 )
------------------------------------------------------------
#Fit statistic : Chi-Squared =          56.54 using 59 PHA bins.
# Reduced chi-squared =          1.028 for     55 degrees of freedom
# Null hypothesis probability =   4.172656e-01

Photon flux (15-150 keV)    in 138 sec:  (    ) ph/cm2/s
Energy fluence (15-150 keV)             : 0 ( 0  0 ) ergs/cm2
Single BB
Spectral model blackbody:
------------------------------------------------------------
Parameters  : value    Lower 90%  Upper 90%
kT [keV]    : 15.7288  (  )
R^2/D10^2   : 2.31152E-02  (   )
(R is the radius in km and D10 is the distance to the source in units of 10 kpc)
------------------------------------------------------------
#Fit statistic : Chi-Squared =         222.38 using 59 PHA bins.
# Reduced chi-squared =         3.9014 for     57 degrees of freedom
# Null hypothesis probability =   2.193746e-21

Energy  Fluence     90% Error
[keV]   [erg/cm2]   [erg/cm2]
15- 25  1.638e-07   1.387e-08
25- 50  6.790e-07   3.926e-08
50-150  1.166e-06   1.001e-07
15-150  2.009e-06   1.069e-07
Thermal bremsstrahlung (OTTB)
Spectral model: thermal bremsstrahlung
------------------------------------------------------------
Parameters  : value         Lower 90%    Upper 90%
kT [keV]    : 200.000       (      )
Norm        : 1.03210       (-0.0427813     0.042781)
------------------------------------------------------------
#Fit statistic : Chi-Squared =          62.87 using 59 PHA bins.
# Reduced chi-squared =          1.103 for     57 degrees of freedom
# Null hypothesis probability =   2.763337e-01

Energy  Fluence     90% Error
[keV]   [erg/cm2]   [erg/cm2]
15- 25  3.547e-07   1.518e-08
25- 50  6.823e-07   3.091e-08
50-150  1.496e-06   6.486e-08
15-150  2.533e-06   1.283e-07
Double BB

Spectral model: bbodyrad<1> + bbodyrad<2>
------------------------------------------------------------
Parameters  : value         Lower 90%    Upper 90%
kT1 [keV]   : 6.35092        (-0.717083      0.797207)
R1^2/D10^2  : 0.395790        (-0.14018      0.232578)
kT2 [keV]   : 27.6896        (-3.16514      4.26537)
R2^2/D10^2  : 2.80079E-03    (-0.00105608   0.00145112)
------------------------------------------------------------
#Fit statistic : Chi-Squared =          50.75 using 59 PHA bins.
# Reduced chi-squared =         0.9227 for     55 degrees of freedom
# Null hypothesis probability =   6.377323e-01

Energy  Fluence     90% Error
[keV]   [erg/cm2]   [erg/cm2]
15- 25  3.649e-07   4.388e-08
25- 50  6.458e-07   5.568e-08
50-150  1.653e-06   2.035e-07
15-150  2.664e-06   2.670e-07
Peak spectrum fit
Power-law model

Time interval is from    2.300 sec. to    3.300 sec.

Spectral model in power-law:
------------------------------------------------------------
Parameters  : value       lower 90%   higher 90%
Photon index: 0.579819     ( -0.204226   0.192157 )
Norm@50keV  : 8.86654E-03    ( -0.00111754   0.00109626 )
------------------------------------------------------------
#Fit statistic : Chi-Squared =          61.35 using 59 PHA bins.
# Reduced chi-squared =          1.076 for     57 degrees of freedom
# Null hypothesis probability =   3.229293e-01

Photon flux (15-150 keV)    in 1 sec: 1.03786 ( -0.118924  0.119364 ) ph/cm2/s
Energy fluence (15-150 keV)             : 1.14495e-07 ( -1.32404e-08  1.32846e-08 ) ergs/cm2
Cutoff power-law model
Time interval is from    2.300 sec. to    3.300 sec.
Spectral model in the cutoff power-law:
------------------------------------------------------------
Parameters  : value       lower 90%   higher 90%
Photon index: -0.629893     ( -1.26104   0.956168 )
Epeak [keV] : 138.211      ( -39.1404 252.662 )
Norm@50keV  : 2.64318E-02    ( -0.0150495   0.0481574 )
------------------------------------------------------------
#Fit statistic : Chi-Squared =          56.43 using 59 PHA bins.
# Reduced chi-squared =          1.008 for     56 degrees of freedom
# Null hypothesis probability =   4.586670e-01

Photon flux (15-150 keV)    in 1 sec: 0.998480 ( -0.123428  0.12352 ) ph/cm2/s
Energy fluence (15-150 keV)             : 1.10422e-07 ( -1.45112e-08  1.4232e-08 ) ergs/cm2
Band function

Time interval is from    2.300 sec. to    3.300 sec.

Spectral model in the Band function:
------------------------------------------------------------
Parameters  : value       lower 90%   higher 90%
alpha       : 5.00000   ( -5   -5 )
beta        : -0.584209    ( -0.192474   0.204428 )
Epeak [keV] : 20.2812      ( -18.5323 -18.5323 )
Norm@50keV   : 1288.83    ( -141.032   770190 )
------------------------------------------------------------
#Fit statistic : Chi-Squared =          61.28 using 59 PHA bins.
# Reduced chi-squared =          1.114 for     55 degrees of freedom
# Null hypothesis probability =   2.610432e-01

Photon flux (15-150 keV)    in 1 sec:  (    ) ph/cm2/s
Energy fluence (15-150 keV)             : 0 ( 0  0 ) ergs/cm2
Single BB
Spectral model blackbody:
------------------------------------------------------------
Parameters  : value    Lower 90%  Upper 90%
kT [keV]    : 28.5940  (-3.9992  5.23728)
R^2/D10^2   : 1.91602E-02  (-0.00722663   0.0105353)
(R is the radius in km and D10 is the distance to the source in units of 10 kpc)
------------------------------------------------------------
#Fit statistic : Chi-Squared =          57.48 using 59 PHA bins.
# Reduced chi-squared =          1.008 for     57 degrees of freedom
# Null hypothesis probability =   4.573593e-01

Energy  Fluence     90% Error
[keV]   [erg/cm2]   [erg/cm2]
15- 25  2.523e-09   6.180e-10
25- 50  1.525e-08   2.890e-09
50-150  8.961e-08   1.577e-08
15-150  1.074e-07   1.687e-08
Thermal bremsstrahlung (OTTB)
Spectral model: thermal bremsstrahlung
------------------------------------------------------------
Parameters  : value         Lower 90%    Upper 90%
kT [keV]    : 199.363       (      )
Norm        : 3.80749       (     )
------------------------------------------------------------
#Fit statistic : Chi-Squared =         125.69 using 59 PHA bins.
# Reduced chi-squared =         2.2052 for     57 degrees of freedom
# Null hypothesis probability =   4.377914e-07

Energy  Fluence     90% Error
[keV]   [erg/cm2]   [erg/cm2]
15- 25  9.481e-09   5.390e-09
25- 50  1.824e-08   1.014e-08
50-150  4.000e-08   2.232e-08
15-150  6.772e-08   3.783e-08
Double BB

R1^2/D10^2  : 3.18120E-02        (-0.0326897      -0.0326897)
kT2 [keV]   : 200.000        (      )
R2^2/D10^2  : 1.32756E-04    (-0.000132785   -0.000132785)
------------------------------------------------------------
#Fit statistic : Chi-Squared =          57.48 using 59 PHA bins.
#Fit statistic : Chi-Squared =          55.64 using 59 PHA bins.
#Fit statistic : Chi-Squared =          55.48 using 59 PHA bins.
# Reduced chi-squared =          1.045 for     55 degrees of freedom
# Reduced chi-squared =          1.012 for     55 degrees of freedom
# Reduced chi-squared =          1.009 for     55 degrees of freedom
# Null hypothesis probability =   3.835419e-01
# Null hypothesis probability =   4.503604e-01
# Null hypothesis probability =   4.564807e-01

Energy  Fluence     90% Error
[keV]   [erg/cm2]   [erg/cm2]
15- 25  0.000e+00   0.000e+00
25- 50  0.000e+00   0.000e+00
50-150  0.000e+00   0.000e+00
15-150  0.000e+00   0.000e+00
Pre-slew spectrum (Pre-slew PHA with pre-slew DRM)
Power-law model

Spectral model in power-law:
------------------------------------------------------------
Parameters  : value       lower 90%   higher 90%
Photon index: 0.799183     ( -0.0688414   0.0677543 )
Norm@50keV  : 5.75713E-03    ( -0.000233018   0.00023195 )
------------------------------------------------------------
#Fit statistic : Chi-Squared =          68.72 using 59 PHA bins.
# Reduced chi-squared =          1.206 for     57 degrees of freedom
# Null hypothesis probability =   1.373700e-01

Photon flux (15-150 keV)    in 22.08 sec: 0.661698 ( -0.0261492  0.0261904 ) ph/cm2/s
Energy fluence (15-150 keV)             : 1.48599e-06 ( -5.95453e-08  5.96319e-08 ) ergs/cm2
Cutoff power-law model

Spectral model in the cutoff power-law:
------------------------------------------------------------
Parameters  : value       lower 90%   higher 90%
Photon index: 7.51647E-02     ( -0.336316   0.310512 )
Epeak [keV] : 164.469      ( -32.7177 74.0292 )
Norm@50keV  : 1.13355E-02    ( -0.0027773   0.00395725 )
------------------------------------------------------------
#Fit statistic : Chi-Squared =          51.29 using 59 PHA bins.
# Reduced chi-squared =         0.9158 for     56 degrees of freedom
# Null hypothesis probability =   6.535757e-01

Photon flux (15-150 keV)    in 22.08 sec: 0.641420 ( -0.027405  0.027454 ) ph/cm2/s
Energy fluence (15-150 keV)             : 1.44805e-06 ( -6.34668e-08  6.31709e-08 ) ergs/cm2
Band function

Spectral model in the Band function:
------------------------------------------------------------
Parameters  : value       lower 90%   higher 90%
alpha       : 5.00000   ( -5   -5 )
beta        : -0.800851    ( -0.0677611   0.0691367 )
Epeak [keV] : 18.7867      ( -18.0026 9979.23 )
Norm@50keV   : 1656.64    ( -62.1142   591173 )
------------------------------------------------------------
#Fit statistic : Chi-Squared =          68.56 using 59 PHA bins.
# Reduced chi-squared =          1.246 for     55 degrees of freedom
# Null hypothesis probability =   1.035213e-01

Photon flux (15-150 keV)    in 22.08 sec:  (    ) ph/cm2/s
Energy fluence (15-150 keV)             : 0 ( 0  0 ) ergs/cm2
S(25-50 keV) vs. S(50-100 keV) plot
S(25-50 keV)  = 6.60e-07
S(50-100 keV) = 9.23e-07
T90 vs. Hardness ratio plot
T90                                   = 106.624000012875 sec.
Hardness ratio (energy fluence ratio) = 1.39848
Color vs. Color plot
Count Ratio  (25-50 keV) / (15-25 keV) = 1.22223
Count Ratio (50-100 keV) / (15-25 keV) = 0.949694
Mask shadow pattern

IMX = 1.741365060462937E-01, IMY = 1.215893857885950E-01
TIME vs. PHA plot around the trigger time

Blue+Cyan dotted lines: Time interval of the scaled map
From 0.000000 to 1.024000
TIME vs. DetID plot around the trigger time
Blue+Cyan dotted lines: Time interval of the scaled map
From 0.000000 to 1.024000
100 us light curve (15-350 keV)
Blue+Cyan dotted lines: Time interval of the scaled map
From 0.000000 to 1.024000
Spacecraft aspect plot

Bright source in the pre-burst/pre-slew/post-slew images
Pre-burst image of 15-350 keV band
Time interval of the image:
-239.728000 -6.512000

# RAcent  DECcent POSerr Theta    Phi  PeakCts   SNR AngSep     Name
#  [deg]    [deg]    ['] [deg]  [deg]                   [']
256.0443 -37.7596    4.2  50.8    8.0   1.3435   2.7    5.8	4U 1700-377
256.4771 -36.3710    4.7  51.5    9.6  -1.3210  -2.5    3.7	GX 349+2
264.7311 -44.4512   33.1  41.5    6.5   0.0953   0.3    0.5	4U 1735-44
270.3765 -25.6387    4.8  50.9   30.1   1.9830   2.4    7.4	GRS 1758-258
275.7555 -30.3514   11.5  44.3   30.6   0.3885   1.0    8.8	H1820-303
285.1307 -24.9539    4.3  43.0   44.9   1.3647   2.7    5.5	HT1900.1-2455
263.1043 -33.9565   13.1  49.3   16.7   0.4338   0.9    9.3	GX 354-0
 26.3358 -16.0039    2.4  58.1 -175.6   5.0351   4.7 ------	UNKNOWN
208.3459 -68.4816    3.2  50.7  -44.6   3.7079   3.7 ------	UNKNOWN
Pre-slew background subtracted image of 15-350 keV band
Time interval of the image:
-6.512000 15.572610

# RAcent  DECcent POSerr Theta    Phi  PeakCts   SNR AngSep     Name
#  [deg]    [deg]    ['] [deg]  [deg]                   [']
256.1195 -37.8067    3.5  50.8    8.0  -0.5032  -3.3    6.7	4U 1700-377
256.4096 -36.3623    6.4  51.6    9.6   0.3048   1.8    3.9	GX 349+2
264.4748 -44.4784    0.0  41.7    6.3  -0.1438  -1.7   11.6	4U 1735-44
270.1378 -25.7544    3.4  51.0   29.8   0.8845   3.4    8.9	GRS 1758-258
275.9846 -30.2603    5.6  44.2   30.9   0.2732   2.1    7.1	H1820-303
285.0074 -24.9651   27.8  43.0   44.7   0.0714   0.4    3.1	HT1900.1-2455
262.8739 -33.8523   10.2  49.5   16.6   0.1785   1.1    5.8	GX 354-0
314.2230 -62.4366    0.3  12.0  -34.9   1.9318  37.9 ------	UNKNOWN
289.8638 -66.8312    2.5  23.1  -29.8   0.2392   4.7 ------	UNKNOWN
Post-slew image of 15-350 keV band
Time interval of the image:
51.772590 422.372000

# RAcent  DECcent POSerr Theta    Phi  PeakCts   SNR AngSep     Name
#  [deg]    [deg]    ['] [deg]  [deg]                   [']
255.9842 -37.8450   42.1  42.6    5.4   0.6329   0.3    0.1	4U 1700-377
256.5724 -36.5259   21.7  43.4    7.0  -1.2587  -0.5    9.0	GX 349+2
263.1337 -24.8369   31.3  50.5   22.0   1.7972   0.4    8.7	GX 1+4
264.9835 -44.4876    8.6  33.2    7.5   2.3303   1.3   10.5	4U 1735-44
270.4776 -25.0918   23.5  47.2   29.7  -1.9671  -0.5   10.5	GX 5-1
270.3083 -25.7019    6.3  46.8   29.1   7.1700   1.8    2.5	GRS 1758-258
275.8632 -30.2065    0.0  40.6   32.7   0.5534   0.2   10.1	H1820-303
285.1902 -24.9427    5.1  42.2   47.3  -8.9669  -2.3    8.5	HT1900.1-2455
263.1007 -33.7624    4.8  42.8   15.8   6.2160   2.4    7.1	GX 354-0
277.4083 -23.7949    3.1  45.8   38.4  16.0736   3.7 ------	UNKNOWN
295.2957 -28.0862    2.3  36.5   59.5  15.2112   4.9 ------	UNKNOWN
257.5981 -31.6568    2.1  47.0   11.8  16.0681   5.5 ------	UNKNOWN
 22.1302 -46.0447    2.3  40.6 -172.8  10.2014   5.0 ------	UNKNOWN
Plot creation:
Sun May 31 06:41:28 EDT 2015