Special notes of this burst
Image
Pre-slew 15.0-350.0 keV image (Event data)
#   RAcent    DECcent   POSerr    Theta     Phi              Peak Cts       SNR   Name
  228.0570   -80.5379   0.0127    26.2719  -109.9811         2.5864169     15.203 TRIG_00323984

Foreground time interval of the image:
-104.996  12.877 (delta_t = 117.873 [sec])
Background time interval of the image:
-239.424 -104.996 (delta_t = 134.428 [sec])
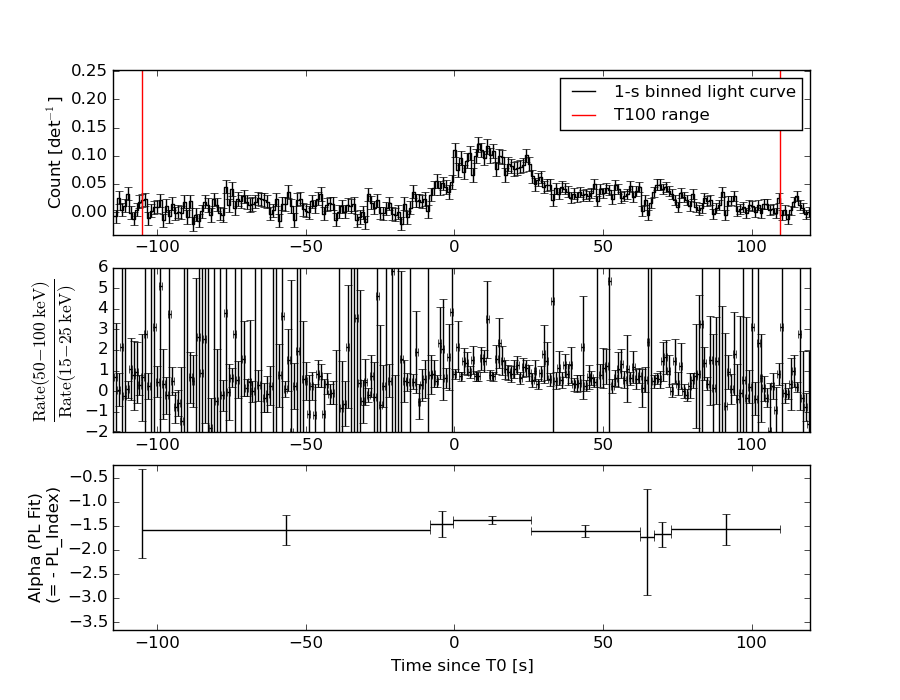
Lightcurves
Notes:
- 1) The mask-weighted light curves are using the flight position.
- 2) Multiple plots of different time binning/intervals are shown to cover all scenarios of short/long GRBs, rate/image triggers, and real/false positives.
- 3) For all the mask-weighted lightcurves, the y-axis units are counts/sec/det where a det is 0.4 x 0.4 = 0.16 sq cm.
- 4) The verticle lines correspond to following: green dotted lines are T50 interval, black dotted lines are T90 interval, blue solid line(s) is a spacecraft slew start time, and orange solid line(s) is a spacecraft slew end time.
- 5) Time of each bin is in the middle of the bin.
1 s binning
From T0-310 s to T0+310 s
From T100_start - 20 s to T100_end + 30 s

Full time interval
64 ms binning
Full time interval
From T100_start to T100_end

From T0-5 sec to T0+5 sec
16 ms binning
From T100_start-5 s to T100_start+5 s
Blue+Cyan dotted lines: Time interval of the scaled map
From 0.000000 to 1.024000
8 ms binning
From T100_start-3 s to T100_start+3 s

Blue+Cyan dotted lines: Time interval of the scaled map
From 0.000000 to 1.024000
2 ms binning
From T100_start-1 s to T100_start+1 s
Blue+Cyan dotted lines: Time interval of the scaled map
From 0.000000 to 1.024000
SN=5 or 10 sec. binning (whichever binning is satisfied first)
SN=5 or 10 sec. binning (T < 200 sec)
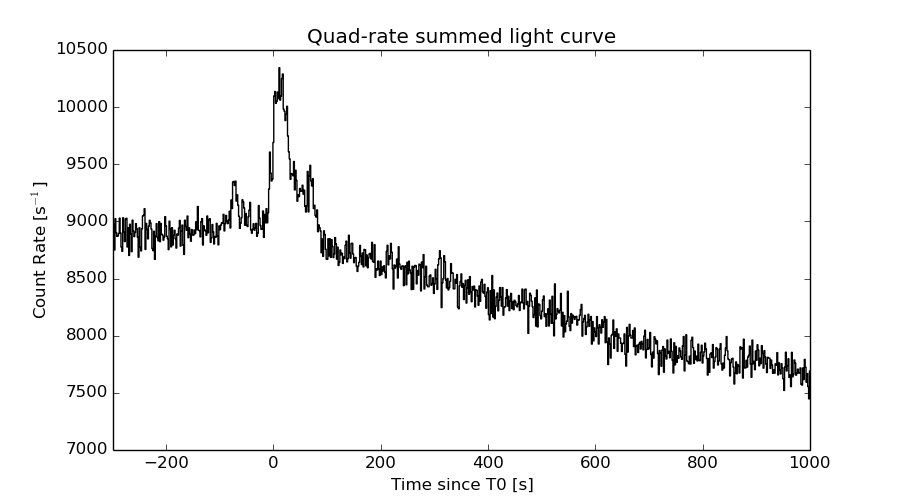
Quad-rate summed light curves (from T0-300s to T0+1000s)
Spectral Evolution
Spectra
Notes:
- 1) The fitting includes the systematic errors.
- 2) When the burst includes telescope slew time periods, the fitting uses an average response file made from multiple 5-s response files through out the slew time plus single time preiod for the non-slew times, and weighted by the total counts in the corresponding time period using addrmf. An average response file is needed becuase a spectral fit using the pre-slew DRM will introduce some errors in both a spectral shape and a normalization if the PHA file contains a lot of the slew/post-slew time interval.
- 3) For fits to more complicated models (e.g. a power-law over a cutoff power-law), the BAT team has decided to require a chi-square improvement of more than 6 for each extra dof.
Time averaged spectrum fit using the average DRM
Power-law model

Time interval is from -104.996 sec. to  109.556 sec.

Spectral model in power-law:
------------------------------------------------------------
Parameters  : value       lower 90%   higher 90%
Photon index: 1.51673     ( -0.0843159   0.0845144 )
Norm@50keV  : 1.79826E-03    ( -8.30342e-05   8.27559e-05 )
------------------------------------------------------------
#Fit statistic : Chi-Squared =          43.81 using 59 PHA bins.
# Reduced chi-squared =         0.7686 for     57 degrees of freedom
# Null hypothesis probability =   9.000920e-01

Photon flux (15-150 keV)    in 214.6 sec: 0.225518 ( -0.0105954  0.010614 ) ph/cm2/s
Energy fluence (15-150 keV)             : 3.6511e-06 ( -1.83964e-07  1.84915e-07 ) ergs/cm2
Cutoff power-law model

Time interval is from -104.996 sec. to  109.556 sec.
Spectral model in the cutoff power-law:
------------------------------------------------------------
Parameters  : value       lower 90%   higher 90%
Photon index: 1.39107     ( -0.325188   0.16945 )
Epeak [keV] : 243.438      ( -243.441 -243.441 )
Norm@50keV  : 2.07819E-03    ( -0.000350043   0.000913732 )
------------------------------------------------------------
#Fit statistic : Chi-Squared =          43.32 using 59 PHA bins.
# Reduced chi-squared =         0.7736 for     56 degrees of freedom
# Null hypothesis probability =   8.921391e-01

Photon flux (15-150 keV)    in 214.6 sec: 0.223798 ( -0.011336  0.01132 ) ph/cm2/s
Energy fluence (15-150 keV)             : 3.61163e-06 ( -2.10523e-07  2.08591e-07 ) ergs/cm2
Band function
Time interval is from -104.996 sec. to  109.556 sec.

Spectral model in the Band function:
------------------------------------------------------------
Parameters  : value       lower 90%   higher 90%
alpha       : 0.255356   ( -1.5189   0.413593 )
beta        : -1.59947    ( -0.146823   0.111928 )
Epeak [keV] : 37.3281      ( -14.7465 65.3773 )
Norm@50keV   : 2.89143E-02    ( -0.0299269   70.7479 )
------------------------------------------------------------
#Fit statistic : Chi-Squared =          40.36 using 59 PHA bins.
# Reduced chi-squared =         0.7338 for     55 degrees of freedom
# Null hypothesis probability =   9.303579e-01

Photon flux (15-150 keV)    in 214.6 sec:  (    ) ph/cm2/s
Energy fluence (15-150 keV)             : 0 ( 0  0 ) ergs/cm2
Single BB
Spectral model blackbody:
------------------------------------------------------------
Parameters  : value    Lower 90%  Upper 90%
kT [keV]    : 14.8021  (  )
R^2/D10^2   : 2.57014E-02  (   )
(R is the radius in km and D10 is the distance to the source in units of 10 kpc)
------------------------------------------------------------
#Fit statistic : Chi-Squared =         160.54 using 59 PHA bins.
# Reduced chi-squared =         2.8164 for     57 degrees of freedom
# Null hypothesis probability =   8.598964e-12

Energy  Fluence     90% Error
[keV]   [erg/cm2]   [erg/cm2]
15- 25  2.535e-07   2.275e-08
25- 50  9.950e-07   6.041e-08
50-150  1.475e-06   1.382e-07
15-150  2.723e-06   1.395e-07
Thermal bremsstrahlung (OTTB)

Spectral model: thermal bremsstrahlung
------------------------------------------------------------
Parameters  : value         Lower 90%    Upper 90%
kT [keV]    : 200.000       (      )
Norm        : 0.918128       (-0.0413815     0.0413665)
------------------------------------------------------------
#Fit statistic : Chi-Squared =          44.72 using 59 PHA bins.
# Reduced chi-squared =         0.7845 for     57 degrees of freedom
# Null hypothesis probability =   8.812976e-01

Energy  Fluence     90% Error
[keV]   [erg/cm2]   [erg/cm2]
15- 25  4.908e-07   2.554e-08
25- 50  9.441e-07   4.700e-08
50-150  2.071e-06   1.164e-07
15-150  3.505e-06   1.921e-07
Double BB

Spectral model: bbodyrad<1> + bbodyrad<2>
------------------------------------------------------------
Parameters  : value         Lower 90%    Upper 90%
kT1 [keV]   : 7.51679        (-0.957312      1.03786)
R1^2/D10^2  : 0.194516        (-0.067505      0.114935)
kT2 [keV]   : 30.3636        (-4.90523      7.7596)
R2^2/D10^2  : 1.69320E-03    (-0.000877875   0.0014272)
------------------------------------------------------------
#Fit statistic : Chi-Squared =          39.14 using 59 PHA bins.
# Reduced chi-squared =         0.7117 for     55 degrees of freedom
# Null hypothesis probability =   9.476740e-01

Energy  Fluence     90% Error
[keV]   [erg/cm2]   [erg/cm2]
15- 25  4.576e-07   7.050e-08
25- 50  9.577e-07   1.073e-07
50-150  2.225e-06   4.500e-07
15-150  3.641e-06   6.363e-07
Peak spectrum fit
Power-law model

Time interval is from    8.240 sec. to    9.240 sec.

Spectral model in power-law:
------------------------------------------------------------
Parameters  : value       lower 90%   higher 90%
Photon index: 1.39868     ( -0.267021   0.268493 )
Norm@50keV  : 8.39811E-03    ( -0.00135394   0.00134742 )
------------------------------------------------------------
#Fit statistic : Chi-Squared =          37.57 using 59 PHA bins.
# Reduced chi-squared =         0.6590 for     57 degrees of freedom
# Null hypothesis probability =   9.781528e-01

Photon flux (15-150 keV)    in 1 sec: 1.02243 ( -0.164235  0.164554 ) ph/cm2/s
Energy fluence (15-150 keV)             : 8.11711e-08 ( -1.43854e-08  1.46226e-08 ) ergs/cm2
Cutoff power-law model

Time interval is from    8.240 sec. to    9.240 sec.
Spectral model in the cutoff power-law:
------------------------------------------------------------
Parameters  : value       lower 90%   higher 90%
Photon index: 0.397880     ( -1.55835   1.09961 )
Epeak [keV] : 80.1257      ( -22.1659 -80.1256 )
Norm@50keV  : 2.67222E-02    ( -0.0267223   0.124731 )
------------------------------------------------------------
#Fit statistic : Chi-Squared =          35.44 using 59 PHA bins.
# Reduced chi-squared =         0.6329 for     56 degrees of freedom
# Null hypothesis probability =   9.855320e-01

Photon flux (15-150 keV)    in 1 sec: 0.980477 ( -0.172876  0.172243 ) ph/cm2/s
Energy fluence (15-150 keV)             : 7.54181e-08 ( -1.55294e-08  1.59697e-08 ) ergs/cm2
Band function
Time interval is from    8.240 sec. to    9.240 sec.

Spectral model in the Band function:
------------------------------------------------------------
Parameters  : value       lower 90%   higher 90%
alpha       : -0.397832   ( 0.805932   0.805932 )
beta        : -10.00000    ( 10   4.33893e-11 )
Epeak [keV] : 80.1116      ( -21.4999 589.104 )
Norm@50keV   : 2.67245E-02    ( -0.0041808   0.125193 )
------------------------------------------------------------
#Fit statistic : Chi-Squared =          35.44 using 59 PHA bins.
# Reduced chi-squared =         0.6444 for     55 degrees of freedom
# Null hypothesis probability =   9.813215e-01

Photon flux (15-150 keV)    in 1 sec:  (    ) ph/cm2/s
Energy fluence (15-150 keV)             : 0 ( 0  0 ) ergs/cm2
Single BB
Spectral model blackbody:
------------------------------------------------------------
Parameters  : value    Lower 90%  Upper 90%
kT [keV]    : 15.7944  (-2.63307  3.29264)
R^2/D10^2   : 0.101913  (-0.0492076   0.0900685)
(R is the radius in km and D10 is the distance to the source in units of 10 kpc)
------------------------------------------------------------
#Fit statistic : Chi-Squared =          39.02 using 59 PHA bins.
# Reduced chi-squared =         0.6846 for     57 degrees of freedom
# Null hypothesis probability =   9.669892e-01

Energy  Fluence     90% Error
[keV]   [erg/cm2]   [erg/cm2]
15- 25  5.272e-09   1.743e-09
25- 50  2.194e-08   5.675e-09
50-150  3.806e-08   1.177e-08
15-150  6.526e-08   1.651e-08
Thermal bremsstrahlung (OTTB)
Spectral model: thermal bremsstrahlung
------------------------------------------------------------
Parameters  : value         Lower 90%    Upper 90%
kT [keV]    : 199.363       (-80.426      -199.363)
Norm        : 4.22813       (-0.667397     0.667396)
------------------------------------------------------------
#Fit statistic : Chi-Squared =          37.36 using 59 PHA bins.
# Reduced chi-squared =         0.6555 for     57 degrees of freedom
# Null hypothesis probability =   9.794288e-01

Energy  Fluence     90% Error
[keV]   [erg/cm2]   [erg/cm2]
15- 25  1.053e-08   5.975e-09
25- 50  2.025e-08   1.168e-08
50-150  4.442e-08   2.522e-08
15-150  7.520e-08   4.283e-08
Double BB
Spectral model: bbodyrad<1> + bbodyrad<2>
------------------------------------------------------------
Parameters  : value         Lower 90%    Upper 90%
kT1 [keV]   : 5.45760        (-3.78593      -5.4576)
R1^2/D10^2  : 1.57107        (-1.48425      7.37925)
kT2 [keV]   : 19.4070        (-4.66236      -19.407)
R2^2/D10^2  : 4.41940E-02    (-0.044012   0.0806685)
------------------------------------------------------------
#Fit statistic : Chi-Squared =          35.29 using 59 PHA bins.
# Reduced chi-squared =         0.6417 for     55 degrees of freedom
# Null hypothesis probability =   9.821714e-01

Energy  Fluence     90% Error
[keV]   [erg/cm2]   [erg/cm2]
15- 25  8.602e-09   5.030e-09
25- 50  2.016e-08   1.039e-08
50-150  4.430e-08   2.498e-08
15-150  7.306e-08   3.927e-08
Pre-slew spectrum (Pre-slew PHA with pre-slew DRM)
Power-law model
Spectral model in power-law:
------------------------------------------------------------
Parameters  : value       lower 90%   higher 90%
Photon index: 1.47484     ( -0.133581   0.134157 )
Norm@50keV  : 1.48947E-03    ( -0.000118031   0.000117623 )
------------------------------------------------------------
#Fit statistic : Chi-Squared =          57.64 using 59 PHA bins.
# Reduced chi-squared =          1.011 for     57 degrees of freedom
# Null hypothesis probability =   4.514282e-01

Photon flux (15-150 keV)    in 117.9 sec: 0.184714 ( -0.0145396  0.0145587 ) ph/cm2/s
Energy fluence (15-150 keV)             : 1.67301e-06 ( -1.45459e-07  1.4671e-07 ) ergs/cm2
Cutoff power-law model
Spectral model in the cutoff power-law:
------------------------------------------------------------
Parameters  : value       lower 90%   higher 90%
Photon index: 0.799382     ( -0.614736   0.537511 )
Epeak [keV] : 87.3847      ( -21.6272 133.339 )
Norm@50keV  : 3.29289E-03    ( -0.00151084   0.00337093 )
------------------------------------------------------------
#Fit statistic : Chi-Squared =          52.88 using 59 PHA bins.
# Reduced chi-squared =         0.9443 for     56 degrees of freedom
# Null hypothesis probability =   5.936951e-01

Photon flux (15-150 keV)    in 117.9 sec: 0.178949 ( -0.015237  0.015235 ) ph/cm2/s
Energy fluence (15-150 keV)             : 1.5816e-06 ( -1.62065e-07  1.63645e-07 ) ergs/cm2
Band function

Spectral model in the Band function:
------------------------------------------------------------
Parameters  : value       lower 90%   higher 90%
alpha       : -0.799350   ( -0.337501   0.585557 )
beta        : -10.0000    ( 10   20 )
Epeak [keV] : 87.3692      ( -17.1087 133.152 )
Norm@50keV   : 3.29287E-03    ( -0.00151262   0.00337343 )
------------------------------------------------------------
#Fit statistic : Chi-Squared =          52.88 using 59 PHA bins.
# Reduced chi-squared =         0.9615 for     55 degrees of freedom
# Null hypothesis probability =   5.560278e-01

Photon flux (15-150 keV)    in 117.9 sec: 0.179546 (    ) ph/cm2/s
Energy fluence (15-150 keV)             : 1.61683e-06 ( -1.61601e-06  -1.52975e-07 ) ergs/cm2
S(25-50 keV) vs. S(50-100 keV) plot
S(25-50 keV)  = 9.10e-07
S(50-100 keV) = 1.27e-06
T90 vs. Hardness ratio plot
T90                                   = 148.212000012398 sec.
Hardness ratio (energy fluence ratio) = 1.3956
Color vs. Color plot
Count Ratio  (25-50 keV) / (15-25 keV) = 1.40354
Count Ratio (50-100 keV) / (15-25 keV) = 0.980203
Mask shadow pattern

IMX = -1.686745831372712E-01, IMY = 4.639067118422541E-01
TIME vs. PHA plot around the trigger time
Blue+Cyan dotted lines: Time interval of the scaled map
From 0.000000 to 1.024000
TIME vs. DetID plot around the trigger time
Blue+Cyan dotted lines: Time interval of the scaled map
From 0.000000 to 1.024000
100 us light curve (15-350 keV)
Blue+Cyan dotted lines: Time interval of the scaled map
From 0.000000 to 1.024000
Spacecraft aspect plot

Bright source in the pre-burst/pre-slew/post-slew images
Pre-burst image of 15-350 keV band
Time interval of the image:
-239.424000 -104.996000

# RAcent  DECcent POSerr Theta    Phi  PeakCts   SNR AngSep     Name
#  [deg]    [deg]    ['] [deg]  [deg]                   [']
255.9916 -37.8294    1.0  37.0  -20.8   1.8181  11.6    0.9	4U 1700-377
256.3341 -36.6013    8.0  37.9  -19.3   0.2279   1.4   11.8	GX 349+2
263.0254 -24.7936   12.0  45.7   -3.3   0.2090   1.0    3.0	GX 1+4
264.9367 -44.4435    7.1  27.7  -17.4  -0.2094  -1.6    8.3	4U 1735-44
270.1537 -25.0911    4.5  42.9    5.1   0.5150   2.6    7.1	GX 5-1
270.2622 -25.6393    4.1  42.4    4.9   0.5521   2.8    6.6	GRS 1758-258
274.0024 -13.8779    5.7  52.5   14.5   1.0598   2.1    9.5	GX 17+2
275.8684 -30.3305    5.4  36.3    9.7   0.3590   2.1    3.7	H1820-303
285.0354 -24.8154    4.1  39.3   24.9   0.5925   2.8    6.3	HT1900.1-2455
263.0750 -33.7885    2.7  37.5   -9.2   0.6293   4.2    5.1	GX 354-0
297.6307 -48.9958    3.3  13.7   37.9   0.4331   3.5 ------	UNKNOWN
 46.6900 -48.4586    3.2  54.2  177.0   1.6905   3.5 ------	UNKNOWN
 51.2745 -47.1396    3.4  57.0  179.3   3.0214   3.4 ------	UNKNOWN
Pre-slew background subtracted image of 15-350 keV band
Time interval of the image:
-104.996000 12.876590

# RAcent  DECcent POSerr Theta    Phi  PeakCts   SNR AngSep     Name
#  [deg]    [deg]    ['] [deg]  [deg]                   [']
256.0729 -37.7652    5.2  37.0  -20.6  -0.4176  -2.2    6.3	4U 1700-377
256.4493 -36.2660   14.8  38.1  -18.9   0.1487   0.8    9.4	GX 349+2
263.0625 -24.5655    0.0  45.9   -3.1   0.2564   1.0   11.2	GX 1+4
264.8774 -44.4134    5.1  27.8  -17.5   0.3356   2.3    6.2	4U 1735-44
270.1596 -25.1014    7.8  42.9    5.1  -0.3478  -1.5    6.9	GX 5-1
270.4175 -25.8296    3.8  42.2    5.0   0.6977   3.0    8.1	GRS 1758-258
273.9000 -13.9574    2.7  52.4   14.3  -2.4471  -4.3    7.8	GX 17+2
275.8411 -30.4818   11.5  36.1    9.6  -0.2018  -1.0    8.1	H1820-303
284.8832 -24.9516   10.7  39.2   24.7  -0.2693  -1.1    8.5	HT1900.1-2455
262.9046 -34.0209    0.0  37.4   -9.6   0.5665   3.3   11.9	GX 354-0
277.7664 -11.7825    2.9  53.6   19.6   2.9837   4.0 ------	UNKNOWN
259.3095 -21.8655    2.0  49.7   -5.9   1.8148   5.9 ------	UNKNOWN
 53.3580 -56.6816    2.5  49.6 -172.9   1.3408   4.6 ------	UNKNOWN
261.8082 -47.7604    2.7  26.5  -25.7   0.5982   4.4 ------	UNKNOWN
228.0627 -80.5389    0.8  26.3 -110.0   2.5726  15.1 ------	UNKNOWN
Post-slew image of 15-350 keV band
Time interval of the image:
60.476600 962.575500

# RAcent  DECcent POSerr Theta    Phi  PeakCts   SNR AngSep     Name
#  [deg]    [deg]    ['] [deg]  [deg]                   [']
170.5644 -60.4682    8.7  25.6 -102.1   0.8453   1.3   11.8	Cen X-3
186.8446 -62.7637    2.7  21.0  -85.3   2.4737   4.2    5.2	GX 301-2
256.0026 -37.8379    1.2  43.9    4.4   7.2485   9.7    0.8	4U 1700-377
256.3435 -36.2691    9.7  45.5    4.5   1.0038   1.2   10.3	GX 349+2
264.6618 -44.3051   10.3  38.4   15.5  -0.6801  -1.1    9.4	4U 1735-44
263.0481 -33.7964    3.3  48.6   11.6   3.7430   3.5    3.7	GX 354-0
280.6092 -43.8186    2.5  40.9   33.1   3.7896   4.6 ------	UNKNOWN
 55.2708 -50.0262    3.3  49.4  158.2   5.2818   3.5 ------	UNKNOWN
255.2687 -41.6151    2.3  40.1    4.2   3.2594   5.0 ------	UNKNOWN
 83.5260 -66.3066    3.2  31.9  178.3   1.9076   3.6 ------	UNKNOWN
242.5725 -59.3413    3.7  21.6   -7.5   1.4339   3.1 ------	UNKNOWN
 86.3185 -40.5112    4.3  57.2 -173.8   7.4876   2.7 ------	UNKNOWN
114.8976 -63.6684    2.4  31.2 -156.0   2.3621   4.8 ------	UNKNOWN
116.3273 -46.9125    3.0  47.3 -148.1   4.2273   3.9 ------	UNKNOWN
232.4010 -21.7986    3.8  58.7  -23.2  10.1610   3.1 ------	UNKNOWN
Plot creation:
Sun May 31 06:31:12 EDT 2015