Special notes of this burst
Image
Pre-slew 15.0-350.0 keV image (Event data)
#   RAcent    DECcent   POSerr    Theta     Phi              Peak Cts       SNR   Name
   65.7457   -25.1297   0.0109    46.3273  -168.2143         0.8454300     17.521 TRIG_00324561

Foreground time interval of the image:
 -3.772   4.556 (delta_t =   8.328 [sec])
Background time interval of the image:
-565.115 -462.112 (delta_t = 103.004 [sec])
-239.216  -3.772 (delta_t = 235.444 [sec])
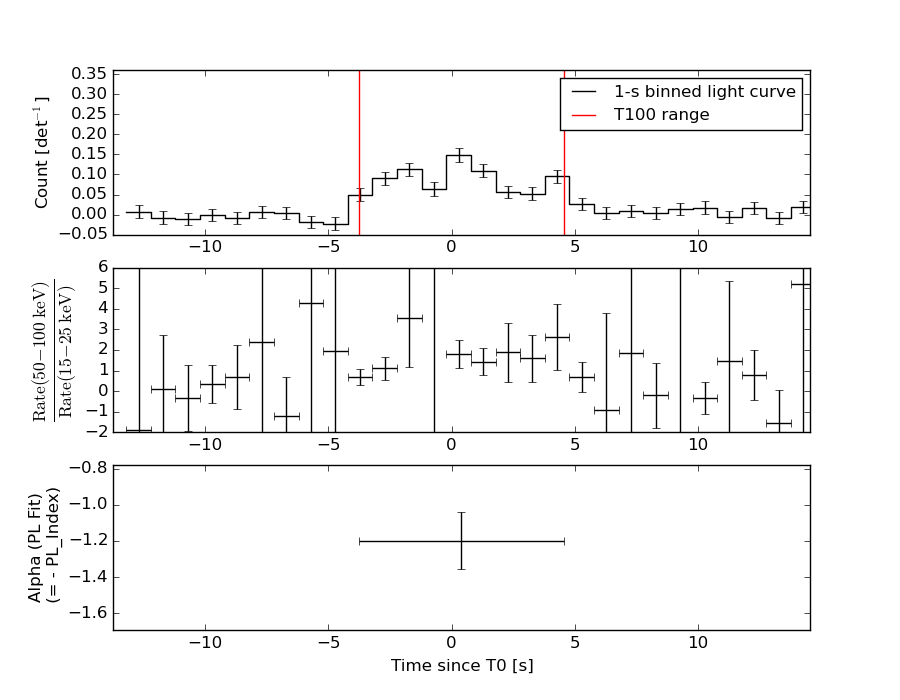
Lightcurves
Notes:
- 1) The mask-weighted light curves are using the flight position.
- 2) Multiple plots of different time binning/intervals are shown to cover all scenarios of short/long GRBs, rate/image triggers, and real/false positives.
- 3) For all the mask-weighted lightcurves, the y-axis units are counts/sec/det where a det is 0.4 x 0.4 = 0.16 sq cm.
- 4) The verticle lines correspond to following: green dotted lines are T50 interval, black dotted lines are T90 interval, blue solid line(s) is a spacecraft slew start time, and orange solid line(s) is a spacecraft slew end time.
- 5) Time of each bin is in the middle of the bin.
1 s binning
From T0-310 s to T0+310 s
From T100_start - 20 s to T100_end + 30 s
Full time interval
64 ms binning
Full time interval
From T100_start to T100_end
From T0-5 sec to T0+5 sec

16 ms binning
From T100_start-5 s to T100_start+5 s
Blue+Cyan dotted lines: Time interval of the scaled map
From 0.000000 to 1.024000
8 ms binning
From T100_start-3 s to T100_start+3 s
Blue+Cyan dotted lines: Time interval of the scaled map
From 0.000000 to 1.024000
2 ms binning
From T100_start-1 s to T100_start+1 s

Blue+Cyan dotted lines: Time interval of the scaled map
From 0.000000 to 1.024000
SN=5 or 10 sec. binning (whichever binning is satisfied first)
SN=5 or 10 sec. binning (T < 200 sec)

Quad-rate summed light curves (from T0-300s to T0+1000s)

Spectral Evolution
Spectra
Notes:
- 1) The fitting includes the systematic errors.
- 2) When the burst includes telescope slew time periods, the fitting uses an average response file made from multiple 5-s response files through out the slew time plus single time preiod for the non-slew times, and weighted by the total counts in the corresponding time period using addrmf. An average response file is needed becuase a spectral fit using the pre-slew DRM will introduce some errors in both a spectral shape and a normalization if the PHA file contains a lot of the slew/post-slew time interval.
- 3) For fits to more complicated models (e.g. a power-law over a cutoff power-law), the BAT team has decided to require a chi-square improvement of more than 6 for each extra dof.
Time averaged spectrum fit using the average DRM
Power-law model

Time interval is from   -3.772 sec. to    4.556 sec.

Spectral model in power-law:
------------------------------------------------------------
Parameters  : value       lower 90%   higher 90%
Photon index: 1.19984     ( -0.158489   0.154994 )
Norm@50keV  : 6.76545E-03    ( -0.000649458   0.00064835 )
------------------------------------------------------------
#Fit statistic : Chi-Squared =          44.42 using 59 PHA bins.
# Reduced chi-squared =         0.7792 for     57 degrees of freedom
# Null hypothesis probability =   8.877936e-01

Photon flux (15-150 keV)    in 8.328 sec: 0.794105 ( -0.0802969  0.0806428 ) ph/cm2/s
Energy fluence (15-150 keV)             : 5.71645e-07 ( -5.69197e-08  5.70819e-08 ) ergs/cm2
Cutoff power-law model

Time interval is from   -3.772 sec. to    4.556 sec.
Spectral model in the cutoff power-law:
------------------------------------------------------------
Parameters  : value       lower 90%   higher 90%
Photon index: 0.389324     ( -0.761367   0.646023 )
Epeak [keV] : 111.497      ( -29.9306 192.973 )
Norm@50keV  : 1.58720E-02    ( -0.00769145   0.018291 )
------------------------------------------------------------
#Fit statistic : Chi-Squared =          39.66 using 59 PHA bins.
# Reduced chi-squared =         0.7083 for     56 degrees of freedom
# Null hypothesis probability =   9.516805e-01

Photon flux (15-150 keV)    in 8.328 sec: 0.770934 ( -0.082175  0.08257 ) ph/cm2/s
Energy fluence (15-150 keV)             : 5.53821e-07 ( -6.04238e-08  5.99708e-08 ) ergs/cm2
Band function
Time interval is from   -3.772 sec. to    4.556 sec.

Spectral model in the Band function:
------------------------------------------------------------
Parameters  : value       lower 90%   higher 90%
alpha       : -0.415914   ( -0.653014   0.56855 )
beta        : -9.36665    ( 9.37141   19.3714 )
Epeak [keV] : 114.162      ( -21.2399 161.123 )
Norm@50keV   : 1.53602E-02    ( -0.00638861   0.00918787 )
------------------------------------------------------------
#Fit statistic : Chi-Squared =          39.67 using 59 PHA bins.
# Reduced chi-squared =         0.7213 for     55 degrees of freedom
# Null hypothesis probability =   9.405878e-01

Photon flux (15-150 keV)    in 8.328 sec: 0.771851 (    ) ph/cm2/s
Energy fluence (15-150 keV)             : 0 ( 0  0 ) ergs/cm2
Single BB
Spectral model blackbody:
------------------------------------------------------------
Parameters  : value    Lower 90%  Upper 90%
kT [keV]    : 19.3801  (-2.17257  2.54345)
R^2/D10^2   : 4.16576E-02  (-0.0142091   0.020735)
(R is the radius in km and D10 is the distance to the source in units of 10 kpc)
------------------------------------------------------------
#Fit statistic : Chi-Squared =          52.26 using 59 PHA bins.
# Reduced chi-squared =         0.9168 for     57 degrees of freedom
# Null hypothesis probability =   6.531840e-01

Energy  Fluence     90% Error
[keV]   [erg/cm2]   [erg/cm2]
15- 25  2.543e-08   4.830e-09
25- 50  1.240e-07   1.803e-08
50-150  3.435e-07   5.347e-08
15-150  4.929e-07   6.471e-08
Thermal bremsstrahlung (OTTB)
Spectral model: thermal bremsstrahlung
------------------------------------------------------------
Parameters  : value         Lower 90%    Upper 90%
kT [keV]    : 200.000       (      )
Norm        : 3.38239       (-0.327942     0.327885)
------------------------------------------------------------
#Fit statistic : Chi-Squared =          56.49 using 59 PHA bins.
# Reduced chi-squared =         0.9910 for     57 degrees of freedom
# Null hypothesis probability =   4.943331e-01

Energy  Fluence     90% Error
[keV]   [erg/cm2]   [erg/cm2]
15- 25  7.013e-08   1.000e-08
25- 50  1.349e-07   3.295e-08
50-150  2.959e-07   1.399e-07
15-150  5.009e-07   2.090e-07
Double BB

Spectral model: bbodyrad<1> + bbodyrad<2>
------------------------------------------------------------
Parameters  : value         Lower 90%    Upper 90%
kT1 [keV]   : 10.0773        (-3.18445      3.94847)
R1^2/D10^2  : 0.205385        (-0.119107      0.395444)
kT2 [keV]   : 32.8336        (-9.16557      41.8821)
R2^2/D10^2  : 5.37998E-03    (-0.00495835   0.0129227)
------------------------------------------------------------
#Fit statistic : Chi-Squared =          37.73 using 59 PHA bins.
# Reduced chi-squared =         0.6860 for     55 degrees of freedom
# Null hypothesis probability =   9.636211e-01

Energy  Fluence     90% Error
[keV]   [erg/cm2]   [erg/cm2]
15- 25  4.260e-08   2.408e-08
25- 50  1.347e-07   6.904e-08
50-150  3.810e-07   2.031e-07
15-150  5.583e-07   2.863e-07
Peak spectrum fit
Power-law model
Time interval is from    0.128 sec. to    1.128 sec.

Spectral model in power-law:
------------------------------------------------------------
Parameters  : value       lower 90%   higher 90%
Photon index: 1.37457     ( -0.270598   0.270019 )
Norm@50keV  : 1.12900E-02    ( -0.00194072   0.00193918 )
------------------------------------------------------------
#Fit statistic : Chi-Squared =          65.12 using 59 PHA bins.
# Reduced chi-squared =          1.142 for     57 degrees of freedom
# Null hypothesis probability =   2.151694e-01

Photon flux (15-150 keV)    in 1 sec: 1.36719 ( -0.241573  0.242552 ) ph/cm2/s
Energy fluence (15-150 keV)             : 1.09672e-07 ( -2.01917e-08  2.0383e-08 ) ergs/cm2
Cutoff power-law model

Time interval is from    0.128 sec. to    1.128 sec.
Spectral model in the cutoff power-law:
------------------------------------------------------------
Parameters  : value       lower 90%   higher 90%
Photon index: 0.123449     ( -1.60739   1.15727 )
Epeak [keV] : 76.9189      ( -21.3064 233.868 )
Norm@50keV  : 4.70381E-02    ( -0.0470388   0.24063 )
------------------------------------------------------------
#Fit statistic : Chi-Squared =          61.64 using 59 PHA bins.
# Reduced chi-squared =          1.101 for     56 degrees of freedom
# Null hypothesis probability =   2.814323e-01

Photon flux (15-150 keV)    in 1 sec: 1.31635 ( -0.24574  0.24702 ) ph/cm2/s
Energy fluence (15-150 keV)             : 1.02687e-07 ( -2.18689e-08  2.1963e-08 ) ergs/cm2
Band function
Time interval is from    0.128 sec. to    1.128 sec.

Spectral model in the Band function:
------------------------------------------------------------
Parameters  : value       lower 90%   higher 90%
alpha       : 4.18874   ( -1.1249   1.0166 )
beta        : -1.72326    ( 9.02834   19.0283 )
Epeak [keV] : 35.1325      ( -19.7964 167.198 )
Norm@50keV   : 49.3968    ( -49.5342   32.7189 )
------------------------------------------------------------
#Fit statistic : Chi-Squared =          60.17 using 59 PHA bins.
# Reduced chi-squared =          1.094 for     55 degrees of freedom
# Null hypothesis probability =   2.942082e-01

Photon flux (15-150 keV)    in 1 sec: 1.33112 ( 5.66888  -0.24243 ) ph/cm2/s
Energy fluence (15-150 keV)             : 1.05862e-07 ( -1.05855e-07  -2.04805e-08 ) ergs/cm2
Single BB
Spectral model blackbody:
------------------------------------------------------------
Parameters  : value    Lower 90%  Upper 90%
kT [keV]    : 16.0242  (-2.91109  3.66554)
R^2/D10^2   : 0.133663  (-0.0686322   0.13417)
(R is the radius in km and D10 is the distance to the source in units of 10 kpc)
------------------------------------------------------------
#Fit statistic : Chi-Squared =          64.52 using 59 PHA bins.
# Reduced chi-squared =          1.132 for     57 degrees of freedom
# Null hypothesis probability =   2.304633e-01

Energy  Fluence     90% Error
[keV]   [erg/cm2]   [erg/cm2]
15- 25  7.094e-09   2.739e-09
25- 50  2.989e-08   9.100e-09
50-150  5.368e-08   1.901e-08
15-150  9.066e-08   2.400e-08
Thermal bremsstrahlung (OTTB)
Spectral model: thermal bremsstrahlung
------------------------------------------------------------
Parameters  : value         Lower 90%    Upper 90%
kT [keV]    : 199.363       (-77.7999      -199.363)
Norm        : 5.73581       (-0.98128     0.98131)
------------------------------------------------------------
#Fit statistic : Chi-Squared =          64.80 using 59 PHA bins.
# Reduced chi-squared =          1.137 for     57 degrees of freedom
# Null hypothesis probability =   2.231291e-01

Energy  Fluence     90% Error
[keV]   [erg/cm2]   [erg/cm2]
15- 25  1.428e-08   8.320e-09
25- 50  2.747e-08   1.595e-08
50-150  6.026e-08   3.401e-08
15-150  1.020e-07   5.720e-08
Double BB

Spectral model: bbodyrad<1> + bbodyrad<2>
------------------------------------------------------------
Parameters  : value         Lower 90%    Upper 90%
kT1 [keV]   : 9.84103        (-5.42807      6.32465)
R1^2/D10^2  : 0.436770        (-0.35076      3.22647)
kT2 [keV]   : 28.3807        (-23.9685      -28.3807)
R2^2/D10^2  : 1.19388E-02    (-0.0119191   0.111852)
------------------------------------------------------------
#Fit statistic : Chi-Squared =          60.82 using 59 PHA bins.
# Reduced chi-squared =          1.106 for     55 degrees of freedom
# Null hypothesis probability =   2.743547e-01

Energy  Fluence     90% Error
[keV]   [erg/cm2]   [erg/cm2]
15- 25  1.012e-08   6.230e-09
25- 50  3.019e-08   1.770e-08
50-150  6.475e-08   3.452e-08
15-150  1.051e-07   5.225e-08
Pre-slew spectrum (Pre-slew PHA with pre-slew DRM)
Power-law model

Spectral model in power-law:
------------------------------------------------------------
Parameters  : value       lower 90%   higher 90%
Photon index: 1.19984     ( -0.158489   0.154994 )
Norm@50keV  : 6.76545E-03    ( -0.000649458   0.00064835 )
------------------------------------------------------------
#Fit statistic : Chi-Squared =          44.42 using 59 PHA bins.
# Reduced chi-squared =         0.7792 for     57 degrees of freedom
# Null hypothesis probability =   8.877936e-01

Photon flux (15-150 keV)    in 8.328 sec: 0.794105 ( -0.0802969  0.0806428 ) ph/cm2/s
Energy fluence (15-150 keV)             : 5.71645e-07 ( -5.69197e-08  5.70819e-08 ) ergs/cm2
Cutoff power-law model

Spectral model in the cutoff power-law:
------------------------------------------------------------
Parameters  : value       lower 90%   higher 90%
Photon index: 0.389324     ( -0.761367   0.646023 )
Epeak [keV] : 111.497      ( -29.9306 192.973 )
Norm@50keV  : 1.58720E-02    ( -0.00769145   0.018291 )
------------------------------------------------------------
#Fit statistic : Chi-Squared =          39.66 using 59 PHA bins.
# Reduced chi-squared =         0.7083 for     56 degrees of freedom
# Null hypothesis probability =   9.516805e-01

Photon flux (15-150 keV)    in 8.328 sec: 0.770934 ( -0.082175  0.08257 ) ph/cm2/s
Energy fluence (15-150 keV)             : 5.53821e-07 ( -6.04238e-08  5.99708e-08 ) ergs/cm2
Band function

Spectral model in the Band function:
------------------------------------------------------------
Parameters  : value       lower 90%   higher 90%
alpha       : -0.415914   ( -0.653014   0.568552 )
beta        : -9.36665    ( 9.37141   19.3714 )
Epeak [keV] : 114.162      ( -21.2399 161.123 )
Norm@50keV   : 1.53602E-02    ( -0.00638923   0.00918792 )
------------------------------------------------------------
#Fit statistic : Chi-Squared =          39.67 using 59 PHA bins.
# Reduced chi-squared =         0.7213 for     55 degrees of freedom
# Null hypothesis probability =   9.405878e-01

Photon flux (15-150 keV)    in 8.328 sec: 0.771851 (    ) ph/cm2/s
Energy fluence (15-150 keV)             : 0 ( 0  0 ) ergs/cm2
S(25-50 keV) vs. S(50-100 keV) plot

S(25-50 keV)  = 1.20e-07
S(50-100 keV) = 2.09e-07
T90 vs. Hardness ratio plot

T90                                   = 7.45600003004074 sec.
Hardness ratio (energy fluence ratio) = 1.74167
Color vs. Color plot
Count Ratio  (25-50 keV) / (15-25 keV) = 2.13288
Count Ratio (50-100 keV) / (15-25 keV) = 2.06739
Mask shadow pattern
IMX = -1.025355958080295E+00, IMY = 2.139408541184475E-01
TIME vs. PHA plot around the trigger time
Blue+Cyan dotted lines: Time interval of the scaled map
From 0.000000 to 1.024000
TIME vs. DetID plot around the trigger time

Blue+Cyan dotted lines: Time interval of the scaled map
From 0.000000 to 1.024000
100 us light curve (15-350 keV)
Blue+Cyan dotted lines: Time interval of the scaled map
From 0.000000 to 1.024000
Spacecraft aspect plot
Bright source in the pre-burst/pre-slew/post-slew images
Pre-burst image of 15-350 keV band
Time interval of the image:
-565.115400 -462.111800
-239.216000 -3.772000

# RAcent  DECcent POSerr Theta    Phi  PeakCts   SNR AngSep     Name
#  [deg]    [deg]    ['] [deg]  [deg]                   [']
339.3997 -30.2084    2.3  33.7   51.1   1.6931   5.0 ------	UNKNOWN
 18.5818 -34.4177    2.7  17.0  126.2   0.8709   4.3 ------	UNKNOWN
 31.6072 -48.4785    3.0  11.0 -161.8   0.7469   3.8 ------	UNKNOWN
 35.4039 -58.5806    2.2  13.7 -113.4   1.0127   5.3 ------	UNKNOWN
Pre-slew background subtracted image of 15-350 keV band
Time interval of the image:
-3.772000 4.556000

# RAcent  DECcent POSerr Theta    Phi  PeakCts   SNR AngSep     Name
#  [deg]    [deg]    ['] [deg]  [deg]                   [']
335.9712 -58.6717    1.9  23.3   -7.5   0.1556   5.9 ------	UNKNOWN
 65.7458 -25.1297    0.7  46.3 -168.2   0.8453  17.5 ------	UNKNOWN
Post-slew image of 15-350 keV band
Time interval of the image:
83.284600 962.797600

# RAcent  DECcent POSerr Theta    Phi  PeakCts   SNR AngSep     Name
#  [deg]    [deg]    ['] [deg]  [deg]                   [']
 83.6274  22.0117    0.4  50.2 -161.5  35.8122  31.2    0.4	Crab
 33.7054  -8.0103    3.1  35.0  110.4   3.4076   3.7 ------	UNKNOWN
 49.9799  19.1694    2.6  46.9  156.2   6.0380   4.4 ------	UNKNOWN
 67.3400 -60.2036    3.1  35.1   -4.7   2.2977   3.7 ------	UNKNOWN
 69.6942 -18.9640    2.8   7.2 -151.7   1.6116   4.2 ------	UNKNOWN
104.6001 -65.9932    3.6  47.6  -23.5   2.6985   3.2 ------	UNKNOWN
123.1778 -52.7653    3.3  50.7  -44.5   9.1337   3.5 ------	UNKNOWN
Plot creation:
Sun May 31 06:28:50 EDT 2015