Click here for the BAT GCN circular template
Image
Pre-slew 15.0-350.0 keV image (Event data)
#   RAcent    DECcent   POSerr    Theta     Phi              Peak Cts       SNR   Name
  336.2873   -57.0265   0.0031    18.0139   129.0832         3.4986993     61.912 TRIG_00324895

Foreground time interval of the image:
 -2.400  15.189 (delta_t =  17.589 [sec])
Background time interval of the image:
-239.712  -2.400 (delta_t = 237.312 [sec])
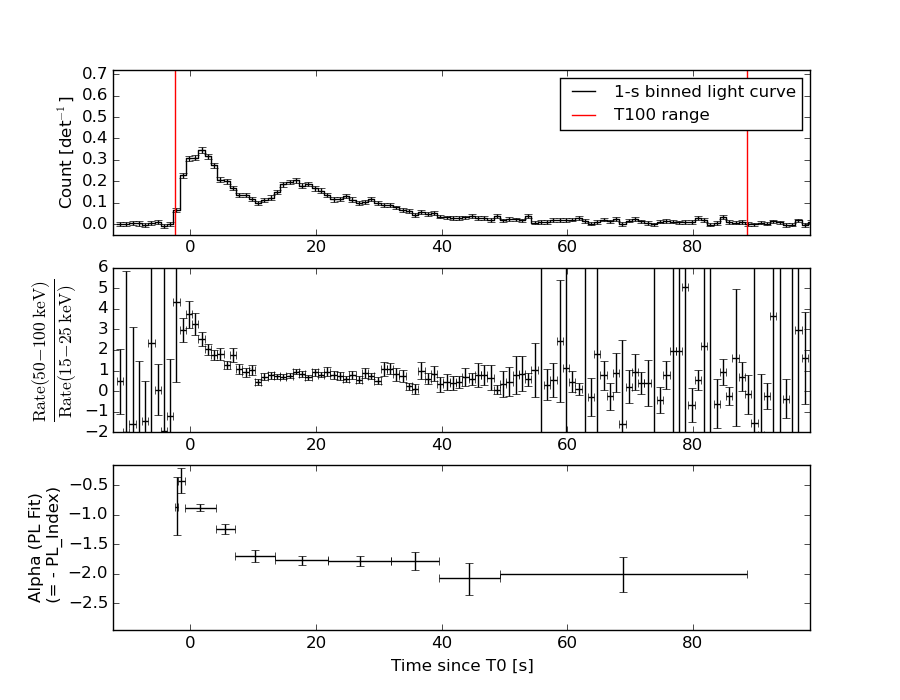
Lightcurves
Notes:
- 1) The mask-weighted light curves are using the flight position.
- 2) Multiple plots of different time binning/intervals are shown to cover all scenarios of short/long GRBs, rate/image triggers, and real/false positives.
- 3) For all the mask-weighted lightcurves, the y-axis units are counts/sec/det where a det is 0.4 x 0.4 = 0.16 sq cm.
- 4) The verticle lines correspond to following: green dotted lines are T50 interval, black dotted lines are T90 interval, blue solid line(s) is a spacecraft slew start time, and orange solid line(s) is a spacecraft slew end time.
- 5) Time of each bin is in the middle of the bin.
1 s binning
From T0-310 s to T0+310 s
From T100_start - 20 s to T100_end + 30 s
Full time interval
64 ms binning
Full time interval

From T100_start to T100_end
From T0-5 sec to T0+5 sec
16 ms binning
From T100_start-5 s to T100_start+5 s
Blue+Cyan dotted lines: Time interval of the scaled map
From 0.000000 to 1.024000
8 ms binning
From T100_start-3 s to T100_start+3 s
Blue+Cyan dotted lines: Time interval of the scaled map
From 0.000000 to 1.024000
2 ms binning
From T100_start-1 s to T100_start+1 s
Blue+Cyan dotted lines: Time interval of the scaled map
From 0.000000 to 1.024000
SN=5 or 10 sec. binning (whichever binning is satisfied first)

SN=5 or 10 sec. binning (T < 200 sec)
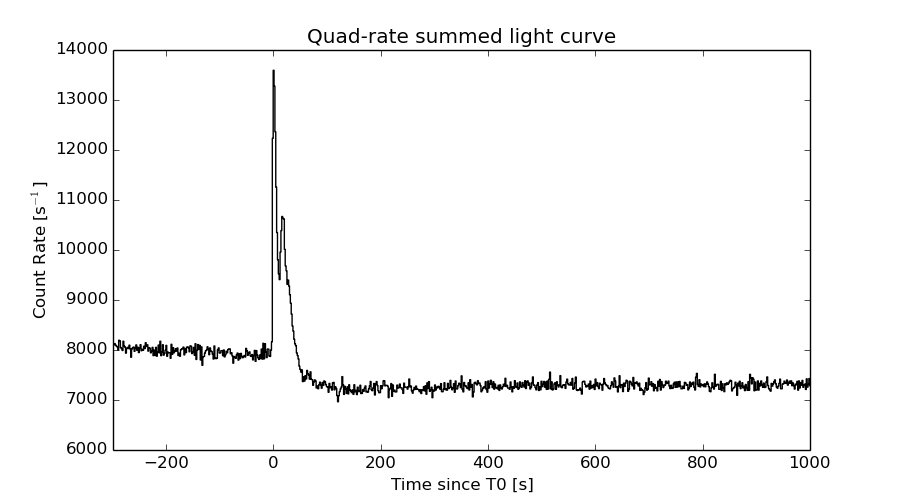
Quad-rate summed light curves (from T0-300s to T0+1000s)
Spectral Evolution
Spectra
Notes:
- 1) The fitting includes the systematic errors.
- 2) When the burst includes telescope slew time periods, the fitting uses an average response file made from multiple 5-s response files through out the slew time plus single time preiod for the non-slew times, and weighted by the total counts in the corresponding time period using addrmf. An average response file is needed becuase a spectral fit using the pre-slew DRM will introduce some errors in both a spectral shape and a normalization if the PHA file contains a lot of the slew/post-slew time interval.
- 3) For fits to more complicated models (e.g. a power-law over a cutoff power-law), the BAT team has decided to require a chi-square improvement of more than 6 for each extra dof.
Time averaged spectrum fit using the average DRM
Power-law model
Time interval is from   -2.400 sec. to   88.640 sec.

Spectral model in power-law:
------------------------------------------------------------
Parameters  : value       lower 90%   higher 90%
Photon index: 1.54645     ( -0.0464583   0.0464766 )
Norm@50keV  : 5.05471E-03    ( -0.000123388   0.000123375 )
------------------------------------------------------------
#Fit statistic : Chi-Squared =          65.29 using 59 PHA bins.
# Reduced chi-squared =          1.145 for     57 degrees of freedom
# Null hypothesis probability =   2.107742e-01

Photon flux (15-150 keV)    in 91.04 sec: 0.639241 ( -0.0172814  0.0173338 ) ph/cm2/s
Energy fluence (15-150 keV)             : 4.3344e-06 ( -1.1139e-07  1.11558e-07 ) ergs/cm2
Cutoff power-law model
Time interval is from   -2.400 sec. to   88.640 sec.
Spectral model in the cutoff power-law:
------------------------------------------------------------
Parameters  : value       lower 90%   higher 90%
Photon index: 1.18588     ( -0.196426   0.188096 )
Epeak [keV] : 120.957      ( -24.6883 70.4308 )
Norm@50keV  : 7.44362E-03    ( -0.00132807   0.00169746 )
------------------------------------------------------------
#Fit statistic : Chi-Squared =          54.18 using 59 PHA bins.
# Reduced chi-squared =         0.9676 for     56 degrees of freedom
# Null hypothesis probability =   5.439337e-01

Photon flux (15-150 keV)    in 91.04 sec: 0.621801 ( -0.019219  0.019291 ) ph/cm2/s
Energy fluence (15-150 keV)             : 4.21998e-06 ( -1.27028e-07  1.26536e-07 ) ergs/cm2
Band function
Time interval is from   -2.400 sec. to   88.640 sec.

Spectral model in the Band function:
------------------------------------------------------------
Parameters  : value       lower 90%   higher 90%
alpha       : 1.85699   ( -2.21884   -1.00796 )
beta        : -1.61995    ( 1.62204   0.0622143 )
Epeak [keV] : 31.8414      ( -6.68833 61.7822 )
Norm@50keV   : 1.14894    ( -1.14565   107.836 )
------------------------------------------------------------
#Fit statistic : Chi-Squared =          51.40 using 59 PHA bins.
# Reduced chi-squared =         0.9345 for     55 degrees of freedom
# Null hypothesis probability =   6.130620e-01

Photon flux (15-150 keV)    in 91.04 sec: 0.611192 (    ) ph/cm2/s
Energy fluence (15-150 keV)             : 0 ( 0  0 ) ergs/cm2
Single BB

Spectral model blackbody:
------------------------------------------------------------
Parameters  : value    Lower 90%  Upper 90%
kT [keV]    : 16.0512  (  )
R^2/D10^2   : 5.43848E-02  (   )
(R is the radius in km and D10 is the distance to the source in units of 10 kpc)
------------------------------------------------------------
#Fit statistic : Chi-Squared =         350.29 using 59 PHA bins.
# Reduced chi-squared =         6.1455 for     57 degrees of freedom
# Null hypothesis probability =   8.772895e-44

Energy  Fluence     90% Error
[keV]   [erg/cm2]   [erg/cm2]
15- 25  2.636e-07   1.325e-08
25- 50  1.112e-06   3.869e-08
50-150  2.005e-06   9.241e-08
15-150  3.381e-06   9.241e-08
Thermal bremsstrahlung (OTTB)
Spectral model: thermal bremsstrahlung
------------------------------------------------------------
Parameters  : value         Lower 90%    Upper 90%
kT [keV]    : 200.000       (      )
Norm        : 2.59411       (-0.0631255     0.063125)
------------------------------------------------------------
#Fit statistic : Chi-Squared =          55.69 using 59 PHA bins.
# Reduced chi-squared =         0.9769 for     57 degrees of freedom
# Null hypothesis probability =   5.245109e-01

Energy  Fluence     90% Error
[keV]   [erg/cm2]   [erg/cm2]
15- 25  5.882e-07   1.757e-08
25- 50  1.132e-06   3.095e-08
50-150  2.482e-06   6.737e-08
15-150  4.201e-06   1.202e-07
Double BB

Spectral model: bbodyrad<1> + bbodyrad<2>
------------------------------------------------------------
Parameters  : value         Lower 90%    Upper 90%
kT1 [keV]   : 7.47493        (-0.688548      0.742623)
R1^2/D10^2  : 0.504559        (-0.135263      0.199217)
kT2 [keV]   : 26.5089        (-2.25895      2.93403)
R2^2/D10^2  : 7.36208E-03    (-0.00236253   0.00294432)
------------------------------------------------------------
#Fit statistic : Chi-Squared =          52.76 using 59 PHA bins.
# Reduced chi-squared =         0.9593 for     55 degrees of freedom
# Null hypothesis probability =   5.606258e-01

Energy  Fluence     90% Error
[keV]   [erg/cm2]   [erg/cm2]
15- 25  5.184e-07   4.365e-08
25- 50  1.144e-06   5.736e-08
50-150  2.528e-06   1.611e-07
15-150  4.190e-06   2.240e-07
Peak spectrum fit
Power-law model
Time interval is from    1.252 sec. to    2.252 sec.

Spectral model in power-law:
------------------------------------------------------------
Parameters  : value       lower 90%   higher 90%
Photon index: 0.925280     ( -0.0989347   0.0972489 )
Norm@50keV  : 2.34208E-02    ( -0.00138993   0.00138708 )
------------------------------------------------------------
#Fit statistic : Chi-Squared =          55.74 using 59 PHA bins.
# Reduced chi-squared =         0.9778 for     57 degrees of freedom
# Null hypothesis probability =   5.226172e-01

Photon flux (15-150 keV)    in 1 sec: 2.68914 ( -0.16042  0.160571 ) ph/cm2/s
Energy fluence (15-150 keV)             : 2.60303e-07 ( -1.64922e-08  1.65484e-08 ) ergs/cm2
Cutoff power-law model

Time interval is from    1.252 sec. to    2.252 sec.
Spectral model in the cutoff power-law:
------------------------------------------------------------
Parameters  : value       lower 90%   higher 90%
Photon index: 0.164148     ( -0.469172   0.421979 )
Epeak [keV] : 138.254      ( -32.1711 96.6626 )
Norm@50keV  : 5.12235E-02    ( -0.0176198   0.0300768 )
------------------------------------------------------------
#Fit statistic : Chi-Squared =          45.51 using 59 PHA bins.
# Reduced chi-squared =         0.8126 for     56 degrees of freedom
# Null hypothesis probability =   8.406645e-01

Photon flux (15-150 keV)    in 1 sec: 2.62263 ( -0.16477  0.16476 ) ph/cm2/s
Energy fluence (15-150 keV)             : 2.51558e-07 ( -1.7782e-08  1.7663e-08 ) ergs/cm2
Band function

Time interval is from    1.252 sec. to    2.252 sec.

Spectral model in the Band function:
------------------------------------------------------------
Parameters  : value       lower 90%   higher 90%
alpha       : -0.895633   ( 0.895633   0.895633 )
beta        : -0.925287    ( -0.0971987   0.0990545 )
Epeak [keV] : 13.5117      (   )
Norm@50keV   : 3.49914E-02    (     )
------------------------------------------------------------
#Fit statistic : Chi-Squared =          55.74 using 59 PHA bins.
# Reduced chi-squared =          1.013 for     55 degrees of freedom
# Null hypothesis probability =   4.469567e-01

Photon flux (15-150 keV)    in 1 sec:  (    ) ph/cm2/s
Energy fluence (15-150 keV)             : 0 ( 0  0 ) ergs/cm2
Single BB
Spectral model blackbody:
------------------------------------------------------------
Parameters  : value    Lower 90%  Upper 90%
kT [keV]    : 22.2202  (-1.65842  1.85184)
R^2/D10^2   : 9.69709E-02  (-0.0214598   0.0267687)
(R is the radius in km and D10 is the distance to the source in units of 10 kpc)
------------------------------------------------------------
#Fit statistic : Chi-Squared =          69.01 using 59 PHA bins.
# Reduced chi-squared =          1.211 for     57 degrees of freedom
# Null hypothesis probability =   1.322417e-01

Energy  Fluence     90% Error
[keV]   [erg/cm2]   [erg/cm2]
15- 25  8.820e-09   1.036e-09
25- 50  4.691e-08   4.145e-09
50-150  1.731e-07   1.680e-08
15-150  2.288e-07   1.720e-08
Thermal bremsstrahlung (OTTB)
Spectral model: thermal bremsstrahlung
------------------------------------------------------------
Parameters  : value         Lower 90%    Upper 90%
kT [keV]    : 199.363       (      )
Norm        : 10.6496       (     )
------------------------------------------------------------
#Fit statistic : Chi-Squared =         157.35 using 59 PHA bins.
# Reduced chi-squared =         2.7605 for     57 degrees of freedom
# Null hypothesis probability =   2.464657e-11

Energy  Fluence     90% Error
[keV]   [erg/cm2]   [erg/cm2]
15- 25  2.652e-08   1.970e-09
25- 50  5.101e-08   4.115e-09
50-150  1.119e-07   2.449e-08
15-150  1.894e-07   2.480e-08
Double BB
Spectral model: bbodyrad<1> + bbodyrad<2>
------------------------------------------------------------
Parameters  : value         Lower 90%    Upper 90%
kT1 [keV]   : 11.4695        (-3.12014      3.73077)
R1^2/D10^2  : 0.389771        (-0.174788      0.433634)
kT2 [keV]   : 37.5847        (-9.22046      37.9612)
R2^2/D10^2  : 1.46387E-02    (-0.012533   0.0240918)
------------------------------------------------------------
#Fit statistic : Chi-Squared =          43.21 using 59 PHA bins.
# Reduced chi-squared =         0.7857 for     55 degrees of freedom
# Null hypothesis probability =   8.751218e-01

Energy  Fluence     90% Error
[keV]   [erg/cm2]   [erg/cm2]
15- 25  1.358e-08   4.711e-09
25- 50  5.082e-08   1.630e-08
50-150  1.895e-07   8.471e-08
15-150  2.539e-07   9.845e-08
Pre-slew spectrum (Pre-slew PHA with pre-slew DRM)
Power-law model
Spectral model in power-law:
------------------------------------------------------------
Parameters  : value       lower 90%   higher 90%
Photon index: 1.19552     ( -0.045559   0.0453498 )
Norm@50keV  : 1.34573E-02    ( -0.000337126   0.000336881 )
------------------------------------------------------------
#Fit statistic : Chi-Squared =          62.49 using 59 PHA bins.
# Reduced chi-squared =          1.096 for     57 degrees of freedom
# Null hypothesis probability =   2.876873e-01

Photon flux (15-150 keV)    in 17.59 sec: 1.57862 ( -0.0423304  0.0424162 ) ph/cm2/s
Energy fluence (15-150 keV)             : 2.40461e-06 ( -6.28445e-08  6.29106e-08 ) ergs/cm2
Cutoff power-law model
Spectral model in the cutoff power-law:
------------------------------------------------------------
Parameters  : value       lower 90%   higher 90%
Photon index: 0.858579     ( -0.192324   0.184204 )
Epeak [keV] : 196.522      ( -50.3734 157.673 )
Norm@50keV  : 1.88774E-02    ( -0.0031129   0.00389022 )
------------------------------------------------------------
#Fit statistic : Chi-Squared =          52.42 using 59 PHA bins.
# Reduced chi-squared =         0.9361 for     56 degrees of freedom
# Null hypothesis probability =   6.111857e-01

Photon flux (15-150 keV)    in 17.59 sec: 1.54674 ( -0.04532  0.04543 ) ph/cm2/s
Energy fluence (15-150 keV)             : 2.36443e-06 ( -6.75984e-08  6.71234e-08 ) ergs/cm2
Band function
Spectral model in the Band function:
------------------------------------------------------------
Parameters  : value       lower 90%   higher 90%
alpha       : -0.398910   ( -0.568945   3.8005 )
beta        : -1.32811    ( 1.3273   0.0992092 )
Epeak [keV] : 88.5205      ( -48.7064 168.208 )
Norm@50keV   : 3.52885E-02    ( -0.019154   12.8722 )
------------------------------------------------------------
#Fit statistic : Chi-Squared =          50.56 using 59 PHA bins.
# Reduced chi-squared =         0.9193 for     55 degrees of freedom
# Null hypothesis probability =   6.446873e-01

Photon flux (15-150 keV)    in 17.59 sec:  (    ) ph/cm2/s
Energy fluence (15-150 keV)             : 0 ( 0  0 ) ergs/cm2
S(25-50 keV) vs. S(50-100 keV) plot
S(25-50 keV)  = 1.10e-06
S(50-100 keV) = 1.50e-06
T90 vs. Hardness ratio plot
T90                                   = 61.3479999899864 sec.
Hardness ratio (energy fluence ratio) = 1.36364
Color vs. Color plot
Count Ratio  (25-50 keV) / (15-25 keV) = 1.46456
Count Ratio (50-100 keV) / (15-25 keV) = 1.04543
Mask shadow pattern
IMX = -2.050141681261123E-01, IMY = -2.524209043282010E-01
TIME vs. PHA plot around the trigger time

Blue+Cyan dotted lines: Time interval of the scaled map
From 0.000000 to 1.024000
TIME vs. DetID plot around the trigger time
Blue+Cyan dotted lines: Time interval of the scaled map
From 0.000000 to 1.024000
100 us light curve (15-350 keV)
Blue+Cyan dotted lines: Time interval of the scaled map
From 0.000000 to 1.024000
Spacecraft aspect plot
Bright source in the pre-burst/pre-slew/post-slew images
Pre-burst image of 15-350 keV band
Time interval of the image:
-239.712000 -2.400000

# RAcent  DECcent POSerr Theta    Phi  PeakCts   SNR AngSep     Name
#  [deg]    [deg]    ['] [deg]  [deg]                   [']
256.0019 -37.8310    0.6  37.0  -28.8   4.7117  19.6    1.1	4U 1700-377
256.2778 -36.4991    4.8  38.0  -27.3   0.5825   2.4    8.9	GX 349+2
263.1052 -24.5968    7.7  45.8  -11.1   0.4862   1.5   10.4	GX 1+4
264.8892 -44.5516    7.8  27.7  -25.7   0.2450   1.5    8.7	4U 1735-44
270.4477 -25.1874    0.0  42.8   -2.6  -0.0904  -0.3   11.0	GX 5-1
270.3084 -25.6717    4.7  42.3   -3.0   0.6931   2.4    4.3	GRS 1758-258
274.0624 -13.9854    5.7  52.4    6.5   1.1157   2.0    4.5	GX 17+2
275.9252 -30.3661    9.6  36.2    1.7   0.2658   1.2    0.1	H1820-303
285.0451 -24.9603    3.0  39.2   16.9   0.9483   3.8    2.4	HT1900.1-2455
263.1264 -33.7611    5.3  37.6  -17.1   0.4802   2.2    8.1	GX 354-0
  2.1619 -60.4692    2.4  27.9  154.5   1.0944   4.9 ------	UNKNOWN
248.0079 -48.8114    2.1  32.0  -48.9   1.2121   5.5 ------	UNKNOWN
222.5218 -56.5494    3.8  38.0  -77.3   1.6373   3.0 ------	UNKNOWN
203.7699 -62.3465    2.8  40.8  -94.2   3.7127   4.1 ------	UNKNOWN
Pre-slew background subtracted image of 15-350 keV band
Time interval of the image:
-2.400000 15.188600

# RAcent  DECcent POSerr Theta    Phi  PeakCts   SNR AngSep     Name
#  [deg]    [deg]    ['] [deg]  [deg]                   [']
256.1451 -37.9593    7.3  36.8  -28.7   0.1085   1.6   10.2	4U 1700-377
256.3712 -36.5224    4.3  37.9  -27.2   0.1955   2.7    6.7	GX 349+2
262.9127 -24.8985    5.6  45.6  -11.5   0.1896   2.1   10.6	GX 1+4
264.7330 -44.4445   63.1  27.8  -25.7  -0.0106  -0.2    0.5	4U 1735-44
270.1745 -25.1307   14.3  42.9   -2.9   0.0670   0.8    6.7	GX 5-1
270.2031 -25.8317    4.1  42.2   -3.3   0.2287   2.8    7.6	GRS 1758-258
274.0256 -13.9574    6.8  52.4    6.5   0.2780   1.7    4.9	GX 17+2
276.0431 -30.3905   15.6  36.2    1.9  -0.0538  -0.7    6.3	H1820-303
285.1033 -24.9245    5.3  39.2   17.0  -0.1864  -2.2    3.7	HT1900.1-2455
262.9617 -33.7693   11.9  37.6  -17.3   0.0697   1.0    4.2	GX 354-0
336.2873 -57.0265    0.2  18.0  129.1   3.4981  61.9 ------	UNKNOWN
 78.8561 -65.4449    2.4  48.2 -161.2   0.5240   4.9 ------	UNKNOWN
239.4445 -26.5998    2.0  53.9  -37.2   1.4231   6.0 ------	UNKNOWN
Post-slew image of 15-350 keV band
Time interval of the image:
54.388610 962.302100

# RAcent  DECcent POSerr Theta    Phi  PeakCts   SNR AngSep     Name
#  [deg]    [deg]    ['] [deg]  [deg]                   [']
264.6746 -44.4602    6.8  44.7  -37.5   1.1922   1.7    3.0	4U 1735-44
270.2241 -25.0690    7.0  56.2  -16.3   2.3636   1.6    3.3	GX 5-1
270.3392 -25.6962    3.1  55.7  -16.6   5.0488   3.8    3.4	GRS 1758-258
275.9172 -30.3554    3.3  49.0  -15.3   2.5665   3.5    0.8	H1820-303
284.9267 -24.8991   18.2  48.6   -2.5  -0.5008  -0.6    6.1	HT1900.1-2455
262.9822 -33.8042    6.2  53.4  -29.0   2.2642   1.9    1.9	GX 354-0
292.4287 -35.3821    2.5  36.3   -4.1   2.3374   4.6 ------	UNKNOWN
238.6785 -68.1342    3.1  41.3  -77.6   7.1500   3.8 ------	UNKNOWN
Plot creation:
Sun May 31 06:21:59 EDT 2015