Click here for the BAT GCN circular template
Image
Pre-slew 15-350 keV image (Event data; bkg subtracted)
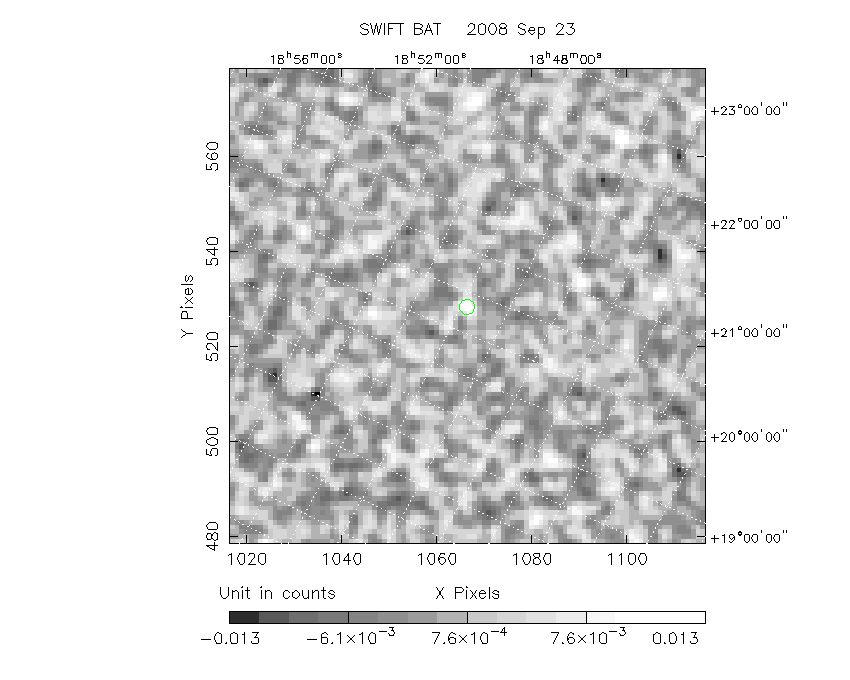
#   RAcent  DECcent POSerr  Theta    Phi     Peak Cts     SNR  Name
  288.3614 +25.8738 0.0416   22.2 -164.5       0.0155     4.6  TRIG_00325707
------------------------------------------

Foreground time interval of the image:
  0.000   0.128 (delta_t =   0.128 [sec])
Background time interval of the image:
-239.448  -8.448 (delta_t = 231.000 [sec])
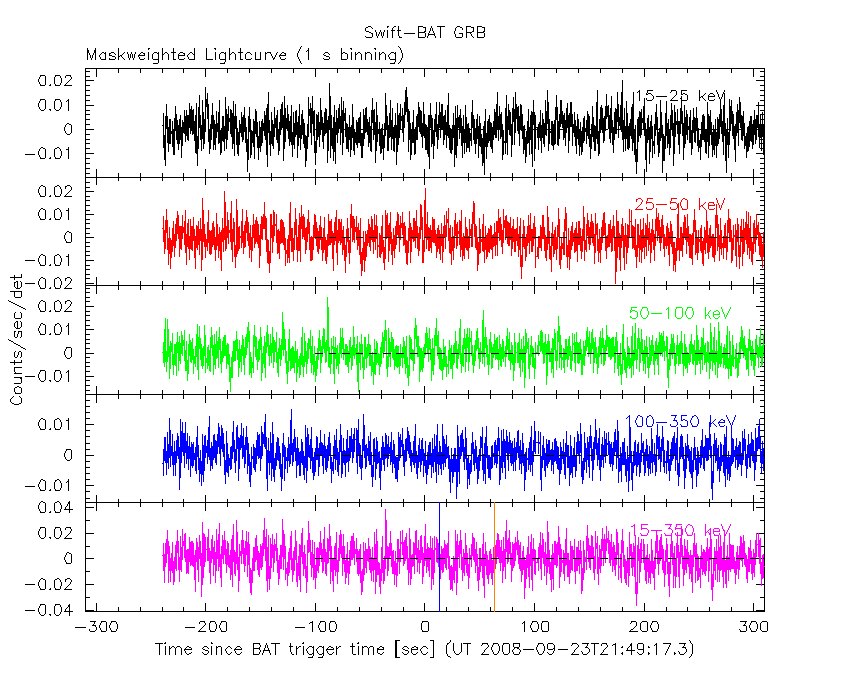
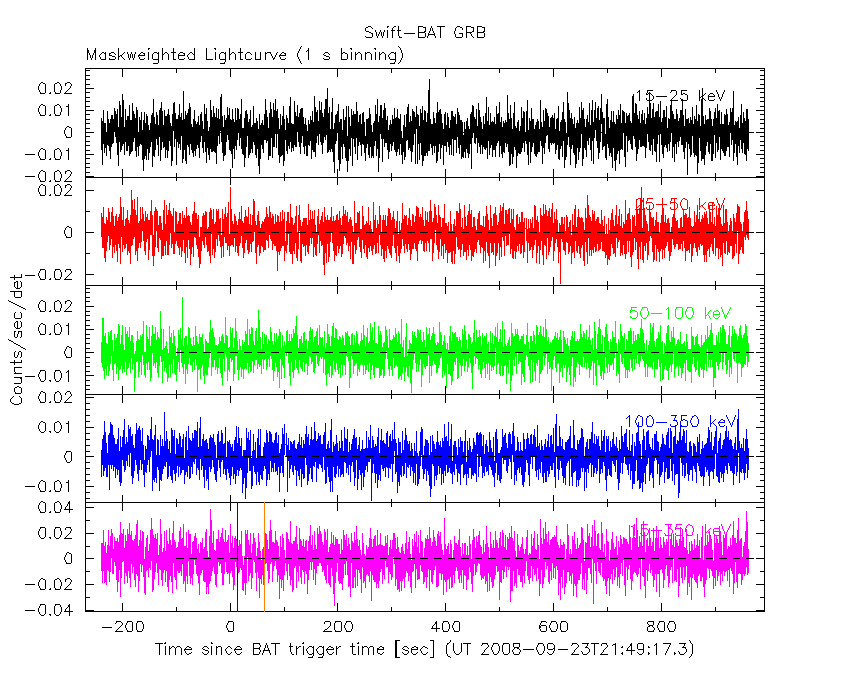
Lightcurves
Notes:
- 1) All plots contain as much data as has been downloaded to date.
- 2) Multiple plots of different time binning/intervals are shown to cover all scenarios of short/long GRBs, rate/image triggers, and real/false positives.
- 3) For all the mask-weighted lightcurves, the y-axis units are counts/sec/det where a det is 0.4 x 0.4 = 0.16 sq cm.
- 4) The verticle lines correspond to following: green dotted lines are T50 interval, black dotted lines are T90 interval, blue solid line(s) is a spacecraft slew start time, and orange solid line(s) is a spacecraft slew end time.
- 5) Time of each bin is in the middle of the bin.
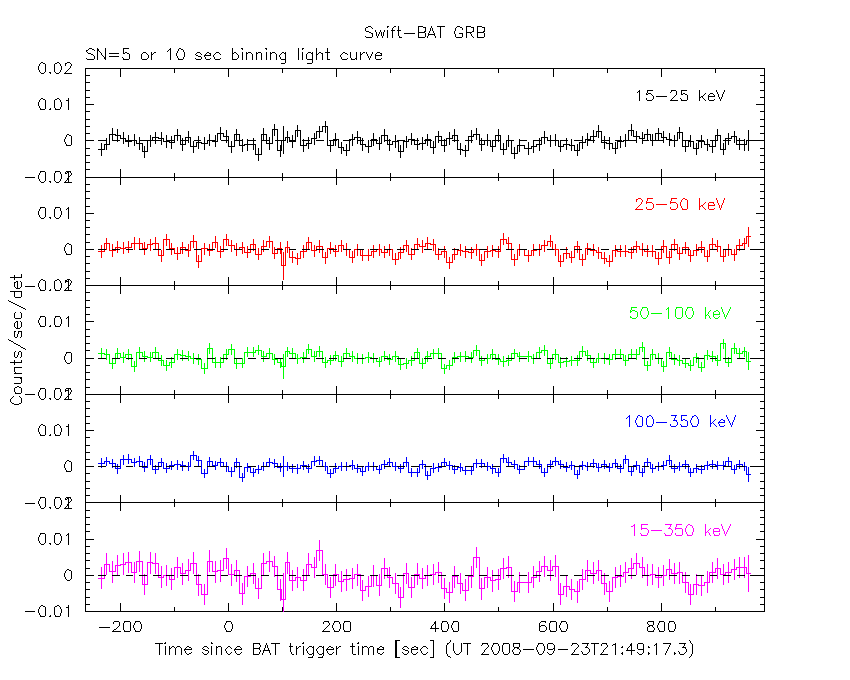
1 s binning
From T0-310 s to T0+310 s
From T100_start - 20 s to T100_end + 30 s
Full time interval
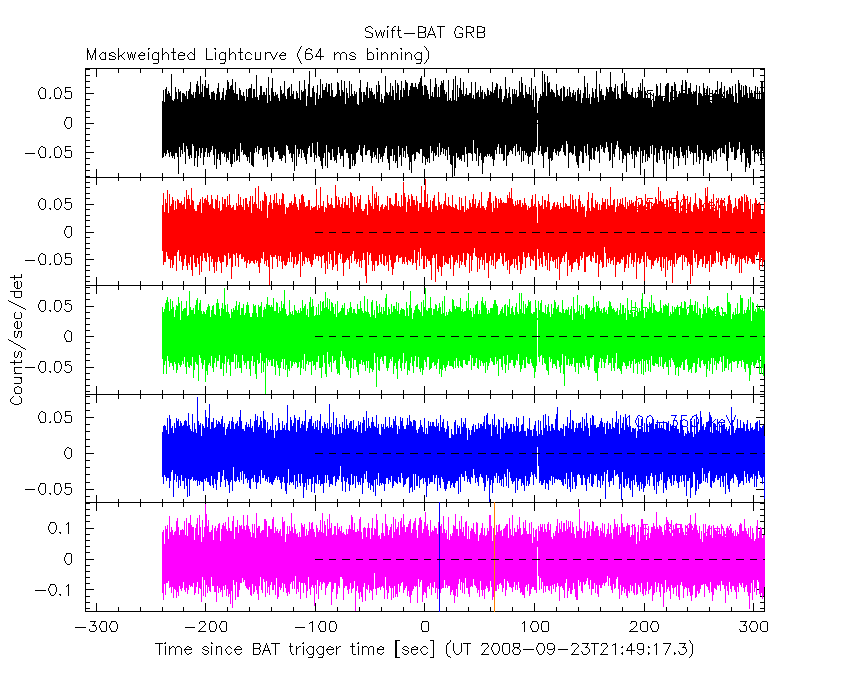
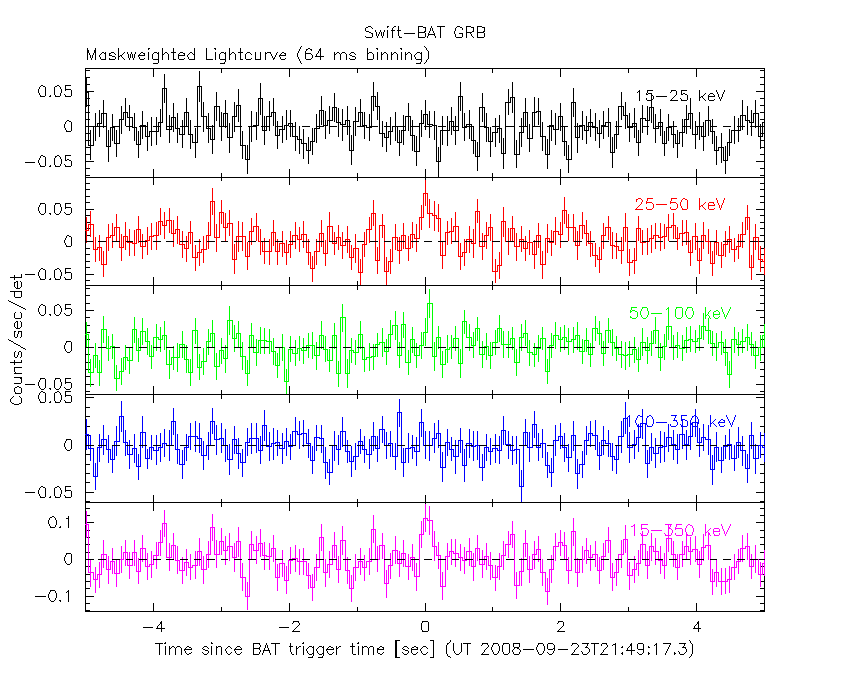
64 ms binning
Full time interval
From T100_start to T100_end

From T0-5 sec to T0+5 sec
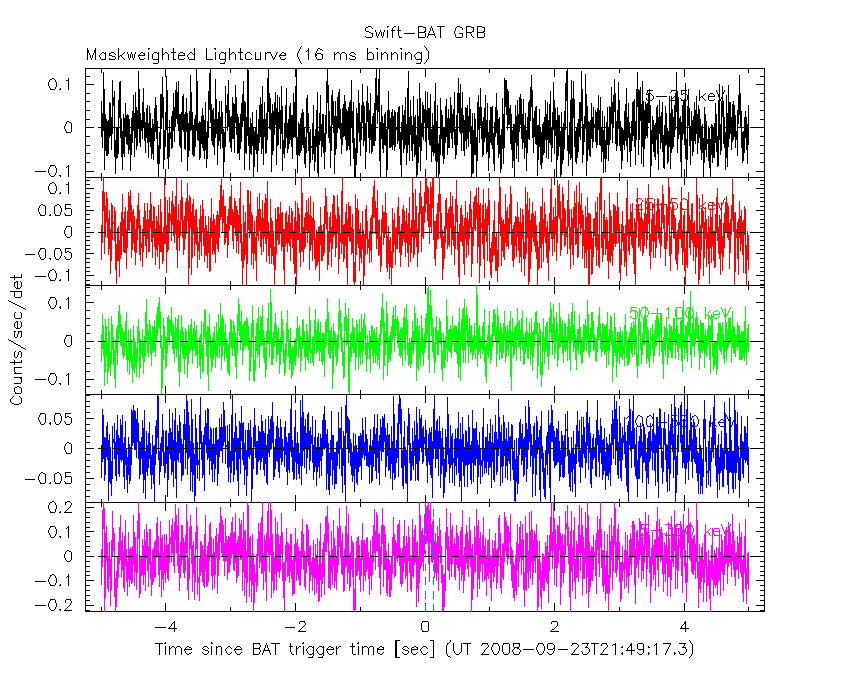
16 ms binning
From T100_start-5 s to T100_start+5 s
Blue+Cyan dotted lines: Time interval of the scaled map
From 0.000000 to 0.128000
8 ms binning
From T100_start-3 s to T100_start+3 s

Blue+Cyan dotted lines: Time interval of the scaled map
From 0.000000 to 0.128000
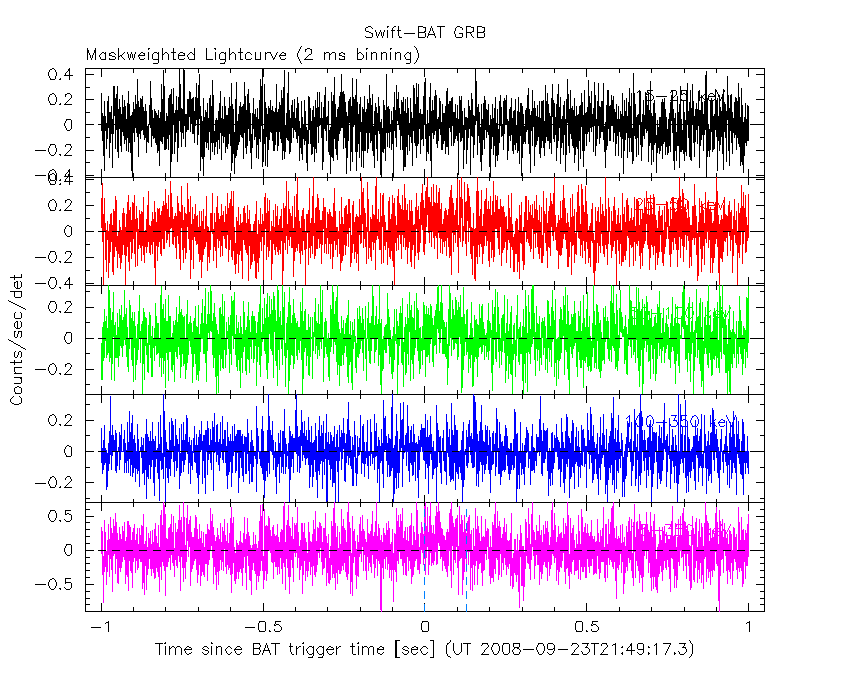
2 ms binning
From T100_start-1 s to T100_start+1 s
Blue+Cyan dotted lines: Time interval of the scaled map
From 0.000000 to 0.128000
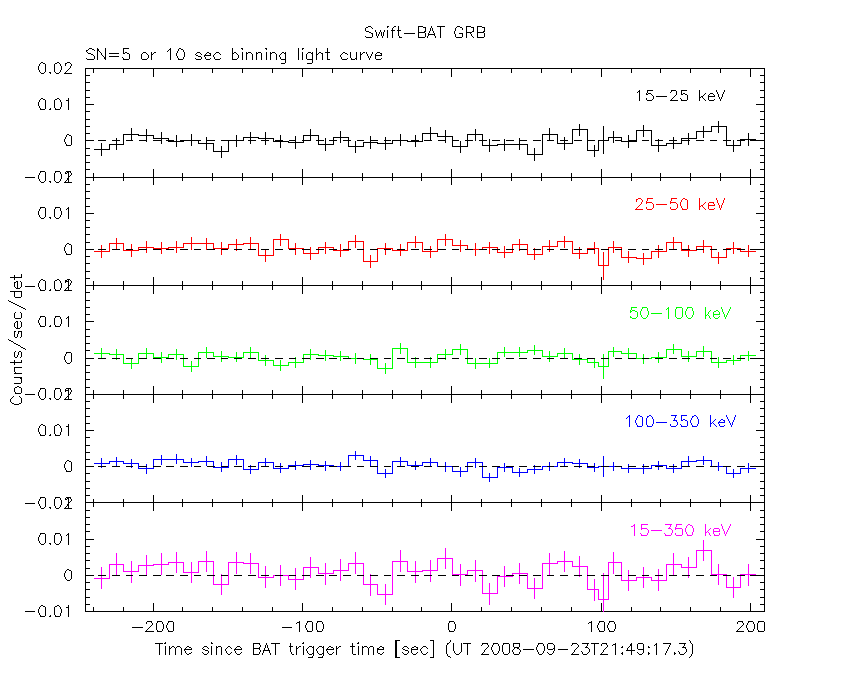
SN=5 or 10 sec. binning (whichever binning is satisfied first)
SN=5 or 10 sec. binning (T < 200 sec)
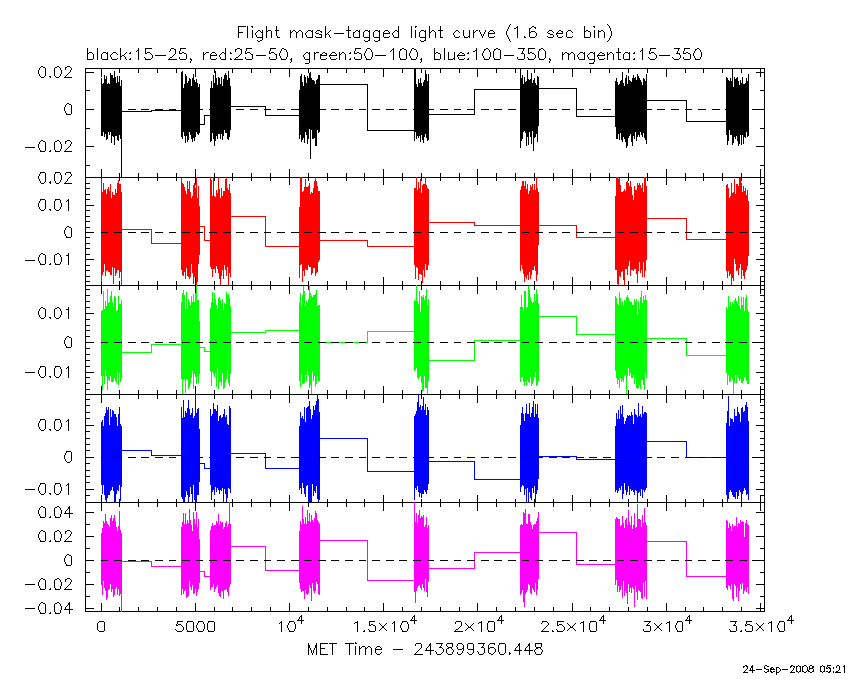
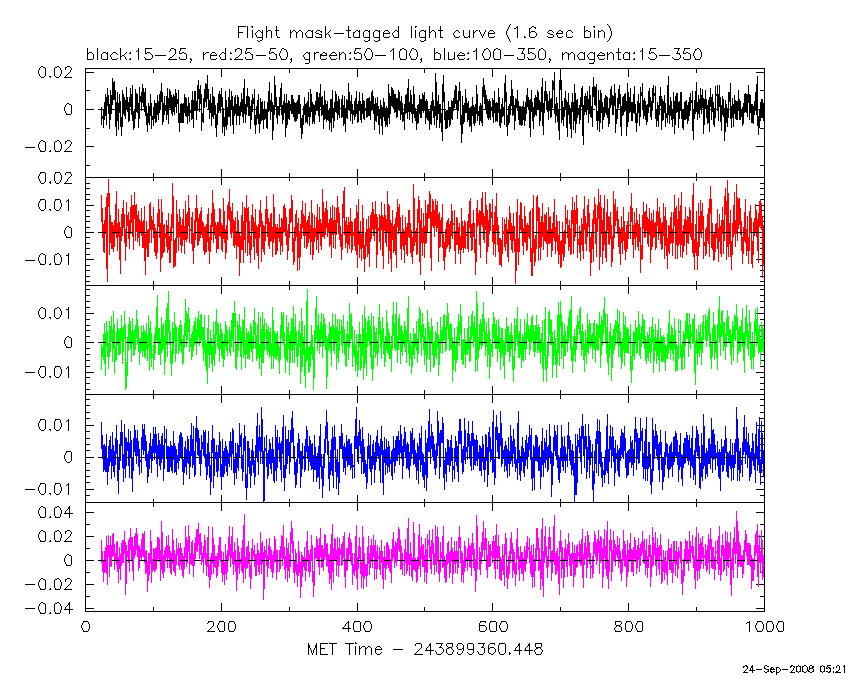
Flight mask-tagged light curves
Caution: Mask-weight map is always using the same on-axis map

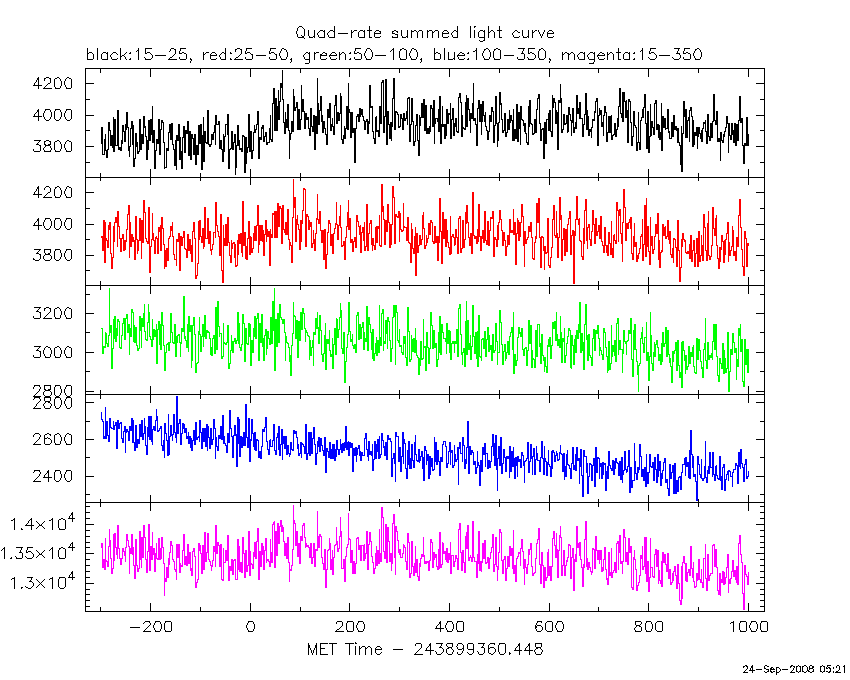
Quad-rate summed light curves (from T0-300 to T0+1000)
Spectra
Notes:
- 1) The fitting includes the systematic errors.
- 2) For long bursts, a spectral fit of the pre-slew DRM will introduce some errors in both a spectral shape and a normalization if the PHA file contains a lot of the slew/post-slew time interval.
- 3) For fits to more complicated models (e.g. a power-law over a cutoff power-law), the BAT team has decided to require a chi-square improvement of more than 6 for each extra dof.
- 4) For short bursts (T90<1sec), the specrtum is also fit with Blackbody, OTTB, and Double Blackbody.
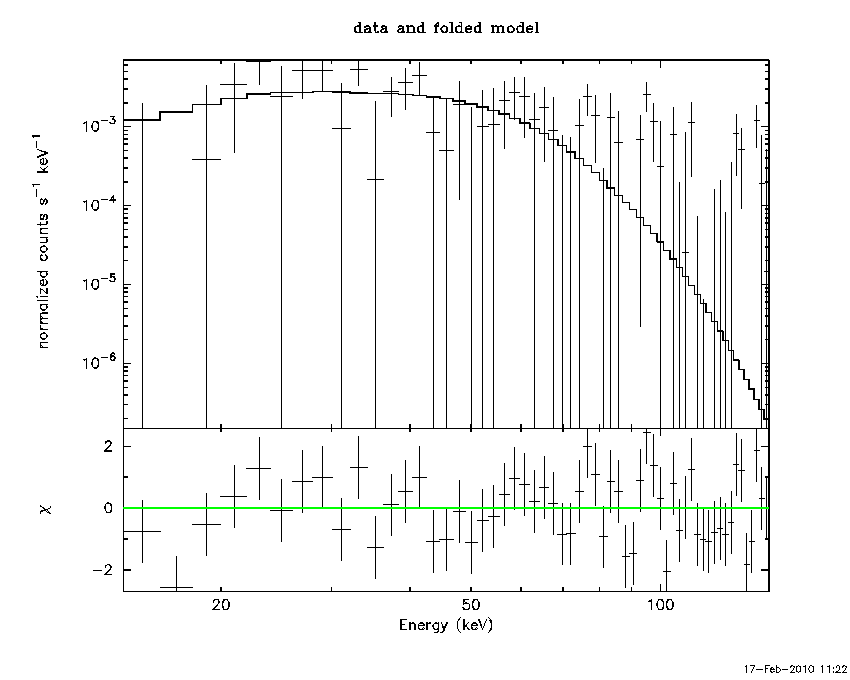
Time averaged spectrum fit using the pre-slew DRM
Power-law model

Time interval is from    0.000 sec. to    0.128 sec.

Spectral model in power-law:
------------------------------------------------------------
Parameters  : value       lower 90%   higher 90%
Photon index: 1.84928     ( -0.488406   0.510728 )
Norm@50keV  : 4.85973E-03    ( -0.00232701   0.00222017 )
------------------------------------------------------------
# Chi-Squared =          83.75 using 59 PHA bins.
# Reduced chi-squared =          1.469 for     57 degrees of freedom
# Null hypothesis probability =   1.206952e-02

Photon flux (15-150 keV)    in 0.128 sec: 0.682773 ( -0.31623  0.315835 ) ph/cm2/s
Energy fluence (15-150 keV)             : 5.67181e-09 ( -2.67315e-09  2.71689e-09 ) ergs/cm2
Cutoff power-law model
Time interval is from    0.000 sec. to    0.128 sec.
Spectral model in the cutoff power-law:
------------------------------------------------------------
Parameters  : value       lower 90%   higher 90%
Photon index: -3.81362     (     )
Epeak [keV] : 48.6263      ( -10.5403 11.6662 )
Norm@50keV  : 5.40962    (     )
------------------------------------------------------------
# Chi-Squared =          67.60 using 59 PHA bins.
# Reduced chi-squared =          1.207 for     56 degrees of freedom
# Null hypothesis probability =   1.377707e-01

Photon flux (15-150 keV)    in 0.128 sec: 0.906723 ( -0.280207  0.280537 ) ph/cm2/s
Energy fluence (15-150 keV)             : 7.69382e-09 ( -2.52397e-09  2.68273e-09 ) ergs/cm2
Band function

Time interval is from    0.000 sec. to    0.128 sec.

Spectral model in the Band function:
------------------------------------------------------------
Parameters  : value       lower 90%   higher 90%
alpha       : 3.61853   ( -1.76316   -2.60299 )
beta        : -9.99945    ( 5814.48   5824.48 )
Epeak [keV] : 48.6759      ( -10.5888 12.0096 )
Norm@50keV   : 4.37045    ( -4.32633   9.83261 )
------------------------------------------------------------
# Chi-Squared =          67.60 using 59 PHA bins.
# Reduced chi-squared =          1.229 for     55 degrees of freedom
# Null hypothesis probability =   1.185204e-01

Photon flux (15-150 keV)    in 0.128 sec: 0.883931 ( -0.272801  0.276259 ) ph/cm2/s
Energy fluence (15-150 keV)             : 8.06944e-09 ( -2.83201e-09  2.57784e-09 ) ergs/cm2
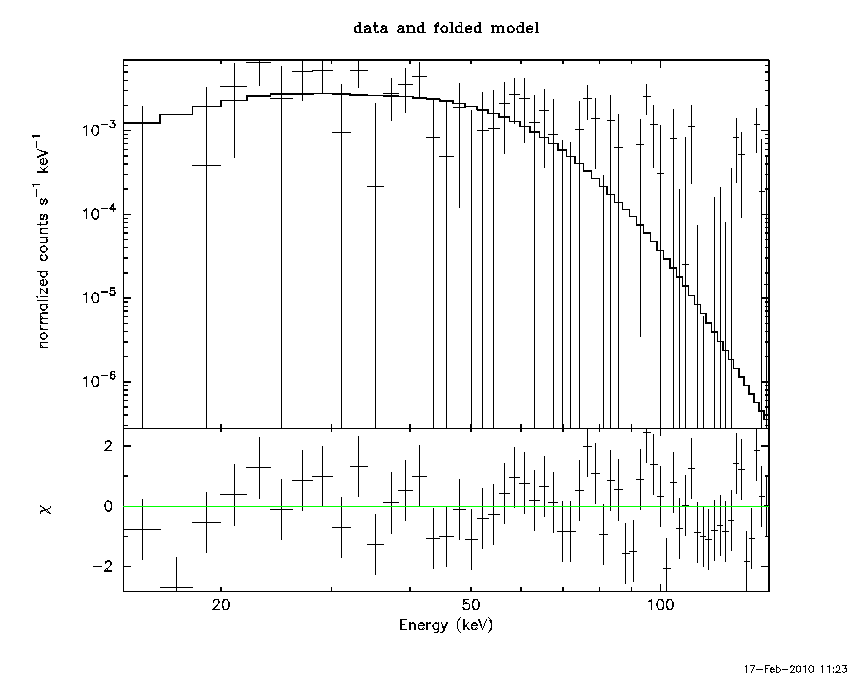
Peak spectrum fit
Power-law model

Time interval is from    0.000 sec. to    0.128 sec.

Spectral model in power-law:
------------------------------------------------------------
Parameters  : value       lower 90%   higher 90%
Photon index: 1.82941     ( -0.495204   0.50727 )
Norm@50keV  : 4.80440E-03    ( -0.00232412   0.00219376 )
------------------------------------------------------------
# Chi-Squared =          85.08 using 59 PHA bins.
# Reduced chi-squared =          1.493 for     57 degrees of freedom
# Null hypothesis probability =   9.359956e-03

Photon flux (15-150 keV)    in 0.128 sec: 0.669598 ( -0.313877  0.313435 ) ph/cm2/s
Energy fluence (15-150 keV)             : 5.60044e-09 ( -2.66778e-09  2.70996e-09 ) ergs/cm2
Cutoff power-law model

Time interval is from    0.000 sec. to    0.128 sec.
Spectral model in the cutoff power-law:
------------------------------------------------------------
Parameters  : value       lower 90%   higher 90%
Photon index: -4.01281     (     )
Epeak [keV] : 48.5498      ( -10.4836 11.6002 )
Norm@50keV  : 6.78423    (     )
------------------------------------------------------------
# Chi-Squared =          68.59 using 59 PHA bins.
# Reduced chi-squared =          1.225 for     56 degrees of freedom
# Null hypothesis probability =   1.205077e-01

Photon flux (15-150 keV)    in 0.128 sec: 0.903774 ( -0.279285  0.279326 ) ph/cm2/s
Energy fluence (15-150 keV)             : 7.69405e-09 ( -2.52387e-09  2.64751e-09 ) ergs/cm2
Band function
Time interval is from    0.000 sec. to    0.128 sec.

Spectral model in the Band function:
------------------------------------------------------------
Parameters  : value       lower 90%   higher 90%
alpha       : 3.70325   ( -2.94074   -3.86664 )
beta        : -9.99768    ( 1365.02   1375.01 )
Epeak [keV] : 48.8080      ( -10.59 11.9473 )
Norm@50keV   : 4.71974    ( -4.65246   9.2265 )
------------------------------------------------------------
# Chi-Squared =          68.57 using 59 PHA bins.
# Reduced chi-squared =          1.247 for     55 degrees of freedom
# Null hypothesis probability =   1.032773e-01

Photon flux (15-150 keV)    in 0.128 sec: 0.883931 ( -0.272801  0.276259 ) ph/cm2/s
Energy fluence (15-150 keV)             : 8.06944e-09 ( -2.83201e-09  2.57784e-09 ) ergs/cm2
Pre-slew spectrum (Pre-slew PHA with pre-slew DRM)
Power-law model

Spectral model in power-law:
------------------------------------------------------------
Parameters  : value       lower 90%   higher 90%
Photon index: 1.84928     ( -0.488406   0.510728 )
Norm@50keV  : 4.85973E-03    ( -0.00232701   0.00222017 )
------------------------------------------------------------
# Chi-Squared =          83.75 using 59 PHA bins.
# Reduced chi-squared =          1.469 for     57 degrees of freedom
# Null hypothesis probability =   1.206952e-02

Photon flux (15-150 keV)    in 0.128 sec: 0.682773 ( -0.31623  0.315835 ) ph/cm2/s
Energy fluence (15-150 keV)             : 5.67181e-09 ( -2.67315e-09  2.71689e-09 ) ergs/cm2
Cutoff power-law model

Spectral model in the cutoff power-law:
------------------------------------------------------------
Parameters  : value       lower 90%   higher 90%
Photon index: -3.81362     (     )
Epeak [keV] : 48.6263      ( -10.5403 11.6662 )
Norm@50keV  : 5.40962    (     )
------------------------------------------------------------
# Chi-Squared =          67.60 using 59 PHA bins.
# Reduced chi-squared =          1.207 for     56 degrees of freedom
# Null hypothesis probability =   1.377707e-01

Photon flux (15-150 keV)    in 0.128 sec: 0.906723 ( -0.280207  0.280537 ) ph/cm2/s
Energy fluence (15-150 keV)             : 7.69382e-09 ( -2.52397e-09  2.68273e-09 ) ergs/cm2
Band function

Spectral model in the Band function:
------------------------------------------------------------
Parameters  : value       lower 90%   higher 90%
alpha       : 3.61853   ( -1.76316   -2.60299 )
beta        : -9.99945    ( 5814.48   5824.48 )
Epeak [keV] : 48.6759      ( -10.5888 12.0096 )
Norm@50keV   : 4.37045    ( -4.32633   9.83261 )
------------------------------------------------------------
# Chi-Squared =          67.60 using 59 PHA bins.
# Reduced chi-squared =          1.229 for     55 degrees of freedom
# Null hypothesis probability =   1.185204e-01

Photon flux (15-150 keV)    in 0.128 sec: 0.883931 ( -0.272801  0.276259 ) ph/cm2/s
Energy fluence (15-150 keV)             : 8.06944e-09 ( -2.83201e-09  2.57784e-09 ) ergs/cm2
S(25-50 keV) vs. S(50-100 keV) plot
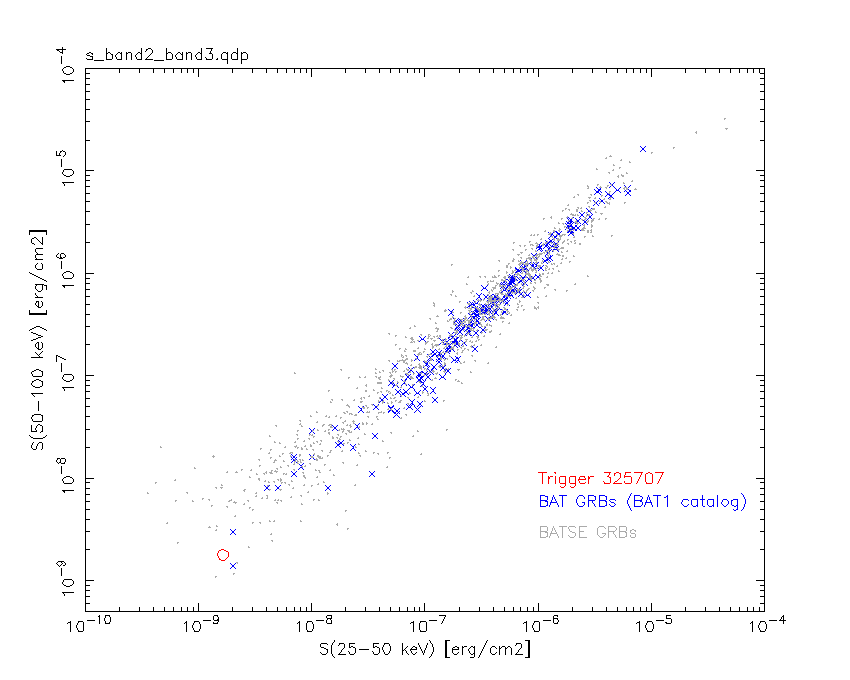
S(25-50 keV)  = 1.63724e-09
S(50-100 keV) = 1.79265e-09
T90 vs. Hardness ratio plot

T90                                   = 0.127999991178513 sec.
Hardness ratio (energy fluence ratio) = 1.09492
Color vs. Color plot
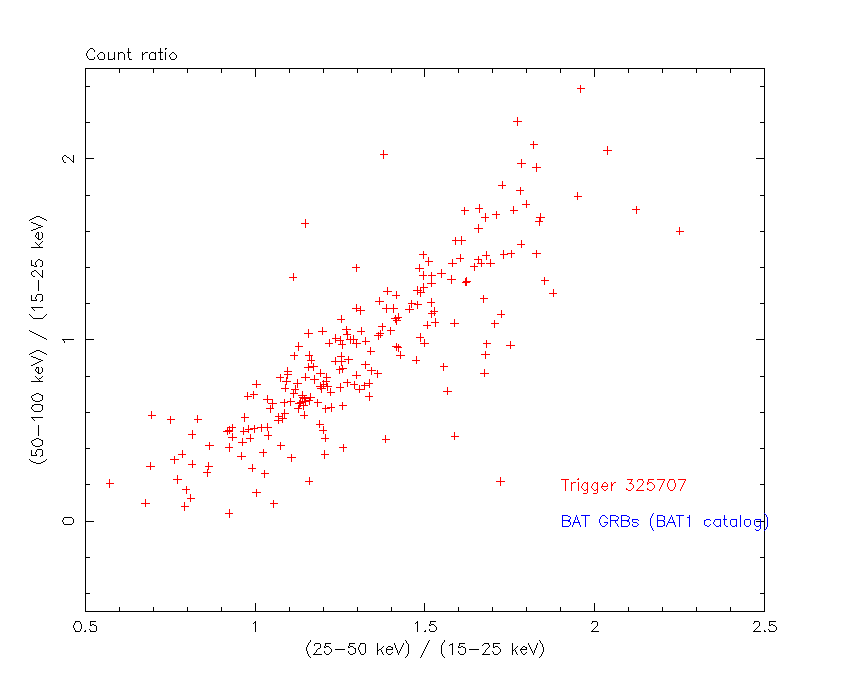
Count Ratio  (25-50 keV) / (15-25 keV) = 30.4393
Count Ratio (50-100 keV) / (15-25 keV) = 19.0459
Mask shadow pattern

IMX = 0, IMY = 0
TIME vs. PHA plot around the trigger time
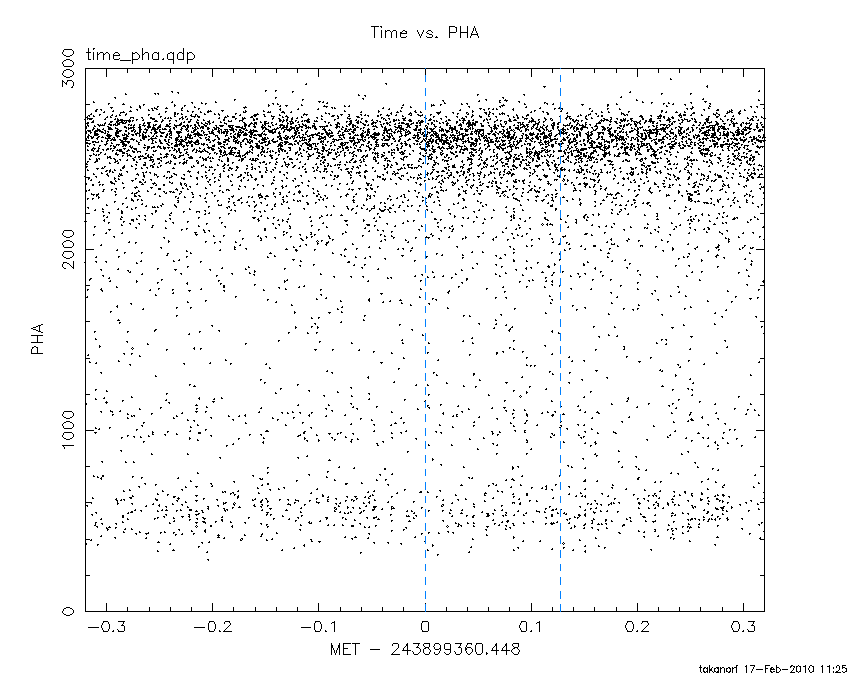
Blue+Cyan dotted lines: Time interval of the scaled map
From 0.000000 to 0.128000
TIME vs. DetID plot around the trigger time
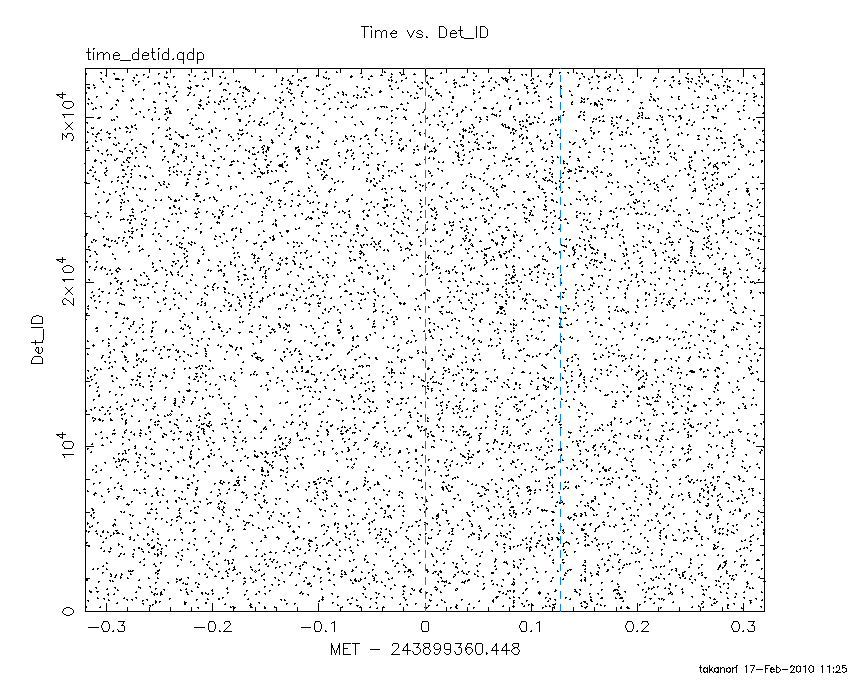
Blue+Cyan dotted lines: Time interval of the scaled map
From 0.000000 to 0.128000
100 us light curve (15-350 keV)
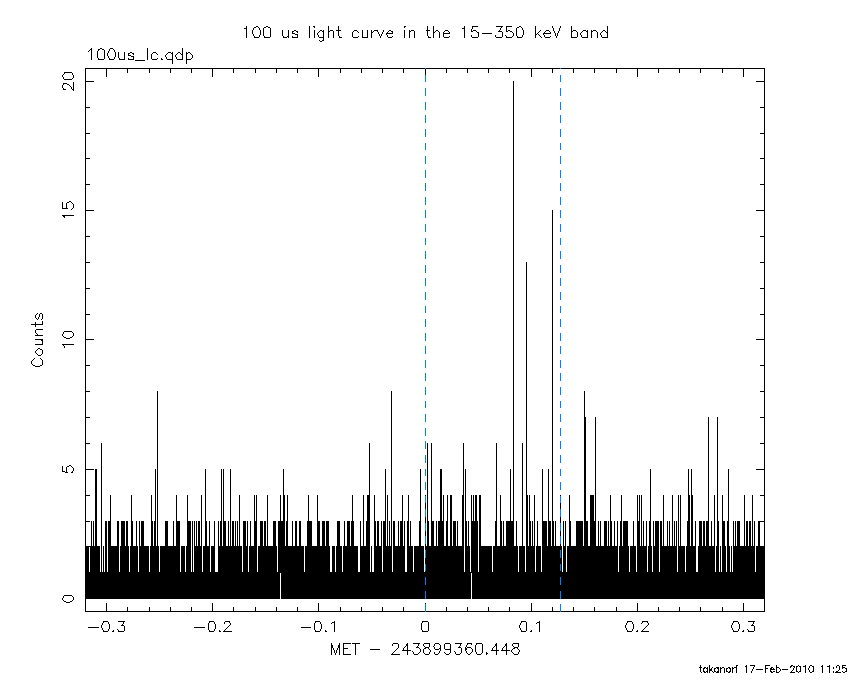
Blue+Cyan dotted lines: Time interval of the scaled map
From 0.000000 to 0.128000
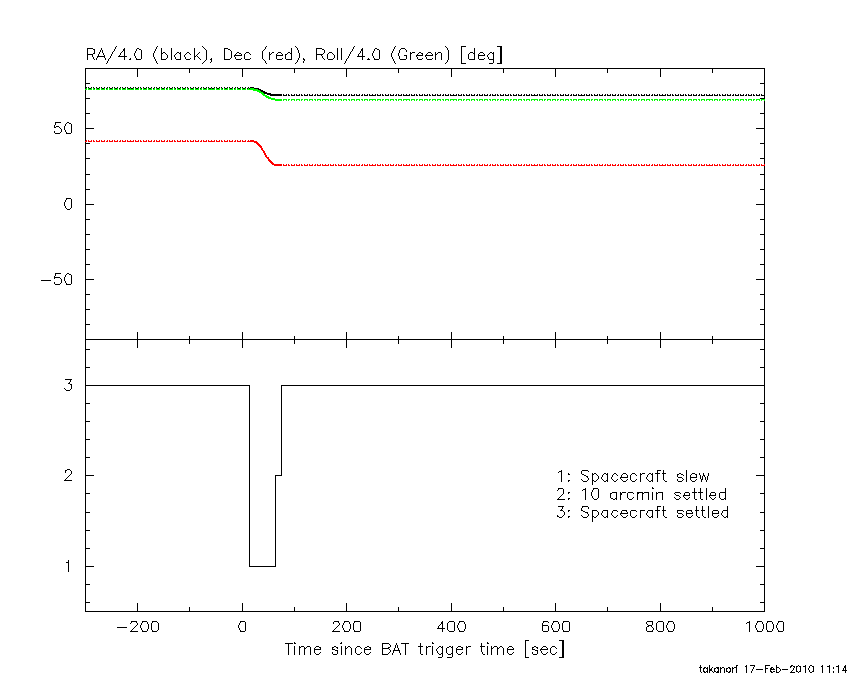
Spacecraft aspect plot
Bright source in the pre-burst/pre-slew/post-slew images
Pre-burst image of 15-350 keV band
Time interval of the image:
-239.448000 -8.448000

# RAcent  DECcent POSerr Theta    Phi  PeakCts   SNR AngSep     Name
#  [deg]    [deg]    ['] [deg]  [deg]                   [']
254.6361  35.3323    8.4  40.8 -115.6   0.7326   1.4    8.8	Her X-1
268.3332  -1.4152    9.5  55.6 -165.1   0.7867   1.2    3.1	SW J1753.5-0127
288.7770  10.9778    1.1  34.7  178.3   2.2538  10.5    2.3	GRS 1915+105
299.6042  35.2040    0.2   8.8 -170.7   8.7971  52.5    0.7	Cyg X-1
308.1247  40.9404    1.9   1.2  102.7   0.9862   6.2    1.0	Cyg X-3
326.3237  38.2299    4.9  15.2   63.0   0.4090   2.4    9.0	Cyg X-2
346.3478  27.2330    3.1  35.1   67.5   1.4073   3.7 ------	UNKNOWN
317.9451   5.6063    2.8  37.5  127.6   1.6620   4.1 ------	UNKNOWN
352.7169  66.5568    2.3  35.0   -4.6   1.1766   5.1 ------	UNKNOWN
264.6098  60.4132    2.0  31.6  -73.8   1.6361   5.8 ------	UNKNOWN
249.7226  42.9154    3.6  41.5 -102.8   2.8268   3.2 ------	UNKNOWN
Pre-slew background subtracted image of 15-350 keV band
Time interval of the image:
0.000000 0.128000

# RAcent  DECcent POSerr Theta    Phi  PeakCts   SNR AngSep     Name
#  [deg]    [deg]    ['] [deg]  [deg]                   [']
254.6501  35.2132   73.7  40.9 -115.8  -0.0016  -0.2   12.2	Her X-1
268.3216  -1.5808    4.3  55.8 -165.2  -0.0346  -2.7    8.2	SW J1753.5-0127
288.7259  11.0802    8.0  34.7  178.5  -0.0063  -1.4    9.1	GRS 1915+105
299.6681  35.0974    5.1   8.9 -171.4   0.0075   2.3    7.3	Cyg X-1
308.1470  40.9189   10.2   1.2  102.8   0.0036   1.1    2.6	Cyg X-3
326.4025  38.2896   48.0  15.2   62.7   0.0008   0.2   11.0	Cyg X-2
Post-slew image of 15-350 keV band
Time interval of the image:
63.652620 102.222000
103.552000 547.962000
549.552000 962.632900

# RAcent  DECcent POSerr Theta    Phi  PeakCts   SNR AngSep     Name
#  [deg]    [deg]    ['] [deg]  [deg]                   [']
254.3577  35.4144   95.5  30.6  -70.6   0.1053   0.1    6.5	Her X-1
262.9369 -24.8196    8.2  56.3 -159.1  -3.1417  -1.4    5.9	GX 1+4
268.3606  -1.4752    1.4  33.5 -148.7   4.6331   8.0    1.4	SW J1753.5-0127
270.2982 -25.1544    4.5  53.9 -166.7   4.1894   2.6    4.6	GX 5-1
270.2185 -25.7372    6.4  54.5 -166.9   3.0270   1.8    4.6	GRS 1758-258
273.9994 -14.0379    9.9  42.3 -166.0   0.9306   1.2    0.4	GX 17+2
275.8388 -30.2221   65.4  57.3 -174.2   0.5066   0.2    9.8	H1820-303
285.0662 -24.9614   28.0  50.9  176.8  -0.5679  -0.4    3.0	HT1900.1-2455
288.8011  10.9482    0.6  14.9  171.4   8.5379  18.9    0.2	GRS 1915+105
299.5967  35.2046    0.2  13.4   36.1  33.3293  68.8    0.4	Cyg X-1
308.1031  40.9319    1.7  22.2   35.3   3.2220   6.8    1.3	Cyg X-3
326.2538  38.4403    6.6  34.2   51.9   1.5651   1.8    8.1	Cyg X-2
295.2013 -28.5713    2.8  54.8  165.6  11.0693   4.1 ------	UNKNOWN
296.0613  36.3878    4.1  12.4   23.0   1.3145   2.8 ------	UNKNOWN
269.3156  16.7033    2.9  20.0 -120.5   1.9956   3.9 ------	UNKNOWN
245.4481  61.7022    2.9  45.9  -33.8   4.2572   4.0 ------	UNKNOWN
248.0454   1.7564    3.3  45.7 -122.3   8.8941   3.5 ------	UNKNOWN
Plot creation:
Wed Feb 17 11:25:47 EST 2010