Special notes of this burst
Image
Pre-slew 15.0-350.0 keV image (Event data)
#   RAcent    DECcent   POSerr    Theta     Phi              Peak Cts       SNR   Name
   95.0586   -55.1722   0.0199    13.9052    96.1645         0.8770481      9.712 TRIG_00326115

Foreground time interval of the image:
 51.292  81.080 (delta_t =  29.788 [sec])
 82.000 121.301 (delta_t =  39.301 [sec])
Background time interval of the image:
-239.000  51.292 (delta_t = 290.292 [sec])
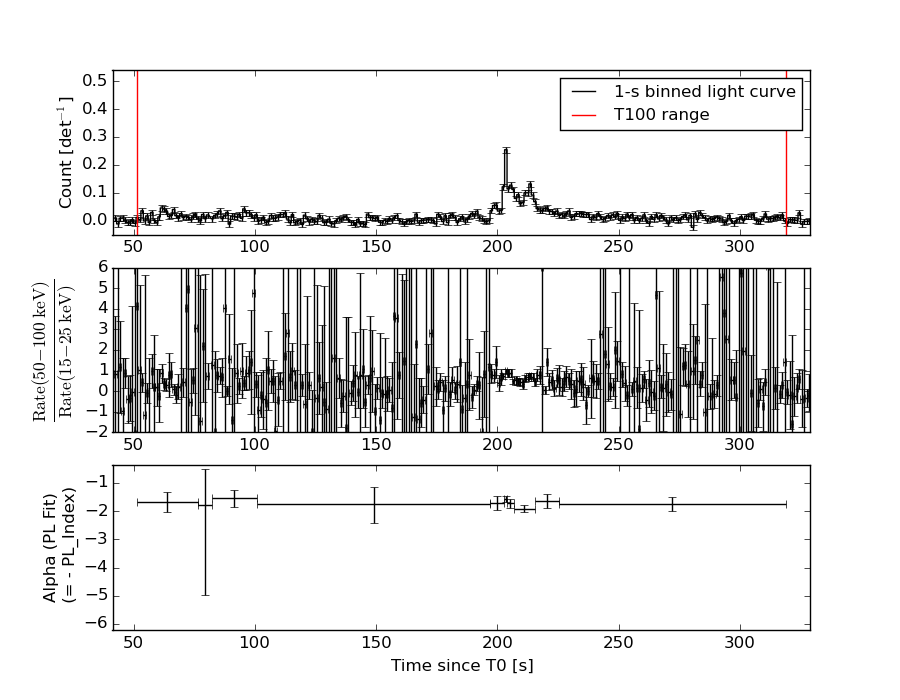
Lightcurves
Notes:
- 1) The mask-weighted light curves are using the flight position.
- 2) Multiple plots of different time binning/intervals are shown to cover all scenarios of short/long GRBs, rate/image triggers, and real/false positives.
- 3) For all the mask-weighted lightcurves, the y-axis units are counts/sec/det where a det is 0.4 x 0.4 = 0.16 sq cm.
- 4) The verticle lines correspond to following: green dotted lines are T50 interval, black dotted lines are T90 interval, blue solid line(s) is a spacecraft slew start time, and orange solid line(s) is a spacecraft slew end time.
- 5) Time of each bin is in the middle of the bin.
1 s binning
From T0-310 s to T0+310 s
From T100_start - 20 s to T100_end + 30 s

Full time interval
64 ms binning
Full time interval
From T100_start to T100_end
From T0-5 sec to T0+5 sec
16 ms binning
From T100_start-5 s to T100_start+5 s
Blue+Cyan dotted lines: Time interval of the scaled map
From 0.000000 to 112.000000
8 ms binning
From T100_start-3 s to T100_start+3 s
Blue+Cyan dotted lines: Time interval of the scaled map
From 0.000000 to 112.000000
2 ms binning
From T100_start-1 s to T100_start+1 s

Blue+Cyan dotted lines: Time interval of the scaled map
From 0.000000 to 112.000000
SN=5 or 10 sec. binning (whichever binning is satisfied first)

SN=5 or 10 sec. binning (T < 200 sec)
Quad-rate summed light curves (from T0-300s to T0+1000s)

Spectral Evolution
Spectra
Notes:
- 1) The fitting includes the systematic errors.
- 2) When the burst includes telescope slew time periods, the fitting uses an average response file made from multiple 5-s response files through out the slew time plus single time preiod for the non-slew times, and weighted by the total counts in the corresponding time period using addrmf. An average response file is needed becuase a spectral fit using the pre-slew DRM will introduce some errors in both a spectral shape and a normalization if the PHA file contains a lot of the slew/post-slew time interval.
- 3) For fits to more complicated models (e.g. a power-law over a cutoff power-law), the BAT team has decided to require a chi-square improvement of more than 6 for each extra dof.
Time averaged spectrum fit using the average DRM
Power-law model
Multiple GTIs in the spectrum
tstart tstop
51.292000 81.080000
82.000000 318.940000

Spectral model in power-law:
------------------------------------------------------------
Parameters  : value       lower 90%   higher 90%
Photon index: 1.72835     ( -0.113836   0.11553 )
Norm@50keV  : 9.84801E-04    ( -6.40128e-05   6.33251e-05 )
------------------------------------------------------------
#Fit statistic : Chi-Squared =          56.61 using 59 PHA bins.
# Reduced chi-squared =         0.9931 for     57 degrees of freedom
# Null hypothesis probability =   4.897052e-01

Photon flux (15-150 keV)    in 266.7 sec: 0.132115 ( -0.00779623  0.00780908 ) ph/cm2/s
Energy fluence (15-150 keV)             : 2.42678e-06 ( -1.65016e-07  1.66831e-07 ) ergs/cm2
Cutoff power-law model
Multiple GTIs in the spectrum
tstart tstop
51.292000 81.080000
82.000000 318.940000
Spectral model in the cutoff power-law:
------------------------------------------------------------
Parameters  : value       lower 90%   higher 90%
Photon index: 2.13721     (     )
Epeak [keV] : 54.0610      (   )
Norm@50keV  : 6.14641E-04    (     )
------------------------------------------------------------
#Fit statistic : Chi-Squared =          56.09 using 59 PHA bins.
# Reduced chi-squared =          1.002 for     56 degrees of freedom
# Null hypothesis probability =   4.714261e-01

Photon flux (15-150 keV)    in 266.7 sec: 0.132069 ( -0.007801  0.007789 ) ph/cm2/s
Energy fluence (15-150 keV)             : 2.42274e-06 ( -1.63884e-07  1.66551e-07 ) ergs/cm2
Band function

Multiple GTIs in the spectrum
tstart tstop
51.292000 81.080000
82.000000 318.940000

Spectral model in the Band function:
------------------------------------------------------------
Parameters  : value       lower 90%   higher 90%
alpha       : -1.58399   ( 1.47821   1.47821 )
beta        : -1.74278    ( 1.74077   0.126336 )
Epeak [keV] : 93.3387      ( -59.1861 904.728 )
Norm@50keV   : 1.22127E-03    ( -0.000275829   179046 )
------------------------------------------------------------
#Fit statistic : Chi-Squared =          56.58 using 59 PHA bins.
# Reduced chi-squared =          1.029 for     55 degrees of freedom
# Null hypothesis probability =   4.159502e-01

Photon flux (15-150 keV)    in 266.7 sec:  (    ) ph/cm2/s
Energy fluence (15-150 keV)             : 0 ( 0  0 ) ergs/cm2
Single BB
Spectral model blackbody:
------------------------------------------------------------
Parameters  : value    Lower 90%  Upper 90%
kT [keV]    : 11.7411  (  )
R^2/D10^2   : 3.26978E-02  (   )
(R is the radius in km and D10 is the distance to the source in units of 10 kpc)
------------------------------------------------------------
#Fit statistic : Chi-Squared =         144.44 using 59 PHA bins.
# Reduced chi-squared =         2.5340 for     57 degrees of freedom
# Null hypothesis probability =   1.558014e-09

Energy  Fluence     90% Error
[keV]   [erg/cm2]   [erg/cm2]
15- 25  2.537e-07   2.804e-08
25- 50  7.781e-07   5.361e-08
50-150  6.354e-07   9.321e-08
15-150  1.667e-06   1.101e-07
Thermal bremsstrahlung (OTTB)
Spectral model: thermal bremsstrahlung
------------------------------------------------------------
Parameters  : value         Lower 90%    Upper 90%
kT [keV]    : 133.272       (-35.6572      48.8142)
Norm        : 0.540563       (-0.0384925     0.0516578)
------------------------------------------------------------
#Fit statistic : Chi-Squared =          62.05 using 59 PHA bins.
# Reduced chi-squared =          1.089 for     57 degrees of freedom
# Null hypothesis probability =   3.009241e-01

Energy  Fluence     90% Error
[keV]   [erg/cm2]   [erg/cm2]
15- 25  3.735e-07   3.414e-08
25- 50  6.800e-07   6.401e-08
50-150  1.275e-06   4.209e-07
15-150  2.329e-06   4.651e-07
Double BB
Spectral model: bbodyrad<1> + bbodyrad<2>
------------------------------------------------------------
Parameters  : value         Lower 90%    Upper 90%
kT1 [keV]   : 6.92691        (-1.00293      1.0545)
R1^2/D10^2  : 0.176583        (-0.0685603      0.132902)
kT2 [keV]   : 30.9524        (-7.08194      13.6743)
R2^2/D10^2  : 8.16457E-04    (-0.000537342   0.00114501)
------------------------------------------------------------
#Fit statistic : Chi-Squared =          57.39 using 59 PHA bins.
# Reduced chi-squared =          1.043 for     55 degrees of freedom
# Null hypothesis probability =   3.867134e-01

Energy  Fluence     90% Error
[keV]   [erg/cm2]   [erg/cm2]
15- 25  3.911e-07   7.548e-08
25- 50  6.817e-07   1.056e-07
50-150  1.413e-06   5.902e-07
15-150  2.486e-06   6.307e-07
Peak spectrum fit
Power-law model

Time interval is from  202.828 sec. to  203.828 sec.

Spectral model in power-law:
------------------------------------------------------------
Parameters  : value       lower 90%   higher 90%
Photon index: 1.50413     ( -0.123306   0.12484 )
Norm@50keV  : 1.66397E-02    ( -0.00120894   0.00120157 )
------------------------------------------------------------
#Fit statistic : Chi-Squared =          57.56 using 59 PHA bins.
# Reduced chi-squared =          1.010 for     57 degrees of freedom
# Null hypothesis probability =   4.541589e-01

Photon flux (15-150 keV)    in 1 sec: 2.07960 ( -0.145188  0.145282 ) ph/cm2/s
Energy fluence (15-150 keV)             : 1.57746e-07 ( -1.26879e-08  1.28062e-08 ) ergs/cm2
Cutoff power-law model

Time interval is from  202.828 sec. to  203.828 sec.
Spectral model in the cutoff power-law:
------------------------------------------------------------
Parameters  : value       lower 90%   higher 90%
Photon index: 1.23033     ( -0.51688   0.336859 )
Epeak [keV] : 138.437      (   )
Norm@50keV  : 2.29803E-02    (     )
------------------------------------------------------------
#Fit statistic : Chi-Squared =          56.57 using 59 PHA bins.
# Reduced chi-squared =          1.010 for     56 degrees of freedom
# Null hypothesis probability =   4.535879e-01

Photon flux (15-150 keV)    in 1 sec: 2.05224 ( -0.1527  0.14987 ) ph/cm2/s
Energy fluence (15-150 keV)             : 1.54123e-07 ( -1.4286e-08  1.4232e-08 ) ergs/cm2
Band function

Time interval is from  202.828 sec. to  203.828 sec.

Spectral model in the Band function:
------------------------------------------------------------
Parameters  : value       lower 90%   higher 90%
alpha       : -1.07172   ( 1.07967   1.07967 )
beta        : -1.68153    ( 1.68018   0.273623 )
Epeak [keV] : 93.6862      ( -99.8335 -99.8335 )
Norm@50keV   : 2.87230E-02    ( -0.0106632   6065.26 )
------------------------------------------------------------
#Fit statistic : Chi-Squared =          56.55 using 59 PHA bins.
# Reduced chi-squared =          1.028 for     55 degrees of freedom
# Null hypothesis probability =   4.167154e-01

Photon flux (15-150 keV)    in 1 sec:  (    ) ph/cm2/s
Energy fluence (15-150 keV)             : 0 ( 0  0 ) ergs/cm2
Single BB
Spectral model blackbody:
------------------------------------------------------------
Parameters  : value    Lower 90%  Upper 90%
kT [keV]    : 14.4227  (-1.27366  1.43147)
R^2/D10^2   : 0.266740  (-0.0747834   0.101923)
(R is the radius in km and D10 is the distance to the source in units of 10 kpc)
------------------------------------------------------------
#Fit statistic : Chi-Squared =         100.55 using 59 PHA bins.
# Reduced chi-squared =         1.7640 for     57 degrees of freedom
# Null hypothesis probability =   3.303722e-04

Energy  Fluence     90% Error
[keV]   [erg/cm2]   [erg/cm2]
15- 25  1.168e-08   1.507e-09
25- 50  4.473e-08   4.425e-09
50-150  6.219e-08   9.135e-09
15-150  1.186e-07   1.125e-08
Thermal bremsstrahlung (OTTB)

Spectral model: thermal bremsstrahlung
------------------------------------------------------------
Parameters  : value         Lower 90%    Upper 90%
kT [keV]    : 200.000       (      )
Norm        : 8.47221       (-0.585717     0.584818)
------------------------------------------------------------
#Fit statistic : Chi-Squared =          57.02 using 59 PHA bins.
# Reduced chi-squared =          1.000 for     57 degrees of freedom
# Null hypothesis probability =   4.744692e-01

Energy  Fluence     90% Error
[keV]   [erg/cm2]   [erg/cm2]
15- 25  2.114e-08   1.650e-09
25- 50  4.066e-08   3.775e-09
50-150  8.916e-08   3.281e-08
15-150  1.510e-07   3.552e-08
Double BB
Spectral model: bbodyrad<1> + bbodyrad<2>
------------------------------------------------------------
Parameters  : value         Lower 90%    Upper 90%
kT1 [keV]   : 6.83314        (-2.22603      2.38439)
R1^2/D10^2  : 2.20483        (-1.29865      6.76186)
kT2 [keV]   : 24.8809        (-5.83519      12.8313)
R2^2/D10^2  : 3.17210E-02    (-0.0239609   0.0554279)
------------------------------------------------------------
#Fit statistic : Chi-Squared =          60.23 using 59 PHA bins.
# Reduced chi-squared =          1.095 for     55 degrees of freedom
# Null hypothesis probability =   2.923025e-01

Energy  Fluence     90% Error
[keV]   [erg/cm2]   [erg/cm2]
15- 25  1.954e-08   5.924e-09
25- 50  4.041e-08   1.088e-08
50-150  9.210e-08   3.063e-08
15-150  1.520e-07   4.950e-08
Pre-slew spectrum (Pre-slew PHA with pre-slew DRM)
Power-law model

Spectral model in power-law:
------------------------------------------------------------
Parameters  : value       lower 90%   higher 90%
Photon index: 1.60468     ( -0.240793   0.247971 )
Norm@50keV  : 8.95782E-04    ( -0.000129061   0.000126041 )
------------------------------------------------------------
#Fit statistic : Chi-Squared =          57.17 using 59 PHA bins.
# Reduced chi-squared =          1.003 for     57 degrees of freedom
# Null hypothesis probability =   4.686004e-01

Photon flux (15-150 keV)    in 69.09 sec: 0.115279 ( -0.0148262  0.0148344 ) ph/cm2/s
Energy fluence (15-150 keV)             : 5.78473e-07 ( -8.96187e-08  9.17363e-08 ) ergs/cm2
Cutoff power-law model
Spectral model in the cutoff power-law:
------------------------------------------------------------
Parameters  : value       lower 90%   higher 90%
Photon index: 1.60192     ( -0.241156   0.250277 )
Epeak [keV] : 9999.32      ( -9999.36 -9999.36 )
Norm@50keV  : 8.98078E-04    ( -0.000130413   0.0013251 )
------------------------------------------------------------
#Fit statistic : Chi-Squared =          57.18 using 59 PHA bins.
# Reduced chi-squared =          1.021 for     56 degrees of freedom
# Null hypothesis probability =   4.311169e-01

Photon flux (15-150 keV)    in 69.09 sec: 0.115320 ( -0.014899  0.014768 ) ph/cm2/s
Energy fluence (15-150 keV)             : 5.76767e-07 ( -9.18268e-08  9.15387e-08 ) ergs/cm2
Band function
Spectral model in the Band function:
------------------------------------------------------------
Parameters  : value       lower 90%   higher 90%
alpha       : -8.00372   ( 8.00372   8.00372 )
beta        : -1.60468    ( -0.247684   0.24115 )
Epeak [keV] : 133.668      ( -133.668 -133.668 )
Norm@50keV   : 0.121749    ( -0.0175414   0.0171308 )
------------------------------------------------------------
#Fit statistic : Chi-Squared =          57.17 using 59 PHA bins.
# Reduced chi-squared =          1.040 for     55 degrees of freedom
# Null hypothesis probability =   3.943269e-01

Photon flux (15-150 keV)    in 69.09 sec:  (    ) ph/cm2/s
Energy fluence (15-150 keV)             : 0 ( 0  0 ) ergs/cm2
S(25-50 keV) vs. S(50-100 keV) plot
S(25-50 keV)  = 6.65e-07
S(50-100 keV) = 8.02e-07
T90 vs. Hardness ratio plot

T90                                   = 233.659999996424 sec.
Hardness ratio (energy fluence ratio) = 1.20602
Color vs. Color plot
Count Ratio  (25-50 keV) / (15-25 keV) = 1.10921
Count Ratio (50-100 keV) / (15-25 keV) = 0.709989
Mask shadow pattern

IMX = -2.658508904638654E-02, IMY = -2.461406601491512E-01
TIME vs. PHA plot around the trigger time
Blue+Cyan dotted lines: Time interval of the scaled map
From 0.000000 to 112.000000
TIME vs. DetID plot around the trigger time

Blue+Cyan dotted lines: Time interval of the scaled map
From 0.000000 to 112.000000
100 us light curve (15-350 keV)

Blue+Cyan dotted lines: Time interval of the scaled map
From 0.000000 to 112.000000
Spacecraft aspect plot
Bright source in the pre-burst/pre-slew/post-slew images
Pre-burst image of 15-350 keV band
Time interval of the image:
-239.000000 51.292000

# RAcent  DECcent POSerr Theta    Phi  PeakCts   SNR AngSep     Name
#  [deg]    [deg]    ['] [deg]  [deg]                   [']
135.5745 -40.5740    1.8  19.0 -130.3   1.2256   6.3    2.4	Vela X-1
170.3844 -60.8335    0.0  25.9  -49.0  -0.3636  -1.5   12.8	Cen X-3
186.7159 -62.7218    3.0  32.7  -40.7   0.9833   3.9    3.3	GX 301-2
277.7693 -65.0809    2.7  57.1   -0.3   4.5622   4.3 ------	UNKNOWN
Pre-slew background subtracted image of 15-350 keV band
Time interval of the image:
51.292000 81.080000
82.000000 121.300590

# RAcent  DECcent POSerr Theta    Phi  PeakCts   SNR AngSep     Name
#  [deg]    [deg]    ['] [deg]  [deg]                   [']
135.7876 -40.6350    0.0  19.1 -129.8  -0.0516  -0.6   12.7	Vela X-1
170.6983 -60.5910    7.4  26.1  -49.4  -0.1490  -1.6   11.4	Cen X-3
186.6426 -62.8063   19.2  32.6  -40.6   0.0662   0.6    2.2	GX 301-2
 39.9294 -76.4396    2.3  33.4   35.3   0.6477   5.1 ------	UNKNOWN
 88.2710 -48.4435    2.1  20.7  110.4   0.5511   5.5 ------	UNKNOWN
 95.0555 -55.1695    1.2  13.9   96.2   0.8804   9.7 ------	UNKNOWN
Post-slew image of 15-350 keV band
Time interval of the image:
158.900590 543.130000

# RAcent  DECcent POSerr Theta    Phi  PeakCts   SNR AngSep     Name
#  [deg]    [deg]    ['] [deg]  [deg]                   [']
135.7103 -40.4972   11.0  30.4 -103.1   1.4398   1.1    9.0	Vela X-1
170.1904 -60.6777    6.0  38.0  -51.5   3.1881   1.9    4.9	Cen X-3
186.8560 -62.6924    6.6  43.8  -42.8  -3.4767  -1.7    7.2	GX 301-2
 60.4453 -34.5418    3.1  31.5  115.0   6.8691   3.7 ------	UNKNOWN
 21.9178 -73.4699    2.8  33.5   28.2   5.6159   4.1 ------	UNKNOWN
127.5292 -14.4024    2.3  47.8 -136.9  12.1706   4.9 ------	UNKNOWN
Plot creation:
Sun May 31 06:11:28 EDT 2015