Special notes of this burst
Image
Pre-slew 15.0-350.0 keV image (Event data)
#   RAcent    DECcent   POSerr    Theta     Phi              Peak Cts       SNR   Name
  339.9611   -40.1464   0.0113    49.2996  -164.5106         1.4683001     17.108 TRIG_00330856

Foreground time interval of the image:
 -8.672   6.816 (delta_t =  15.488 [sec])
Background time interval of the image:
-204.403 -198.624 (delta_t =   5.779 [sec])
-197.904  -8.672 (delta_t = 189.232 [sec])
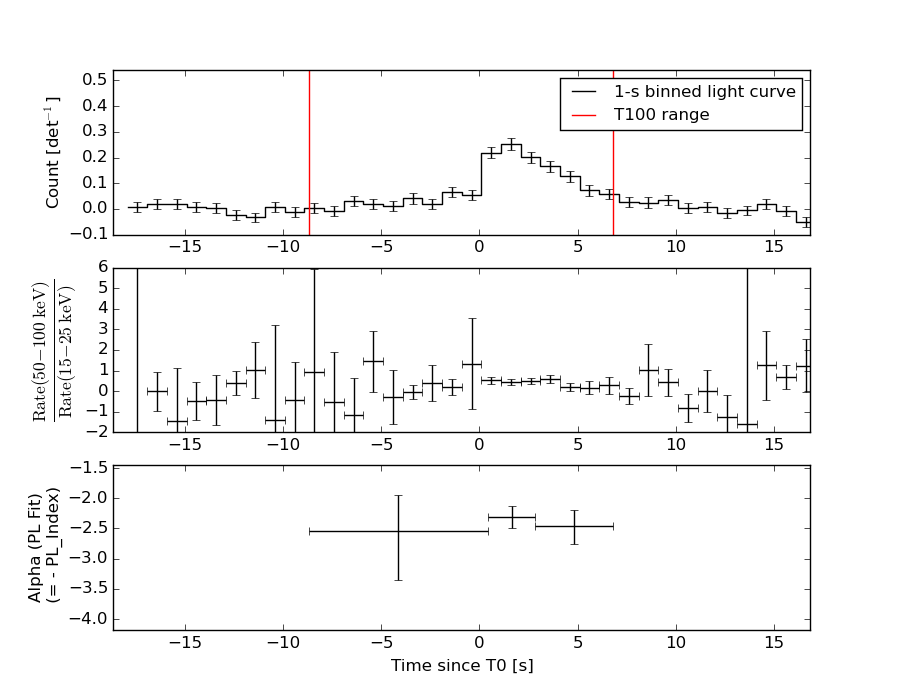
Lightcurves
Notes:
- 1) The mask-weighted light curves are using the flight position.
- 2) Multiple plots of different time binning/intervals are shown to cover all scenarios of short/long GRBs, rate/image triggers, and real/false positives.
- 3) For all the mask-weighted lightcurves, the y-axis units are counts/sec/det where a det is 0.4 x 0.4 = 0.16 sq cm.
- 4) The verticle lines correspond to following: green dotted lines are T50 interval, black dotted lines are T90 interval, blue solid line(s) is a spacecraft slew start time, and orange solid line(s) is a spacecraft slew end time.
- 5) Time of each bin is in the middle of the bin.
1 s binning
From T0-310 s to T0+310 s
From T100_start - 20 s to T100_end + 30 s

Full time interval
64 ms binning
Full time interval
From T100_start to T100_end
From T0-5 sec to T0+5 sec
16 ms binning
From T100_start-5 s to T100_start+5 s
Blue+Cyan dotted lines: Time interval of the scaled map
From 0.000000 to 1.024000
8 ms binning
From T100_start-3 s to T100_start+3 s
Blue+Cyan dotted lines: Time interval of the scaled map
From 0.000000 to 1.024000
2 ms binning
From T100_start-1 s to T100_start+1 s
Blue+Cyan dotted lines: Time interval of the scaled map
From 0.000000 to 1.024000
SN=5 or 10 sec. binning (whichever binning is satisfied first)
SN=5 or 10 sec. binning (T < 200 sec)
Quad-rate summed light curves (from T0-300s to T0+1000s)

Spectral Evolution
Spectra
Notes:
- 1) The fitting includes the systematic errors.
- 2) When the burst includes telescope slew time periods, the fitting uses an average response file made from multiple 5-s response files through out the slew time plus single time preiod for the non-slew times, and weighted by the total counts in the corresponding time period using addrmf. An average response file is needed becuase a spectral fit using the pre-slew DRM will introduce some errors in both a spectral shape and a normalization if the PHA file contains a lot of the slew/post-slew time interval.
- 3) For fits to more complicated models (e.g. a power-law over a cutoff power-law), the BAT team has decided to require a chi-square improvement of more than 6 for each extra dof.
Time averaged spectrum fit using the average DRM
Power-law model

Time interval is from   -8.672 sec. to    6.816 sec.

Spectral model in power-law:
------------------------------------------------------------
Parameters  : value       lower 90%   higher 90%
Photon index: 2.42622     ( -0.187765   0.201096 )
Norm@50keV  : 5.00489E-03    ( -0.000690974   0.000679807 )
------------------------------------------------------------
#Fit statistic : Chi-Squared =          40.96 using 59 PHA bins.
# Reduced chi-squared =         0.7186 for     57 degrees of freedom
# Null hypothesis probability =   9.460893e-01

Photon flux (15-150 keV)    in 15.49 sec: 0.940439 ( -0.0870259  0.0870972 ) ph/cm2/s
Energy fluence (15-150 keV)             : 7.60863e-07 ( -8.08085e-08  8.24153e-08 ) ergs/cm2
Cutoff power-law model

Time interval is from   -8.672 sec. to    6.816 sec.
Spectral model in the cutoff power-law:
------------------------------------------------------------
Parameters  : value       lower 90%   higher 90%
Photon index: 1.51960     ( -1.10084   0.480412 )
Epeak [keV] : 20.1390      (   )
Norm@50keV  : 1.77689E-02    (     )
------------------------------------------------------------
#Fit statistic : Chi-Squared =          37.36 using 59 PHA bins.
# Reduced chi-squared =         0.6672 for     56 degrees of freedom
# Null hypothesis probability =   9.738823e-01

Photon flux (15-150 keV)    in 15.49 sec: 0.908206 ( -0.091486  0.091534 ) ph/cm2/s
Energy fluence (15-150 keV)             : 7.02512e-07 ( -8.93401e-08  9.56074e-08 ) ergs/cm2
Band function

Time interval is from   -8.672 sec. to    6.816 sec.

Spectral model in the Band function:
------------------------------------------------------------
Parameters  : value       lower 90%   higher 90%
alpha       : -0.537572   ( -1.7844   2.6452 )
beta        : -2.91754    ( 2.90916   0.453441 )
Epeak [keV] : 25.3331      ( -7.88335 5.77028 )
Norm@50keV   : 8.52660E-02    ( -0.0775336   6.7199 )
------------------------------------------------------------
#Fit statistic : Chi-Squared =          36.81 using 59 PHA bins.
# Reduced chi-squared =         0.6694 for     55 degrees of freedom
# Null hypothesis probability =   9.717856e-01

Photon flux (15-150 keV)    in 15.49 sec:  (    ) ph/cm2/s
Energy fluence (15-150 keV)             : 7.12672e-07 ( 0  0 ) ergs/cm2
Single BB
Spectral model blackbody:
------------------------------------------------------------
Parameters  : value    Lower 90%  Upper 90%
kT [keV]    : 7.81409  (-0.762042  0.854695)
R^2/D10^2   : 1.10071  (-0.386513   0.592911)
(R is the radius in km and D10 is the distance to the source in units of 10 kpc)
------------------------------------------------------------
#Fit statistic : Chi-Squared =          50.74 using 59 PHA bins.
# Reduced chi-squared =         0.8901 for     57 degrees of freedom
# Null hypothesis probability =   7.076794e-01

Energy  Fluence     90% Error
[keV]   [erg/cm2]   [erg/cm2]
15- 25  1.849e-07   2.754e-08
25- 50  3.105e-07   3.857e-08
50-150  7.542e-08   2.354e-08
15-150  5.709e-07   7.288e-08
Thermal bremsstrahlung (OTTB)
Spectral model: thermal bremsstrahlung
------------------------------------------------------------
Parameters  : value         Lower 90%    Upper 90%
kT [keV]    : 36.5182       (-7.46505      10.1161)
Norm        : 6.40499       (-1.1492     1.4689)
------------------------------------------------------------
#Fit statistic : Chi-Squared =          37.44 using 59 PHA bins.
# Reduced chi-squared =         0.6568 for     57 degrees of freedom
# Null hypothesis probability =   9.789709e-01

Energy  Fluence     90% Error
[keV]   [erg/cm2]   [erg/cm2]
15- 25  2.205e-07   2.703e-08
25- 50  2.784e-07   3.005e-08
50-150  1.944e-07   5.463e-08
15-150  6.932e-07   8.155e-08
Double BB
Spectral model: bbodyrad<1> + bbodyrad<2>
------------------------------------------------------------
Parameters  : value         Lower 90%    Upper 90%
kT1 [keV]   : 5.97742        (-1.4739      1.16828)
R1^2/D10^2  : 2.66430        (-1.28471      4.52105)
kT2 [keV]   : 18.0850        (-6.29185      12.5633)
R2^2/D10^2  : 1.80663E-02    (-0.0159421   0.116989)
------------------------------------------------------------
#Fit statistic : Chi-Squared =          37.15 using 59 PHA bins.
# Reduced chi-squared =         0.6754 for     55 degrees of freedom
# Null hypothesis probability =   9.690118e-01

Energy  Fluence     90% Error
[keV]   [erg/cm2]   [erg/cm2]
15- 25  2.132e-07   6.840e-08
25- 50  2.777e-07   1.121e-07
50-150  2.192e-07   1.238e-07
15-150  7.101e-07   2.611e-07
Peak spectrum fit
Power-law model
Time interval is from    0.652 sec. to    1.652 sec.

Spectral model in power-law:
------------------------------------------------------------
Parameters  : value       lower 90%   higher 90%
Photon index: 2.20364     ( -0.241434   0.265146 )
Norm@50keV  : 1.73202E-02    ( -0.00293752   0.00281943 )
------------------------------------------------------------
#Fit statistic : Chi-Squared =          66.67 using 59 PHA bins.
# Reduced chi-squared =          1.170 for     57 degrees of freedom
# Null hypothesis probability =   1.786188e-01

Photon flux (15-150 keV)    in 1 sec: 2.87292 ( -0.36028  0.360812 ) ph/cm2/s
Energy fluence (15-150 keV)             : 1.62927e-07 ( -2.33419e-08  2.37262e-08 ) ergs/cm2
Cutoff power-law model
Time interval is from    0.652 sec. to    1.652 sec.
Spectral model in the cutoff power-law:
------------------------------------------------------------
Parameters  : value       lower 90%   higher 90%
Photon index: 1.98568     (     )
Epeak [keV] : 3.10850      (   )
Norm@50keV  : 2.26230E-02    (     )
------------------------------------------------------------
#Fit statistic : Chi-Squared =          66.88 using 59 PHA bins.
# Reduced chi-squared =          1.194 for     56 degrees of freedom
# Null hypothesis probability =   1.514796e-01

Photon flux (15-150 keV)    in 1 sec: 2.87372 ( -0.37008  0.35523 ) ph/cm2/s
Energy fluence (15-150 keV)             : 1.62833e-07 ( -2.5115e-08  2.3708e-08 ) ergs/cm2
Band function

Time interval is from    0.652 sec. to    1.652 sec.

Spectral model in the Band function:
------------------------------------------------------------
Parameters  : value       lower 90%   higher 90%
alpha       : -1.85753   ( 1.85721   1.85721 )
beta        : -2.20358    ( 2.20361   0.241627 )
Epeak [keV] : 5.16558      ( -5.12653 -5.12653 )
Norm@50keV   : 3.95025E-02    ( -0.022304   2.69759 )
------------------------------------------------------------
#Fit statistic : Chi-Squared =          66.67 using 59 PHA bins.
# Reduced chi-squared =          1.212 for     55 degrees of freedom
# Null hypothesis probability =   1.345690e-01

Photon flux (15-150 keV)    in 1 sec:  (    ) ph/cm2/s
Energy fluence (15-150 keV)             : 0 ( 0  0 ) ergs/cm2
Single BB

Spectral model blackbody:
------------------------------------------------------------
Parameters  : value    Lower 90%  Upper 90%
kT [keV]    : 9.30796  (-1.44316  1.68551)
R^2/D10^2   : 1.66916  (-0.801063   1.58581)
(R is the radius in km and D10 is the distance to the source in units of 10 kpc)
------------------------------------------------------------
#Fit statistic : Chi-Squared =          87.07 using 59 PHA bins.
# Reduced chi-squared =          1.528 for     57 degrees of freedom
# Null hypothesis probability =   6.327508e-03

Energy  Fluence     90% Error
[keV]   [erg/cm2]   [erg/cm2]
15- 25  2.862e-08   6.525e-09
25- 50  6.407e-08   1.077e-08
50-150  2.707e-08   9.280e-09
15-150  1.197e-07   2.293e-08
Thermal bremsstrahlung (OTTB)
Spectral model: thermal bremsstrahlung
------------------------------------------------------------
Parameters  : value         Lower 90%    Upper 90%
kT [keV]    : 53.6402       (-16.1167      27.3278)
Norm        : 15.4360       (-3.18233     4.39259)
------------------------------------------------------------
#Fit statistic : Chi-Squared =          69.02 using 59 PHA bins.
# Reduced chi-squared =          1.211 for     57 degrees of freedom
# Null hypothesis probability =   1.319963e-01

Energy  Fluence     90% Error
[keV]   [erg/cm2]   [erg/cm2]
15- 25  3.832e-08   6.250e-09
25- 50  5.638e-08   8.305e-09
50-150  5.840e-08   1.896e-08
15-150  1.531e-07   2.460e-08
Double BB
Spectral model: bbodyrad<1> + bbodyrad<2>
------------------------------------------------------------
Parameters  : value         Lower 90%    Upper 90%
kT1 [keV]   : 4.25168        (-1.81754      1.8482)
R1^2/D10^2  : 29.5165        (-24.0399      536.308)
kT2 [keV]   : 16.2476        (-4.79462      10.8142)
R2^2/D10^2  : 0.143397    (-0.123486   0.35451)
------------------------------------------------------------
#Fit statistic : Chi-Squared =          68.59 using 59 PHA bins.
# Reduced chi-squared =          1.247 for     55 degrees of freedom
# Null hypothesis probability =   1.029487e-01

Energy  Fluence     90% Error
[keV]   [erg/cm2]   [erg/cm2]
15- 25  4.360e-08   2.322e-08
25- 50  4.858e-08   2.304e-08
50-150  6.197e-08   3.687e-08
15-150  1.542e-07   7.614e-08
Pre-slew spectrum (Pre-slew PHA with pre-slew DRM)
Power-law model

Spectral model in power-law:
------------------------------------------------------------
Parameters  : value       lower 90%   higher 90%
Photon index: 2.42622     ( -0.187765   0.201096 )
Norm@50keV  : 5.00489E-03    ( -0.000690974   0.000679807 )
------------------------------------------------------------
#Fit statistic : Chi-Squared =          40.96 using 59 PHA bins.
# Reduced chi-squared =         0.7186 for     57 degrees of freedom
# Null hypothesis probability =   9.460893e-01

Photon flux (15-150 keV)    in 15.49 sec: 0.940439 ( -0.0870259  0.0870972 ) ph/cm2/s
Energy fluence (15-150 keV)             : 7.60863e-07 ( -8.08085e-08  8.24153e-08 ) ergs/cm2
Cutoff power-law model

Spectral model in the cutoff power-law:
------------------------------------------------------------
Parameters  : value       lower 90%   higher 90%
Photon index: 1.51960     ( -1.10084   0.480412 )
Epeak [keV] : 20.1390      (   )
Norm@50keV  : 1.77689E-02    (     )
------------------------------------------------------------
#Fit statistic : Chi-Squared =          37.36 using 59 PHA bins.
# Reduced chi-squared =         0.6672 for     56 degrees of freedom
# Null hypothesis probability =   9.738823e-01

Photon flux (15-150 keV)    in 15.49 sec: 0.908206 ( -0.091486  0.091534 ) ph/cm2/s
Energy fluence (15-150 keV)             : 7.02512e-07 ( -8.93401e-08  9.56074e-08 ) ergs/cm2
Band function

Spectral model in the Band function:
------------------------------------------------------------
Parameters  : value       lower 90%   higher 90%
alpha       : -0.537572   ( -2.12678   2.64441 )
beta        : -2.91754    ( 2.90916   0.453441 )
Epeak [keV] : 25.3331      ( -7.88335 5.77028 )
Norm@50keV   : 8.52660E-02    ( -0.0775336   6.7199 )
------------------------------------------------------------
#Fit statistic : Chi-Squared =          36.81 using 59 PHA bins.
# Reduced chi-squared =         0.6694 for     55 degrees of freedom
# Null hypothesis probability =   9.717856e-01

Photon flux (15-150 keV)    in 15.49 sec:  (    ) ph/cm2/s
Energy fluence (15-150 keV)             : 7.12672e-07 ( 0  0 ) ergs/cm2
S(25-50 keV) vs. S(50-100 keV) plot
S(25-50 keV)  = 2.50e-07
S(50-100 keV) = 1.86e-07
T90 vs. Hardness ratio plot
T90                                   = 9.72799998521805 sec.
Hardness ratio (energy fluence ratio) = 0.744
Color vs. Color plot
Count Ratio  (25-50 keV) / (15-25 keV) = 1.19717
Count Ratio (50-100 keV) / (15-25 keV) = 0.403531
Mask shadow pattern
IMX = -1.120363818542023E+00, IMY = 3.104811782056601E-01
TIME vs. PHA plot around the trigger time

Blue+Cyan dotted lines: Time interval of the scaled map
From 0.000000 to 1.024000
TIME vs. DetID plot around the trigger time
Blue+Cyan dotted lines: Time interval of the scaled map
From 0.000000 to 1.024000
100 us light curve (15-350 keV)
Blue+Cyan dotted lines: Time interval of the scaled map
From 0.000000 to 1.024000
Spacecraft aspect plot

Bright source in the pre-burst/pre-slew/post-slew images
Pre-burst image of 15-350 keV band
Time interval of the image:
-204.403400 -198.624100
-197.904000 -8.672000

# RAcent  DECcent POSerr Theta    Phi  PeakCts   SNR AngSep     Name
#  [deg]    [deg]    ['] [deg]  [deg]                   [']
299.5884  35.1993    1.1  49.6  -41.1   6.9985  10.7    0.2	Cyg X-1
308.2395  41.0346    4.0  46.2  -29.9   0.9518   2.9    7.6	Cyg X-3
326.0271  38.2538    4.5  34.3  -18.4   0.4569   2.6    7.9	Cyg X-2
 25.3825  -0.0702    2.0  40.4  110.3   3.2867   5.7 ------	UNKNOWN
  2.7588  39.6345    2.4  34.3   33.2   0.9805   4.9 ------	UNKNOWN
Pre-slew background subtracted image of 15-350 keV band
Time interval of the image:
-8.672000 6.816000

# RAcent  DECcent POSerr Theta    Phi  PeakCts   SNR AngSep     Name
#  [deg]    [deg]    ['] [deg]  [deg]                   [']
299.5741  35.2181    7.0  49.6  -41.1  -0.2487  -1.6    1.3	Cyg X-1
308.2714  40.9547    5.3  46.1  -30.0  -0.1829  -2.2    7.3	Cyg X-3
326.0207  38.2735    4.8  34.4  -18.4  -0.1136  -2.4    7.7	Cyg X-2
 21.5633 -22.6317    2.2  47.1  142.2   0.8246   5.3 ------	UNKNOWN
 11.8276  -8.1490    2.8  31.0  132.1   0.2286   4.0 ------	UNKNOWN
339.9611 -40.1464    0.7  49.3 -164.5   1.4683  17.1 ------	UNKNOWN
Post-slew image of 15-350 keV band
Time interval of the image:
87.596590 962.124100

# RAcent  DECcent POSerr Theta    Phi  PeakCts   SNR AngSep     Name
#  [deg]    [deg]    ['] [deg]  [deg]                   [']
284.9661 -25.0707   12.0  47.9  -40.7   1.6641   1.0    9.8	HT1900.1-2455
 52.8020 -77.2770    3.3  47.3 -148.1   3.4553   3.5 ------	UNKNOWN
Plot creation:
Sun May 31 06:09:13 EDT 2015