Special notes of this burst
Image
Pre-slew 15.0-350.0 keV image (Event data)
#   RAcent    DECcent   POSerr    Theta     Phi              Peak Cts       SNR   Name
  220.3625    33.5614   0.0187     7.7433  -132.8796         0.3969034     10.336 TRIG_00331332

Foreground time interval of the image:
  0.848  19.088 (delta_t =  18.240 [sec])
Background time interval of the image:
-147.731   0.848 (delta_t = 148.579 [sec])
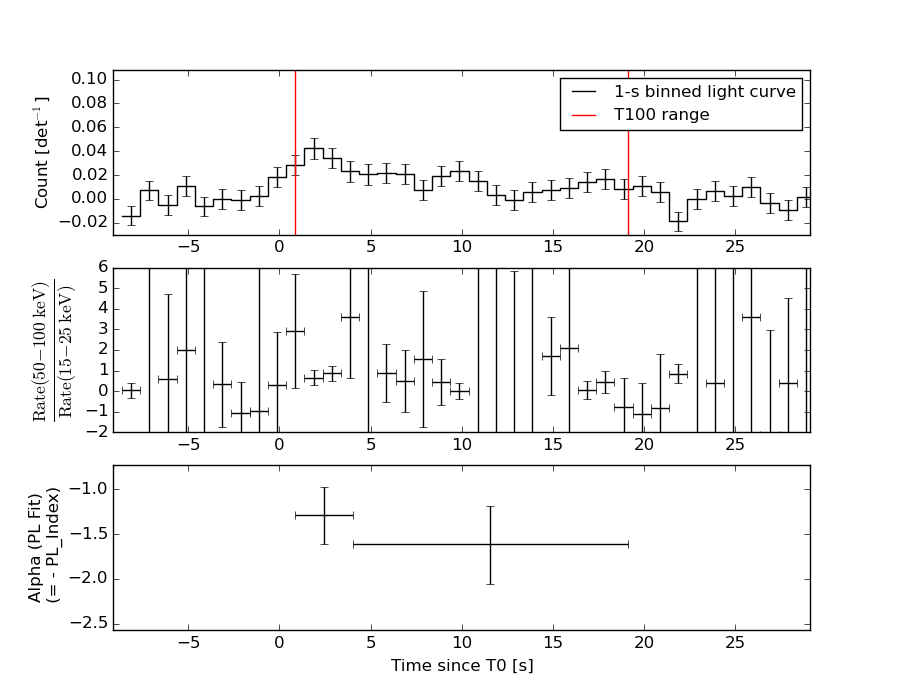
Lightcurves
Notes:
- 1) The mask-weighted light curves are using the flight position.
- 2) Multiple plots of different time binning/intervals are shown to cover all scenarios of short/long GRBs, rate/image triggers, and real/false positives.
- 3) For all the mask-weighted lightcurves, the y-axis units are counts/sec/det where a det is 0.4 x 0.4 = 0.16 sq cm.
- 4) The verticle lines correspond to following: green dotted lines are T50 interval, black dotted lines are T90 interval, blue solid line(s) is a spacecraft slew start time, and orange solid line(s) is a spacecraft slew end time.
- 5) Time of each bin is in the middle of the bin.
1 s binning
From T0-310 s to T0+310 s
From T100_start - 20 s to T100_end + 30 s
Full time interval
64 ms binning
Full time interval
From T100_start to T100_end
From T0-5 sec to T0+5 sec
16 ms binning
From T100_start-5 s to T100_start+5 s
Blue+Cyan dotted lines: Time interval of the scaled map
From 0.000000 to 4.096000
8 ms binning
From T100_start-3 s to T100_start+3 s
Blue+Cyan dotted lines: Time interval of the scaled map
From 0.000000 to 4.096000
2 ms binning
From T100_start-1 s to T100_start+1 s

Blue+Cyan dotted lines: Time interval of the scaled map
From 0.000000 to 4.096000
SN=5 or 10 sec. binning (whichever binning is satisfied first)
SN=5 or 10 sec. binning (T < 200 sec)
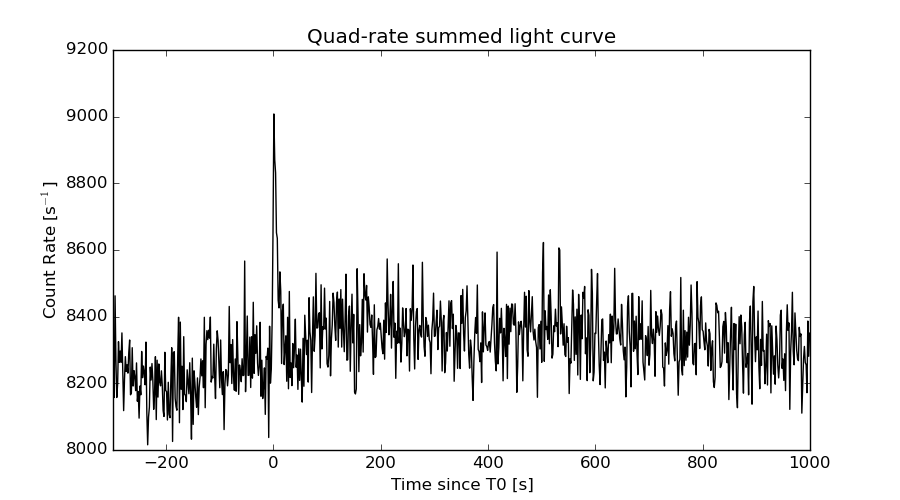
Quad-rate summed light curves (from T0-300s to T0+1000s)
Spectral Evolution
Spectra
Notes:
- 1) The fitting includes the systematic errors.
- 2) When the burst includes telescope slew time periods, the fitting uses an average response file made from multiple 5-s response files through out the slew time plus single time preiod for the non-slew times, and weighted by the total counts in the corresponding time period using addrmf. An average response file is needed becuase a spectral fit using the pre-slew DRM will introduce some errors in both a spectral shape and a normalization if the PHA file contains a lot of the slew/post-slew time interval.
- 3) For fits to more complicated models (e.g. a power-law over a cutoff power-law), the BAT team has decided to require a chi-square improvement of more than 6 for each extra dof.
Time averaged spectrum fit using the average DRM
Power-law model
Time interval is from    0.848 sec. to   19.088 sec.

Spectral model in power-law:
------------------------------------------------------------
Parameters  : value       lower 90%   higher 90%
Photon index: 1.49753     ( -0.291676   0.299445 )
Norm@50keV  : 1.18604E-03    ( -0.000209614   0.00020488 )
------------------------------------------------------------
#Fit statistic : Chi-Squared =          70.45 using 59 PHA bins.
# Reduced chi-squared =          1.236 for     57 degrees of freedom
# Null hypothesis probability =   1.086410e-01

Photon flux (15-150 keV)    in 18.24 sec: 0.147966 ( -0.0238065  0.0238124 ) ph/cm2/s
Energy fluence (15-150 keV)             : 2.05308e-07 ( -3.99728e-08  4.11788e-08 ) ergs/cm2
Cutoff power-law model

Time interval is from    0.848 sec. to   19.088 sec.
Spectral model in the cutoff power-law:
------------------------------------------------------------
Parameters  : value       lower 90%   higher 90%
Photon index: 1.47208     ( -1.22559   1.38843 )
Epeak [keV] : 960.067      (   )
Norm@50keV  : 1.22454E-03    ( -0.000245931   0.00535839 )
------------------------------------------------------------
#Fit statistic : Chi-Squared =          70.45 using 59 PHA bins.
# Reduced chi-squared =          1.258 for     56 degrees of freedom
# Null hypothesis probability =   9.259863e-02

Photon flux (15-150 keV)    in 18.24 sec: 0.147945 ( -0.023818  0.023776 ) ph/cm2/s
Energy fluence (15-150 keV)             : 2.03664e-07 ( -4.72073e-08  4.25193e-08 ) ergs/cm2
Band function

Time interval is from    0.848 sec. to   19.088 sec.

Spectral model in the Band function:
------------------------------------------------------------
Parameters  : value       lower 90%   higher 90%
alpha       : -1.00556   ( 1.00618   5.83153 )
beta        : -1.67116    ( 1.65753   0.443318 )
Epeak [keV] : 80.2623      ( -82.7042 -82.7042 )
Norm@50keV   : 2.30737E-03    ( -0.001229   0.0217591 )
------------------------------------------------------------
#Fit statistic : Chi-Squared =          70.30 using 59 PHA bins.
# Reduced chi-squared =          1.278 for     55 degrees of freedom
# Null hypothesis probability =   8.007738e-02

Photon flux (15-150 keV)    in 18.24 sec:  (    ) ph/cm2/s
Energy fluence (15-150 keV)             : 0 ( 0  0 ) ergs/cm2
Single BB

Spectral model blackbody:
------------------------------------------------------------
Parameters  : value    Lower 90%  Upper 90%
kT [keV]    : 12.8547  (-2.40099  3.24449)
R^2/D10^2   : 2.84503E-02  (-0.0155575   0.0308553)
(R is the radius in km and D10 is the distance to the source in units of 10 kpc)
------------------------------------------------------------
#Fit statistic : Chi-Squared =          78.85 using 59 PHA bins.
# Reduced chi-squared =          1.383 for     57 degrees of freedom
# Null hypothesis probability =   2.923268e-02

Energy  Fluence     90% Error
[keV]   [erg/cm2]   [erg/cm2]
15- 25  1.819e-08   6.229e-09
25- 50  6.188e-08   1.586e-08
50-150  6.422e-08   2.575e-08
15-150  1.443e-07   3.527e-08
Thermal bremsstrahlung (OTTB)

Spectral model: thermal bremsstrahlung
------------------------------------------------------------
Parameters  : value         Lower 90%    Upper 90%
kT [keV]    : 199.363       (-104.529      -199.363)
Norm        : 0.602769       (-0.0968782     0.0968807)
------------------------------------------------------------
#Fit statistic : Chi-Squared =          70.63 using 59 PHA bins.
# Reduced chi-squared =          1.239 for     57 degrees of freedom
# Null hypothesis probability =   1.059886e-01

Energy  Fluence     90% Error
[keV]   [erg/cm2]   [erg/cm2]
15- 25  2.738e-08   1.557e-08
25- 50  5.266e-08   3.000e-08
50-150  1.155e-07   6.647e-08
15-150  1.956e-07   1.105e-07
Double BB

Spectral model: bbodyrad<1> + bbodyrad<2>
------------------------------------------------------------
Parameters  : value         Lower 90%    Upper 90%
kT1 [keV]   : 9.38390        (-4.99976      2.97431)
R1^2/D10^2  : 7.12432E-02        (-0.042161      0.0542711)
kT2 [keV]   : 66.4144        (-55.0746      -72.7018)
R2^2/D10^2  : 1.28538E-04    (-8.24291e-05   0.00783952)
------------------------------------------------------------
#Fit statistic : Chi-Squared =          70.44 using 59 PHA bins.
# Reduced chi-squared =          1.281 for     55 degrees of freedom
# Null hypothesis probability =   7.847198e-02

Energy  Fluence     90% Error
[keV]   [erg/cm2]   [erg/cm2]
15- 25  2.363e-08   1.309e-08
25- 50  5.837e-08   3.179e-08
50-150  1.286e-07   6.616e-08
15-150  2.106e-07   1.033e-07
Peak spectrum fit
Power-law model
Time interval is from    1.084 sec. to    2.084 sec.

Spectral model in power-law:
------------------------------------------------------------
Parameters  : value       lower 90%   higher 90%
Photon index: 1.12930     ( -0.481891   0.465805 )
Norm@50keV  : 3.28364E-03    ( -0.000860125   0.000860124 )
------------------------------------------------------------
#Fit statistic : Chi-Squared =          59.18 using 59 PHA bins.
# Reduced chi-squared =          1.038 for     57 degrees of freedom
# Null hypothesis probability =   3.960246e-01

Photon flux (15-150 keV)    in 1 sec: 0.382034 ( -0.101652  0.102001 ) ph/cm2/s
Energy fluence (15-150 keV)             : 3.40178e-08 ( -9.97316e-09  1.02389e-08 ) ergs/cm2
Cutoff power-law model

Time interval is from    1.084 sec. to    2.084 sec.
Spectral model in the cutoff power-law:
------------------------------------------------------------
Parameters  : value       lower 90%   higher 90%
Photon index: 0.383342     ( -2.90081   1.66404 )
Epeak [keV] : 119.690      ( -119.692 -119.692 )
Norm@50keV  : 7.21840E-03    ( -0.00721852   0.112065 )
------------------------------------------------------------
#Fit statistic : Chi-Squared =          58.74 using 59 PHA bins.
# Reduced chi-squared =          1.049 for     56 degrees of freedom
# Null hypothesis probability =   3.753234e-01

Photon flux (15-150 keV)    in 1 sec: 0.368759 ( -0.108136  0.107437 ) ph/cm2/s
Energy fluence (15-150 keV)             : 3.25142e-08 ( -1.06142e-08  1.09014e-08 ) ergs/cm2
Band function
Time interval is from    1.084 sec. to    2.084 sec.

Spectral model in the Band function:
------------------------------------------------------------
Parameters  : value       lower 90%   higher 90%
alpha       : -0.480501   ( -0.698621   2.97169 )
beta        : -10.0000    ( 10   10 )
Epeak [keV] : 130.918      ( -64.6121 369.812 )
Norm@50keV   : 6.47497E-03    ( -0.00395715   0.111787 )
------------------------------------------------------------
#Fit statistic : Chi-Squared =          58.75 using 59 PHA bins.
# Reduced chi-squared =          1.068 for     55 degrees of freedom
# Null hypothesis probability =   3.398106e-01

Photon flux (15-150 keV)    in 1 sec:  (    ) ph/cm2/s
Energy fluence (15-150 keV)             : 0 ( 0  0 ) ergs/cm2
Single BB

Spectral model blackbody:
------------------------------------------------------------
Parameters  : value    Lower 90%  Upper 90%
kT [keV]    : 19.9432  (-5.60227  8.91316)
R^2/D10^2   : 1.83098E-02  (-0.0126227   0.035345)
(R is the radius in km and D10 is the distance to the source in units of 10 kpc)
------------------------------------------------------------
#Fit statistic : Chi-Squared =          60.00 using 59 PHA bins.
# Reduced chi-squared =          1.053 for     57 degrees of freedom
# Null hypothesis probability =   3.676385e-01

Energy  Fluence     90% Error
[keV]   [erg/cm2]   [erg/cm2]
15- 25  1.405e-09   8.340e-10
25- 50  6.987e-09   3.952e-09
50-150  2.059e-08   1.191e-08
15-150  2.899e-08   1.588e-08
Thermal bremsstrahlung (OTTB)

Spectral model: thermal bremsstrahlung
------------------------------------------------------------
Parameters  : value         Lower 90%    Upper 90%
kT [keV]    : 199.363       (-94.6135      -199.363)
Norm        : 1.55443       (-0.4184     0.418414)
------------------------------------------------------------
#Fit statistic : Chi-Squared =          61.24 using 59 PHA bins.
# Reduced chi-squared =          1.074 for     57 degrees of freedom
# Null hypothesis probability =   3.264942e-01

Energy  Fluence     90% Error
[keV]   [erg/cm2]   [erg/cm2]
15- 25  3.871e-09   2.379e-09
25- 50  7.446e-09   4.412e-09
50-150  1.633e-08   9.980e-09
15-150  2.765e-08   1.653e-08
Double BB
R1^2/D10^2  : 2108.34        (      )
kT2 [keV]   : 21.3957        (-5.94722      10.724)
R2^2/D10^2  : 1.42396E-02    (   )
------------------------------------------------------------
#Fit statistic : Chi-Squared =          57.63 using 59 PHA bins.
#Fit statistic : Chi-Squared =          57.60 using 59 PHA bins.
#Fit statistic : Chi-Squared =          57.53 using 59 PHA bins.
# Reduced chi-squared =          1.048 for     55 degrees of freedom
# Reduced chi-squared =          1.047 for     55 degrees of freedom
# Reduced chi-squared =          1.046 for     55 degrees of freedom
# Null hypothesis probability =   3.783575e-01
# Null hypothesis probability =   3.792305e-01
# Null hypothesis probability =   3.815719e-01

Energy  Fluence     90% Error
[keV]   [erg/cm2]   [erg/cm2]
15- 25  1.942e-09   8.650e-10
25- 50  6.568e-09   3.984e-09
50-150  2.115e-08   1.298e-08
15-150  2.966e-08   1.729e-08
Pre-slew spectrum (Pre-slew PHA with pre-slew DRM)
Power-law model

Spectral model in power-law:
------------------------------------------------------------
Parameters  : value       lower 90%   higher 90%
Photon index: 1.49753     ( -0.291676   0.299445 )
Norm@50keV  : 1.18604E-03    ( -0.000209614   0.00020488 )
------------------------------------------------------------
#Fit statistic : Chi-Squared =          70.45 using 59 PHA bins.
# Reduced chi-squared =          1.236 for     57 degrees of freedom
# Null hypothesis probability =   1.086410e-01

Photon flux (15-150 keV)    in 18.24 sec: 0.147966 ( -0.0238065  0.0238124 ) ph/cm2/s
Energy fluence (15-150 keV)             : 2.05308e-07 ( -3.99728e-08  4.11788e-08 ) ergs/cm2
Cutoff power-law model
Spectral model in the cutoff power-law:
------------------------------------------------------------
Parameters  : value       lower 90%   higher 90%
Photon index: 1.47208     ( -1.22559   1.38849 )
Epeak [keV] : 960.067      (   )
Norm@50keV  : 1.22454E-03    ( -0.000245931   0.00535839 )
------------------------------------------------------------
#Fit statistic : Chi-Squared =          70.45 using 59 PHA bins.
# Reduced chi-squared =          1.258 for     56 degrees of freedom
# Null hypothesis probability =   9.259863e-02

Photon flux (15-150 keV)    in 18.24 sec: 0.147945 ( -0.023818  0.023776 ) ph/cm2/s
Energy fluence (15-150 keV)             : 2.03664e-07 ( -4.72073e-08  4.25193e-08 ) ergs/cm2
Band function
Spectral model in the Band function:
------------------------------------------------------------
Parameters  : value       lower 90%   higher 90%
alpha       : -1.00556   ( 1.00618   5.83147 )
beta        : -1.67116    ( 1.65753   0.443318 )
Epeak [keV] : 80.2623      ( -82.7042 -82.7042 )
Norm@50keV   : 2.30737E-03    ( -0.001229   0.0222108 )
------------------------------------------------------------
#Fit statistic : Chi-Squared =          70.30 using 59 PHA bins.
# Reduced chi-squared =          1.278 for     55 degrees of freedom
# Null hypothesis probability =   8.007738e-02

Photon flux (15-150 keV)    in 18.24 sec:  (    ) ph/cm2/s
Energy fluence (15-150 keV)             : 0 ( 0  0 ) ergs/cm2
S(25-50 keV) vs. S(50-100 keV) plot

S(25-50 keV)  = 5.07e-08
S(50-100 keV) = 7.18e-08
T90 vs. Hardness ratio plot
T90                                   = 17.0879999995232 sec.
Hardness ratio (energy fluence ratio) = 1.41617
Color vs. Color plot
Count Ratio  (25-50 keV) / (15-25 keV) = 1.39473
Count Ratio (50-100 keV) / (15-25 keV) = 0.957071
Mask shadow pattern
IMX = -9.252584379668545E-02, IMY = 9.964078974462079E-02
TIME vs. PHA plot around the trigger time
Blue+Cyan dotted lines: Time interval of the scaled map
From 0.000000 to 4.096000
TIME vs. DetID plot around the trigger time

Blue+Cyan dotted lines: Time interval of the scaled map
From 0.000000 to 4.096000
100 us light curve (15-350 keV)
Blue+Cyan dotted lines: Time interval of the scaled map
From 0.000000 to 4.096000
Spacecraft aspect plot
Bright source in the pre-burst/pre-slew/post-slew images
Pre-burst image of 15-350 keV band
Time interval of the image:
-147.731400 0.848000

# RAcent  DECcent POSerr Theta    Phi  PeakCts   SNR AngSep     Name
#  [deg]    [deg]    ['] [deg]  [deg]                   [']
254.5372  35.4109    7.6  30.8  163.8  -0.2252  -1.5    5.7	Her X-1
267.6986  31.1746    2.1  42.5  162.7   1.2569   5.4 ------	UNKNOWN
260.7128   4.6594    2.8  53.9 -163.6   1.4910   4.1 ------	UNKNOWN
216.1872  10.4138    2.4  29.9 -103.7   0.8248   4.8 ------	UNKNOWN
Pre-slew background subtracted image of 15-350 keV band
Time interval of the image:
0.848000 19.088000

# RAcent  DECcent POSerr Theta    Phi  PeakCts   SNR AngSep     Name
#  [deg]    [deg]    ['] [deg]  [deg]                   [']
254.3447  35.4701   12.2  30.6  163.8  -0.0467  -1.0    9.4	Her X-1
255.8568  40.7120    2.4  30.2  153.2   0.2500   4.9 ------	UNKNOWN
145.2535  30.1438    2.2  56.9    0.7   1.2571   5.3 ------	UNKNOWN
255.0211  20.1441    2.4  39.1 -173.5   0.2732   4.9 ------	UNKNOWN
220.3625  33.5614    1.1   7.7 -132.9   0.3970  10.3 ------	UNKNOWN
Post-slew image of 15-350 keV band
Time interval of the image:
76.268590 962.419800

# RAcent  DECcent POSerr Theta    Phi  PeakCts   SNR AngSep     Name
#  [deg]    [deg]    ['] [deg]  [deg]                   [']
244.9754 -15.6348    0.6  54.6 -152.7  36.0096  18.2    0.4	Sco X-1
254.6867  35.3171    0.0  28.2  133.6  -0.3380  -0.7   11.3	Her X-1
245.4124  62.1043    3.6  32.6   78.4   2.4160   3.2 ------	UNKNOWN
272.3667  10.6461    2.7  52.7  160.0   9.2078   4.2 ------	UNKNOWN
257.2819   1.6739    2.9  47.0 -178.3   3.0647   4.1 ------	UNKNOWN
169.1687  12.9542    3.0  50.7  -44.4   9.6967   3.8 ------	UNKNOWN
Plot creation:
Sun May 31 06:00:11 EDT 2015