Special notes of this burst
Image
Pre-slew 15.0-350.0 keV image (Event data)
#   RAcent    DECcent   POSerr    Theta     Phi              Peak Cts       SNR   Name
   14.5889   -43.5374   0.0203    17.2807    13.0352         0.1537437      9.539 TRIG_00331856

Foreground time interval of the image:
 -0.020   2.956 (delta_t =   2.976 [sec])
Background time interval of the image:
-239.696  -0.020 (delta_t = 239.676 [sec])
Lightcurves
Notes:
- 1) The mask-weighted light curves are using the flight position.
- 2) Multiple plots of different time binning/intervals are shown to cover all scenarios of short/long GRBs, rate/image triggers, and real/false positives.
- 3) For all the mask-weighted lightcurves, the y-axis units are counts/sec/det where a det is 0.4 x 0.4 = 0.16 sq cm.
- 4) The verticle lines correspond to following: green dotted lines are T50 interval, black dotted lines are T90 interval, blue solid line(s) is a spacecraft slew start time, and orange solid line(s) is a spacecraft slew end time.
- 5) Time of each bin is in the middle of the bin.
1 s binning
From T0-310 s to T0+310 s
From T100_start - 20 s to T100_end + 30 s

Full time interval
64 ms binning
Full time interval
From T100_start to T100_end
From T0-5 sec to T0+5 sec
16 ms binning
From T100_start-5 s to T100_start+5 s
Blue+Cyan dotted lines: Time interval of the scaled map
From 0.000000 to 2.048000
8 ms binning
From T100_start-3 s to T100_start+3 s

Blue+Cyan dotted lines: Time interval of the scaled map
From 0.000000 to 2.048000
2 ms binning
From T100_start-1 s to T100_start+1 s
Blue+Cyan dotted lines: Time interval of the scaled map
From 0.000000 to 2.048000
SN=5 or 10 sec. binning (whichever binning is satisfied first)

SN=5 or 10 sec. binning (T < 200 sec)
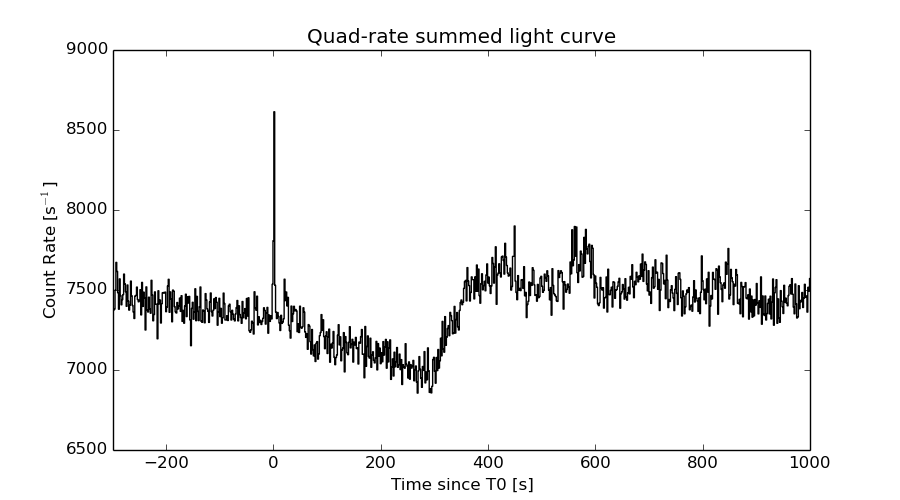
Quad-rate summed light curves (from T0-300s to T0+1000s)
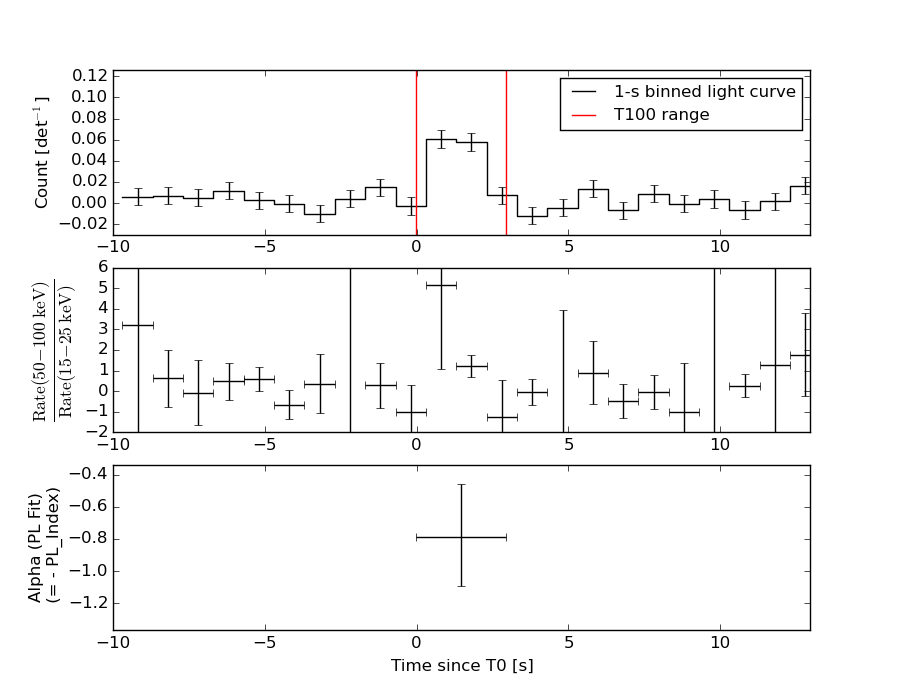
Spectral Evolution
Spectra
Notes:
- 1) The fitting includes the systematic errors.
- 2) When the burst includes telescope slew time periods, the fitting uses an average response file made from multiple 5-s response files through out the slew time plus single time preiod for the non-slew times, and weighted by the total counts in the corresponding time period using addrmf. An average response file is needed becuase a spectral fit using the pre-slew DRM will introduce some errors in both a spectral shape and a normalization if the PHA file contains a lot of the slew/post-slew time interval.
- 3) For fits to more complicated models (e.g. a power-law over a cutoff power-law), the BAT team has decided to require a chi-square improvement of more than 6 for each extra dof.
Time averaged spectrum fit using the average DRM
Power-law model

Time interval is from   -0.020 sec. to    2.956 sec.

Spectral model in power-law:
------------------------------------------------------------
Parameters  : value       lower 90%   higher 90%
Photon index: 0.788878     ( -0.333927   0.304357 )
Norm@50keV  : 3.10088E-03    ( -0.000555197   0.000537287 )
------------------------------------------------------------
#Fit statistic : Chi-Squared =          44.50 using 59 PHA bins.
# Reduced chi-squared =         0.7808 for     57 degrees of freedom
# Null hypothesis probability =   8.858992e-01

Photon flux (15-150 keV)    in 2.976 sec: 0.356540 ( -0.0606195  0.0610069 ) ph/cm2/s
Energy fluence (15-150 keV)             : 1.08348e-07 ( -1.85291e-08  1.86426e-08 ) ergs/cm2
Cutoff power-law model
Time interval is from   -0.020 sec. to    2.956 sec.
Spectral model in the cutoff power-law:
------------------------------------------------------------
Parameters  : value       lower 90%   higher 90%
Photon index: 0.781616     ( -1.06908   0.385311 )
Epeak [keV] : 1.00000E+04      (   )
Norm@50keV  : 3.12305E-03    ( -0.000556876   -0.0031232 )
------------------------------------------------------------
#Fit statistic : Chi-Squared =          44.51 using 59 PHA bins.
# Reduced chi-squared =         0.7949 for     56 degrees of freedom
# Null hypothesis probability =   8.655589e-01

Photon flux (15-150 keV)    in 2.976 sec: 0.357391 ( -0.061607  0.059528 ) ph/cm2/s
Energy fluence (15-150 keV)             : 1.08165e-07 ( -1.83167e-08  1.87181e-08 ) ergs/cm2
Band function
Time interval is from   -0.020 sec. to    2.956 sec.

Spectral model in the Band function:
------------------------------------------------------------
Parameters  : value       lower 90%   higher 90%
alpha       : -0.877018   ( 0.877079   0.877079 )
beta        : -0.788874    ( -0.304085   0.333926 )
Epeak [keV] : 13.0334      ( -13.0327 -13.0327 )
Norm@50keV   : 4.73468E-03    ( -0.00215851   0 )
------------------------------------------------------------
#Fit statistic : Chi-Squared =          44.50 using 59 PHA bins.
# Reduced chi-squared =         0.8092 for     55 degrees of freedom
# Null hypothesis probability =   8.432260e-01

Photon flux (15-150 keV)    in 2.976 sec:  (    ) ph/cm2/s
Energy fluence (15-150 keV)             : 0 ( 0  0 ) ergs/cm2
Single BB
Spectral model blackbody:
------------------------------------------------------------
Parameters  : value    Lower 90%  Upper 90%
kT [keV]    : 26.3020  (-5.82287  9.37265)
R^2/D10^2   : 7.62780E-03  (-0.00443518   0.00870962)
(R is the radius in km and D10 is the distance to the source in units of 10 kpc)
------------------------------------------------------------
#Fit statistic : Chi-Squared =          50.92 using 59 PHA bins.
# Reduced chi-squared =         0.8934 for     57 degrees of freedom
# Null hypothesis probability =   7.011823e-01

Energy  Fluence     90% Error
[keV]   [erg/cm2]   [erg/cm2]
15- 25  2.654e-09   1.003e-09
25- 50  1.544e-08   5.259e-09
50-150  7.849e-08   2.425e-08
15-150  9.659e-08   2.768e-08
Thermal bremsstrahlung (OTTB)
Spectral model: thermal bremsstrahlung
------------------------------------------------------------
Parameters  : value         Lower 90%    Upper 90%
kT [keV]    : 200.000       (      )
Norm        : 1.44387       (-0.253272     0.253244)
------------------------------------------------------------
#Fit statistic : Chi-Squared =          61.90 using 59 PHA bins.
# Reduced chi-squared =          1.086 for     57 degrees of freedom
# Null hypothesis probability =   3.054359e-01

Energy  Fluence     90% Error
[keV]   [erg/cm2]   [erg/cm2]
15- 25  1.071e-08   6.175e-09
25- 50  2.060e-08   1.180e-08
50-150  4.517e-08   2.530e-08
15-150  7.647e-08   4.361e-08
Double BB
R1^2/D10^2  : 3.39544E-02        (      )
kT2 [keV]   : 198.058        (      )
R2^2/D10^2  : 7.85025E-05    (-4.05916e-05   0.00352374)
------------------------------------------------------------
#Fit statistic : Chi-Squared =          44.33 using 59 PHA bins.
#Fit statistic : Chi-Squared =          44.13 using 59 PHA bins.
#Fit statistic : Chi-Squared =          44.01 using 59 PHA bins.
# Reduced chi-squared =         0.8060 for     55 degrees of freedom
# Reduced chi-squared =         0.8024 for     55 degrees of freedom
# Reduced chi-squared =         0.8001 for     55 degrees of freedom
# Null hypothesis probability =   8.477563e-01
# Null hypothesis probability =   8.529108e-01
# Null hypothesis probability =   8.560254e-01

Energy  Fluence     90% Error
[keV]   [erg/cm2]   [erg/cm2]
15- 25  4.841e-09   2.912e-09
25- 50  1.905e-08   1.082e-08
50-150  8.425e-08   4.730e-08
15-150  1.081e-07   5.672e-08
Peak spectrum fit
Power-law model

Time interval is from    0.504 sec. to    1.504 sec.

Spectral model in power-law:
------------------------------------------------------------
Parameters  : value       lower 90%   higher 90%
Photon index: 0.527360     ( -0.434258   0.379199 )
Norm@50keV  : 4.52933E-03    ( -0.00108671   0.00100731 )
------------------------------------------------------------
#Fit statistic : Chi-Squared =          41.94 using 59 PHA bins.
# Reduced chi-squared =         0.7357 for     57 degrees of freedom
# Null hypothesis probability =   9.325174e-01

Photon flux (15-150 keV)    in 1 sec: 0.534109 ( -0.105094  0.106329 ) ph/cm2/s
Energy fluence (15-150 keV)             : 6.0019e-08 ( -1.13899e-08  1.14244e-08 ) ergs/cm2
Cutoff power-law model
Time interval is from    0.504 sec. to    1.504 sec.
Spectral model in the cutoff power-law:
------------------------------------------------------------
Parameters  : value       lower 90%   higher 90%
Photon index: 0.538893     ( -0.698377   0.367948 )
Epeak [keV] : 9999.36      ( -10000 -10000 )
Norm@50keV  : 4.59095E-03    ( -0.00111139   -0.00458628 )
------------------------------------------------------------
#Fit statistic : Chi-Squared =          41.96 using 59 PHA bins.
# Reduced chi-squared =         0.7493 for     56 degrees of freedom
# Null hypothesis probability =   9.181591e-01

Photon flux (15-150 keV)    in 1 sec: 0.536385 ( -0.107689  0.104068 ) ph/cm2/s
Energy fluence (15-150 keV)             : 5.99283e-08 ( -1.12694e-08  1.14105e-08 ) ergs/cm2
Band function
Time interval is from    0.504 sec. to    1.504 sec.

Spectral model in the Band function:
------------------------------------------------------------
Parameters  : value       lower 90%   higher 90%
alpha       : -0.840841   ( 0.840841   0.840841 )
beta        : -0.527369    ( -0.378282   0.434281 )
Epeak [keV] : 13.4504      ( -13.4504 -13.4504 )
Norm@50keV   : 6.91642E-03    ( -0.00375506   65313.3 )
------------------------------------------------------------
#Fit statistic : Chi-Squared =          41.94 using 59 PHA bins.
# Reduced chi-squared =         0.7625 for     55 degrees of freedom
# Null hypothesis probability =   9.024650e-01

Photon flux (15-150 keV)    in 1 sec:  (    ) ph/cm2/s
Energy fluence (15-150 keV)             : 0 ( 0  0 ) ergs/cm2
Single BB

Spectral model blackbody:
------------------------------------------------------------
Parameters  : value    Lower 90%  Upper 90%
kT [keV]    : 34.7347  (-9.45372  19.7559)
R^2/D10^2   : 5.61593E-03  (-0.00375187   0.00801547)
(R is the radius in km and D10 is the distance to the source in units of 10 kpc)
------------------------------------------------------------
#Fit statistic : Chi-Squared =          45.70 using 59 PHA bins.
# Reduced chi-squared =         0.8018 for     57 degrees of freedom
# Null hypothesis probability =   8.585220e-01

Energy  Fluence     90% Error
[keV]   [erg/cm2]   [erg/cm2]
15- 25  9.645e-10   5.126e-10
25- 50  6.289e-09   3.118e-09
50-150  4.988e-08   2.312e-08
15-150  5.714e-08   2.172e-08
Thermal bremsstrahlung (OTTB)

Spectral model: thermal bremsstrahlung
------------------------------------------------------------
Parameters  : value         Lower 90%    Upper 90%
kT [keV]    : 200.000       (      )
Norm        : 2.12324       (-0.444853     0.444814)
------------------------------------------------------------
#Fit statistic : Chi-Squared =          62.72 using 59 PHA bins.
# Reduced chi-squared =          1.100 for     57 degrees of freedom
# Null hypothesis probability =   2.806393e-01

Energy  Fluence     90% Error
[keV]   [erg/cm2]   [erg/cm2]
15- 25  5.291e-09   3.147e-09
25- 50  1.018e-08   5.990e-09
50-150  2.232e-08   1.315e-08
15-150  3.779e-08   2.220e-08
Double BB
Spectral model: bbodyrad<1> + bbodyrad<2>
------------------------------------------------------------
Parameters  : value         Lower 90%    Upper 90%
kT1 [keV]   : 1.54783        (-1.54596      1.13301)
R1^2/D10^2  : 2680.73        (-2703.66      1.60995e+07)
kT2 [keV]   : 37.7207        (-10.8233      25.0863)
R2^2/D10^2  : 4.45938E-03    (-0.00310478   0.00678494)
------------------------------------------------------------
#Fit statistic : Chi-Squared =          38.15 using 59 PHA bins.
# Reduced chi-squared =         0.6936 for     55 degrees of freedom
# Null hypothesis probability =   9.593087e-01

Energy  Fluence     90% Error
[keV]   [erg/cm2]   [erg/cm2]
15- 25  2.831e-09   1.306e-09
25- 50  5.731e-09   2.891e-09
50-150  5.074e-08   2.962e-08
15-150  5.931e-08   2.839e-08
Pre-slew spectrum (Pre-slew PHA with pre-slew DRM)
Power-law model

Spectral model in power-law:
------------------------------------------------------------
Parameters  : value       lower 90%   higher 90%
Photon index: 0.788878     ( -0.333927   0.304357 )
Norm@50keV  : 3.10088E-03    ( -0.000555197   0.000537287 )
------------------------------------------------------------
#Fit statistic : Chi-Squared =          44.50 using 59 PHA bins.
# Reduced chi-squared =         0.7808 for     57 degrees of freedom
# Null hypothesis probability =   8.858992e-01

Photon flux (15-150 keV)    in 2.976 sec: 0.356540 ( -0.0606195  0.0610069 ) ph/cm2/s
Energy fluence (15-150 keV)             : 1.08348e-07 ( -1.85291e-08  1.86426e-08 ) ergs/cm2
Cutoff power-law model

Spectral model in the cutoff power-law:
------------------------------------------------------------
Parameters  : value       lower 90%   higher 90%
Photon index: 0.781616     ( -1.06908   0.385311 )
Epeak [keV] : 1.00000E+04      (   )
Norm@50keV  : 3.12305E-03    ( -0.000556876   -0.0031232 )
------------------------------------------------------------
#Fit statistic : Chi-Squared =          44.51 using 59 PHA bins.
# Reduced chi-squared =         0.7949 for     56 degrees of freedom
# Null hypothesis probability =   8.655589e-01

Photon flux (15-150 keV)    in 2.976 sec: 0.357391 ( -0.061607  0.059528 ) ph/cm2/s
Energy fluence (15-150 keV)             : 1.08165e-07 ( -1.83167e-08  1.87181e-08 ) ergs/cm2
Band function

Spectral model in the Band function:
------------------------------------------------------------
Parameters  : value       lower 90%   higher 90%
alpha       : -0.877018   ( 0.877079   0.877079 )
beta        : -0.788874    ( -0.304085   0.333926 )
Epeak [keV] : 13.0334      ( -13.0327 -13.0327 )
Norm@50keV   : 4.73468E-03    ( -0.00215851   0 )
------------------------------------------------------------
#Fit statistic : Chi-Squared =          44.50 using 59 PHA bins.
# Reduced chi-squared =         0.8092 for     55 degrees of freedom
# Null hypothesis probability =   8.432260e-01

Photon flux (15-150 keV)    in 2.976 sec:  (    ) ph/cm2/s
Energy fluence (15-150 keV)             : 0 ( 0  0 ) ergs/cm2
S(25-50 keV) vs. S(50-100 keV) plot
S(25-50 keV)  = 1.73e-08
S(50-100 keV) = 4.01e-08
T90 vs. Hardness ratio plot
T90                                   = 2.61599999666214 sec.
Hardness ratio (energy fluence ratio) = 2.31792
Color vs. Color plot
Count Ratio  (25-50 keV) / (15-25 keV) = 1.99156
Count Ratio (50-100 keV) / (15-25 keV) = 2.25589
Mask shadow pattern
IMX = 3.030787575824515E-01, IMY = -7.016731303969656E-02
TIME vs. PHA plot around the trigger time
Blue+Cyan dotted lines: Time interval of the scaled map
From 0.000000 to 2.048000
TIME vs. DetID plot around the trigger time
Blue+Cyan dotted lines: Time interval of the scaled map
From 0.000000 to 2.048000
100 us light curve (15-350 keV)

Blue+Cyan dotted lines: Time interval of the scaled map
From 0.000000 to 2.048000
Spacecraft aspect plot
Bright source in the pre-burst/pre-slew/post-slew images
Pre-burst image of 15-350 keV band
Time interval of the image:
-239.696000 -0.020000

# RAcent  DECcent POSerr Theta    Phi  PeakCts   SNR AngSep     Name
#  [deg]    [deg]    ['] [deg]  [deg]                   [']
Pre-slew background subtracted image of 15-350 keV band
Time interval of the image:
-0.020000 2.956000

# RAcent  DECcent POSerr Theta    Phi  PeakCts   SNR AngSep     Name
#  [deg]    [deg]    ['] [deg]  [deg]                   [']
  2.4511 -13.6646    2.0  43.1   53.6   0.3689   5.8 ------	UNKNOWN
 52.0033 -11.7026    2.1  34.1  134.5   0.1415   5.4 ------	UNKNOWN
 14.5889 -43.5374    1.2  17.3   13.0   0.1538   9.6 ------	UNKNOWN
Post-slew image of 15-350 keV band
Time interval of the image:
74.604590 286.204610

# RAcent  DECcent POSerr Theta    Phi  PeakCts   SNR AngSep     Name
#  [deg]    [deg]    ['] [deg]  [deg]                   [']
318.7803 -14.6497    2.3  55.4    4.4   3.0664   5.0 ------	UNKNOWN
Plot creation:
Sun May 31 05:51:26 EDT 2015