Special notes of this burst
Image
Pre-slew 15.0-350.0 keV image (Event data)
#   RAcent    DECcent   POSerr    Theta     Phi              Peak Cts       SNR   Name
  230.2209   -32.7839   0.0210    22.1224   -50.3668         2.3946705      9.181 TRIG_00331964

Foreground time interval of the image:
  0.000 135.424 (delta_t = 135.424 [sec])
137.000 320.000 (delta_t = 183.000 [sec])
Background time interval of the image:
Lightcurves
Notes:
- 1) The mask-weighted light curves are using the flight position.
- 2) Multiple plots of different time binning/intervals are shown to cover all scenarios of short/long GRBs, rate/image triggers, and real/false positives.
- 3) For all the mask-weighted lightcurves, the y-axis units are counts/sec/det where a det is 0.4 x 0.4 = 0.16 sq cm.
- 4) The verticle lines correspond to following: green dotted lines are T50 interval, black dotted lines are T90 interval, blue solid line(s) is a spacecraft slew start time, and orange solid line(s) is a spacecraft slew end time.
- 5) Time of each bin is in the middle of the bin.
1 s binning
From T0-310 s to T0+310 s
From T100_start - 20 s to T100_end + 30 s
Full time interval
64 ms binning
Full time interval
From T100_start to T100_end
From T0-5 sec to T0+5 sec
16 ms binning
From T100_start-5 s to T100_start+5 s
Blue+Cyan dotted lines: Time interval of the scaled map
From 0.000000 to 320.000000
8 ms binning
From T100_start-3 s to T100_start+3 s
Blue+Cyan dotted lines: Time interval of the scaled map
From 0.000000 to 320.000000
2 ms binning
From T100_start-1 s to T100_start+1 s
Blue+Cyan dotted lines: Time interval of the scaled map
From 0.000000 to 320.000000
SN=5 or 10 sec. binning (whichever binning is satisfied first)
SN=5 or 10 sec. binning (T < 200 sec)
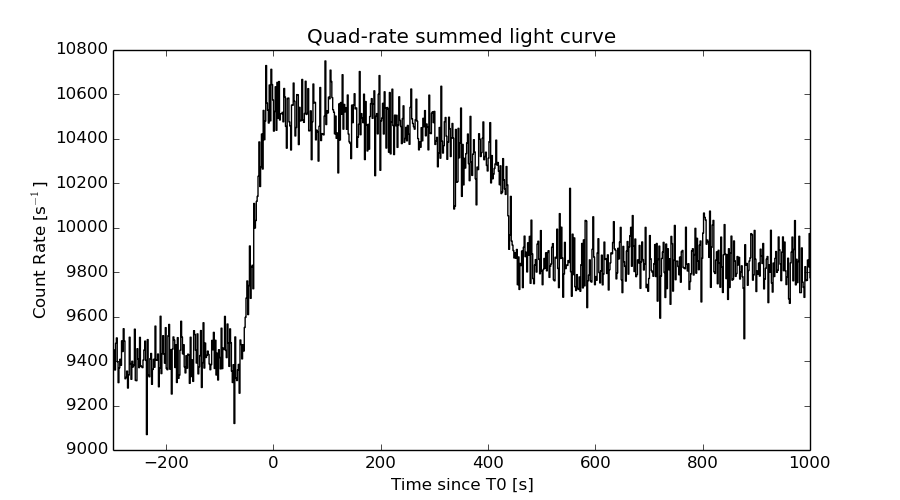
Quad-rate summed light curves (from T0-300s to T0+1000s)
Spectral Evolution

Spectra
Notes:
- 1) The fitting includes the systematic errors.
- 2) When the burst includes telescope slew time periods, the fitting uses an average response file made from multiple 5-s response files through out the slew time plus single time preiod for the non-slew times, and weighted by the total counts in the corresponding time period using addrmf. An average response file is needed becuase a spectral fit using the pre-slew DRM will introduce some errors in both a spectral shape and a normalization if the PHA file contains a lot of the slew/post-slew time interval.
- 3) For fits to more complicated models (e.g. a power-law over a cutoff power-law), the BAT team has decided to require a chi-square improvement of more than 6 for each extra dof.
Time averaged spectrum fit using the average DRM
Power-law model
Multiple GTIs in the spectrum
tstart tstop
0.000000 135.424500
137.000000 320.000000

Spectral model in power-law:
------------------------------------------------------------
Parameters  : value       lower 90%   higher 90%
Photon index: 1.62725     ( -0.233976   0.238161 )
Norm@50keV  : 4.80027E-04    ( -6.54499e-05   6.43279e-05 )
------------------------------------------------------------
#Fit statistic : Chi-Squared =          40.91 using 59 PHA bins.
# Reduced chi-squared =         0.7176 for     57 degrees of freedom
# Null hypothesis probability =   9.467851e-01

Photon flux (15-150 keV)    in 318.4 sec: 6.22178E-02 ( -0.00788757  0.00790406 ) ph/cm2/s
Energy fluence (15-150 keV)             : 1.42488e-06 ( -2.06888e-07  2.11108e-07 ) ergs/cm2
Cutoff power-law model
Multiple GTIs in the spectrum
tstart tstop
0.000000 135.424500
137.000000 320.000000
Spectral model in the cutoff power-law:
------------------------------------------------------------
Parameters  : value       lower 90%   higher 90%
Photon index: 1.61200     ( -0.931662   0.777787 )
Epeak [keV] : 980.696      ( -988.479 -988.479 )
Norm@50keV  : 4.90745E-04    (     )
------------------------------------------------------------
#Fit statistic : Chi-Squared =          40.91 using 59 PHA bins.
# Reduced chi-squared =         0.7304 for     56 degrees of freedom
# Null hypothesis probability =   9.350914e-01

Photon flux (15-150 keV)    in 318.4 sec: 6.21436E-02 ( -0.0083034  0.00795 ) ph/cm2/s
Energy fluence (15-150 keV)             : 1.42898e-06 ( -2.46461e-07  2.05196e-07 ) ergs/cm2
Band function
Multiple GTIs in the spectrum
tstart tstop
0.000000 135.424500
137.000000 320.000000

Spectral model in the Band function:
------------------------------------------------------------
Parameters  : value       lower 90%   higher 90%
alpha       : 4.80841   ( -4.80841   -4.80841 )
beta        : -1.68664    ( -0.279114   0.257285 )
Epeak [keV] : 21.8551      ( -21.8551 70.1682 )
Norm@50keV   : 93.5618    ( -11.6562   353515 )
------------------------------------------------------------
#Fit statistic : Chi-Squared =          40.62 using 59 PHA bins.
# Reduced chi-squared =         0.7385 for     55 degrees of freedom
# Null hypothesis probability =   9.262265e-01

Photon flux (15-150 keV)    in 318.4 sec:  (    ) ph/cm2/s
Energy fluence (15-150 keV)             : 0 ( 0  0 ) ergs/cm2
Single BB
Spectral model blackbody:
------------------------------------------------------------
Parameters  : value    Lower 90%  Upper 90%
kT [keV]    : 13.4597  (-2.24783  2.75858)
R^2/D10^2   : 9.72101E-03  (-0.00470219   0.00909924)
(R is the radius in km and D10 is the distance to the source in units of 10 kpc)
------------------------------------------------------------
#Fit statistic : Chi-Squared =          59.17 using 59 PHA bins.
# Reduced chi-squared =          1.038 for     57 degrees of freedom
# Null hypothesis probability =   3.961465e-01

Energy  Fluence     90% Error
[keV]   [erg/cm2]   [erg/cm2]
15- 25  1.188e-07   3.222e-08
25- 50  4.245e-07   9.006e-08
50-150  4.959e-07   1.329e-07
15-150  1.039e-06   1.836e-07
Thermal bremsstrahlung (OTTB)
Spectral model: thermal bremsstrahlung
------------------------------------------------------------
Parameters  : value         Lower 90%    Upper 90%
kT [keV]    : 163.203       (-74.1932      -162.672)
Norm        : 0.254336       (-0.0343307     0.0438901)
------------------------------------------------------------
#Fit statistic : Chi-Squared =          41.34 using 59 PHA bins.
# Reduced chi-squared =         0.7252 for     57 degrees of freedom
# Null hypothesis probability =   9.410900e-01

Energy  Fluence     90% Error
[keV]   [erg/cm2]   [erg/cm2]
15- 25  2.064e-07   1.153e-07
25- 50  3.871e-07   2.065e-07
50-150  7.903e-07   4.474e-07
15-150  1.384e-06   7.675e-07
Double BB
Spectral model: bbodyrad<1> + bbodyrad<2>
------------------------------------------------------------
Parameters  : value         Lower 90%    Upper 90%
kT1 [keV]   : 5.47446        (-1.67381      2.42407)
R1^2/D10^2  : 0.172963        (-0.126539      0.402135)
kT2 [keV]   : 22.6453        (-5.89925      14.5941)
R2^2/D10^2  : 1.27778E-03    (-0.0010398   0.00257957)
------------------------------------------------------------
#Fit statistic : Chi-Squared =          40.47 using 59 PHA bins.
# Reduced chi-squared =         0.7358 for     55 degrees of freedom
# Null hypothesis probability =   9.285972e-01

Energy  Fluence     90% Error
[keV]   [erg/cm2]   [erg/cm2]
15- 25  2.280e-07   1.207e-07
25- 50  3.590e-07   1.890e-07
50-150  7.945e-07   4.494e-07
15-150  1.382e-06   6.970e-07
Pre-slew spectrum (Pre-slew PHA with pre-slew DRM)
Power-law model

Spectral model in power-law:
------------------------------------------------------------
Parameters  : value       lower 90%   higher 90%
Photon index: 1.62725     ( -0.233976   0.238161 )
Norm@50keV  : 4.80027E-04    ( -6.54499e-05   6.43279e-05 )
------------------------------------------------------------
#Fit statistic : Chi-Squared =          40.91 using 59 PHA bins.
# Reduced chi-squared =         0.7176 for     57 degrees of freedom
# Null hypothesis probability =   9.467851e-01

Photon flux (15-150 keV)    in 318.4 sec: 6.22178E-02 ( -0.00788757  0.00790406 ) ph/cm2/s
Energy fluence (15-150 keV)             : 1.42488e-06 ( -2.06888e-07  2.11108e-07 ) ergs/cm2
Cutoff power-law model
Spectral model in the cutoff power-law:
------------------------------------------------------------
Parameters  : value       lower 90%   higher 90%
Photon index: 1.61200     ( -0.931662   0.777787 )
Epeak [keV] : 980.696      ( -988.479 -988.479 )
Norm@50keV  : 4.90745E-04    (     )
------------------------------------------------------------
#Fit statistic : Chi-Squared =          40.91 using 59 PHA bins.
# Reduced chi-squared =         0.7304 for     56 degrees of freedom
# Null hypothesis probability =   9.350914e-01

Photon flux (15-150 keV)    in 318.4 sec: 6.21436E-02 ( -0.0083034  0.00795 ) ph/cm2/s
Energy fluence (15-150 keV)             : 1.42898e-06 ( -2.46461e-07  2.05196e-07 ) ergs/cm2
Band function

Spectral model in the Band function:
------------------------------------------------------------
Parameters  : value       lower 90%   higher 90%
alpha       : 4.80841   ( -4.80841   -4.80841 )
beta        : -1.68664    ( -0.279114   0.257285 )
Epeak [keV] : 21.8551      ( -21.8551 70.1682 )
Norm@50keV   : 93.5618    ( -11.6562   353515 )
------------------------------------------------------------
#Fit statistic : Chi-Squared =          40.62 using 59 PHA bins.
# Reduced chi-squared =         0.7385 for     55 degrees of freedom
# Null hypothesis probability =   9.262265e-01

Photon flux (15-150 keV)    in 318.4 sec:  (    ) ph/cm2/s
Energy fluence (15-150 keV)             : 0 ( 0  0 ) ergs/cm2
S(25-50 keV) vs. S(50-100 keV) plot
S(25-50 keV)  = 3.74e-07
S(50-100 keV) = 4.84e-07
T90 vs. Hardness ratio plot
T90                                   = 320 sec.
Hardness ratio (energy fluence ratio) = 1.29412
Color vs. Color plot
Count Ratio  (25-50 keV) / (15-25 keV) = 1.16324
Count Ratio (50-100 keV) / (15-25 keV) = 0.867226
Mask shadow pattern
IMX = 2.593034808704709E-01, IMY = 3.130741359772135E-01
TIME vs. PHA plot around the trigger time
Blue+Cyan dotted lines: Time interval of the scaled map
From 0.000000 to 320.000000
TIME vs. DetID plot around the trigger time
Blue+Cyan dotted lines: Time interval of the scaled map
From 0.000000 to 320.000000
100 us light curve (15-350 keV)
Blue+Cyan dotted lines: Time interval of the scaled map
From 0.000000 to 320.000000
Spacecraft aspect plot

Bright source in the pre-burst/pre-slew/post-slew images
Pre-burst image of 15-350 keV band
Time interval of the image:
Pre-slew background subtracted image of 15-350 keV band
Time interval of the image:
0.000000 135.424500
137.000000 320.000000

# RAcent  DECcent POSerr Theta    Phi  PeakCts   SNR AngSep     Name
#  [deg]    [deg]    ['] [deg]  [deg]                   [']
170.2005 -60.4988    9.9  35.3 -161.5   0.3716   1.2    8.2	Cen X-3
186.4921 -62.9282   12.1  27.2 -162.6   0.2524   1.0   10.5	GX 301-2
244.9782 -15.6396    0.2  39.0  -22.3  15.8179  47.3    0.1	Sco X-1
255.9819 -37.8453    0.7  20.6   11.2   3.7343  16.4    0.2	4U 1700-377
256.5379 -36.4328    3.8  22.1   10.3   0.7493   3.0    5.0	GX 349+2
262.9671 -24.6901    4.7  35.0    9.0   0.7876   2.4    4.0	GX 1+4
264.8444 -44.6007    8.4  19.9   38.7   0.3675   1.4   10.0	4U 1735-44
270.3428 -25.1333    2.4  37.8   19.3   1.8962   4.8    4.6	GX 5-1
270.3419 -25.7472    4.7  37.3   19.8   0.9494   2.5    2.1	GRS 1758-258
273.9935 -14.0341  915.9  49.2   15.9  -0.0082  -0.0    0.7	GX 17+2
275.8880 -30.3619    4.0  36.3   31.0   1.1113   2.9    1.9	H1820-303
284.9840 -24.8789    5.0  45.5   35.7   1.7865   2.3    3.8	HT1900.1-2455
263.0314 -33.8069    3.3  27.1   17.8   0.9175   3.5    2.7	GX 354-0
336.5473 -77.8667    2.7  39.2  127.3   2.9531   4.2 ------	UNKNOWN
288.1010 -40.2132    3.0  36.1   54.8   2.0755   3.9 ------	UNKNOWN
266.5762 -32.2531    1.5  30.0   21.2   2.2293   7.5 ------	UNKNOWN
263.2537 -45.2892    2.5  18.6   38.3   1.2144   4.7 ------	UNKNOWN
257.5276 -48.0809    2.7  13.8   38.1   0.9596   4.3 ------	UNKNOWN
230.2209 -32.7839    1.3  22.1  -50.4   2.3949   9.2 ------	UNKNOWN
215.5795 -33.4441    4.6  26.0  -79.3   0.8721   2.5 ------	UNKNOWN
Post-slew image of 15-350 keV band
Time interval of the image:
452.500630 963.101600

# RAcent  DECcent POSerr Theta    Phi  PeakCts   SNR AngSep     Name
#  [deg]    [deg]    ['] [deg]  [deg]                   [']
170.2494 -60.6840   15.4  49.8 -139.7   1.0703   0.8    4.1	Cen X-3
186.4222 -62.9396   11.3  42.7 -134.7  -0.6611  -1.0   12.0	GX 301-2
244.9686 -15.6452    0.7  49.3  -43.5  19.7997  16.0    0.7	Sco X-1
255.9965 -37.8645    1.0  25.1  -45.9   3.7212  11.5    1.3	4U 1700-377
256.5165 -36.5179    3.6  26.0  -43.5   1.0540   3.2    6.9	GX 349+2
263.0494 -24.6850    4.8  34.9  -24.3   0.8904   2.4    4.2	GX 1+4
264.7622 -44.4355   13.0  16.1  -39.4   0.2607   0.9    1.2	4U 1735-44
268.2492  -1.6039    0.0  56.6  -10.9  -1.3846  -1.2   11.5	SW J1753.5-0127
270.2584 -25.0840    2.0  33.1  -13.0   2.1888   5.9    1.4	GX 5-1
270.3126 -25.7843    4.6  32.4  -13.2   0.9058   2.5    2.5	GRS 1758-258
273.9945 -14.0165    4.8  43.6   -5.2   1.4103   2.4    1.4	GX 17+2
275.9455 -30.3110    5.1  27.2   -4.4   0.7703   2.3    3.5	H1820-303
285.1616 -24.8258    3.5  32.8   12.0   1.1587   3.3    8.9	HT1900.1-2455
262.9533 -33.8024    1.6  26.3  -30.1   2.1150   7.1    2.6	GX 354-0
296.9727 -70.5795    3.1  15.0  161.1   1.0310   3.7 ------	UNKNOWN
266.5703 -32.1985    1.2  26.8  -22.5   3.2954   9.8 ------	UNKNOWN
255.1519 -41.6693    1.8  22.3  -52.5   2.0510   6.6 ------	UNKNOWN
150.3102 -72.5379    3.0  45.5 -157.9   2.4291   3.8 ------	UNKNOWN
186.9835 -58.2486    3.1  45.4 -129.3   4.2996   3.7 ------	UNKNOWN
220.8136 -40.4414    3.4  40.8  -88.6   5.3390   3.4 ------	UNKNOWN
213.7570 -45.2666    4.4  41.3  -99.3   4.9061   2.6 ------	UNKNOWN
Plot creation:
Sun May 31 05:49:22 EDT 2015