Special notes of this burst
Image
Pre-slew 15.0-350.0 keV image (Event data)
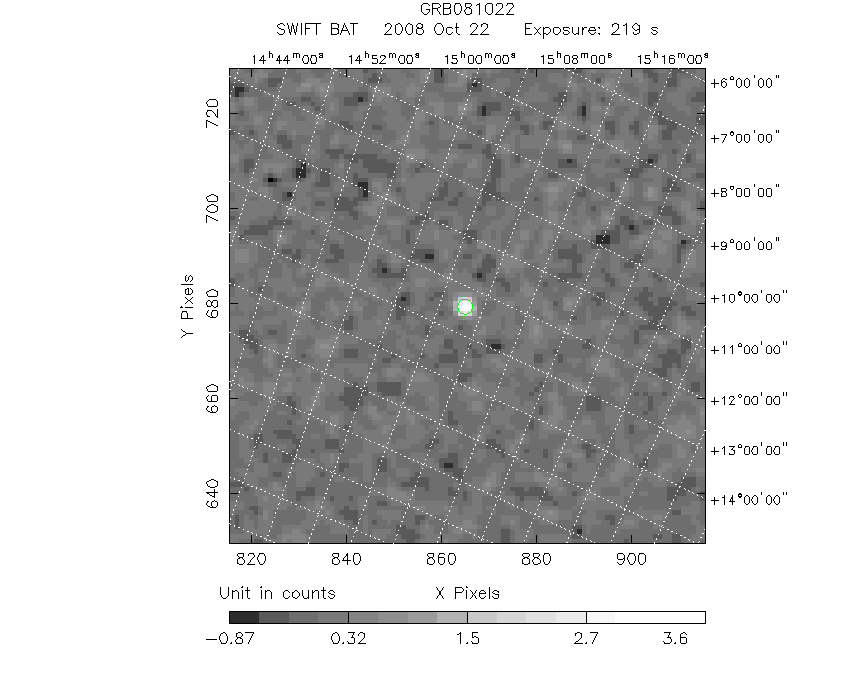
#   RAcent    DECcent   POSerr    Theta     Phi              Peak Cts       SNR   Name
  226.5815    12.4092   0.0103    23.1248   -85.8716         4.0107209     18.691 TRIG_00332399

Foreground time interval of the image:
 -4.928 213.820 (delta_t = 218.748 [sec])
Background time interval of the image:
-239.000  -4.928 (delta_t = 234.072 [sec])
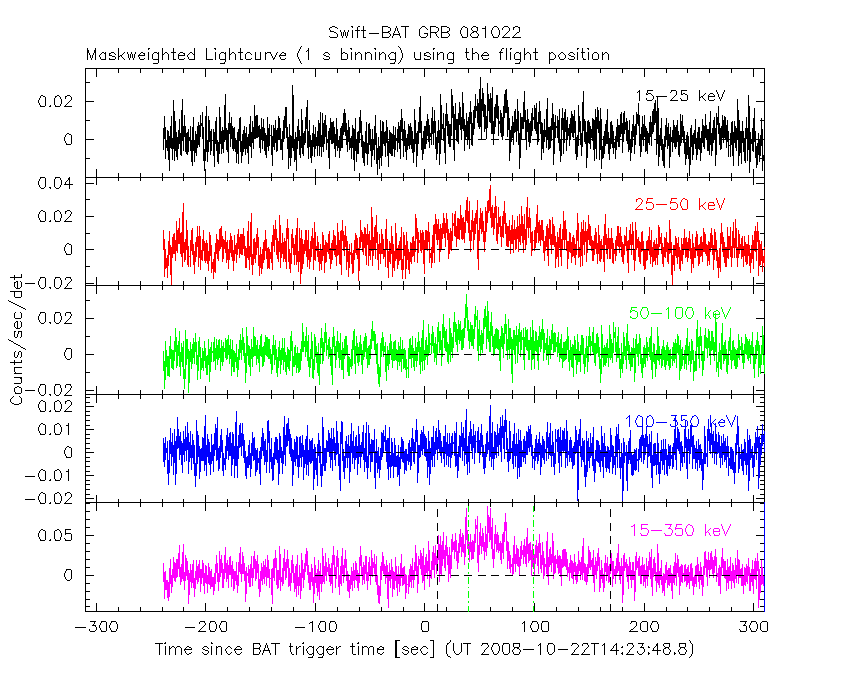
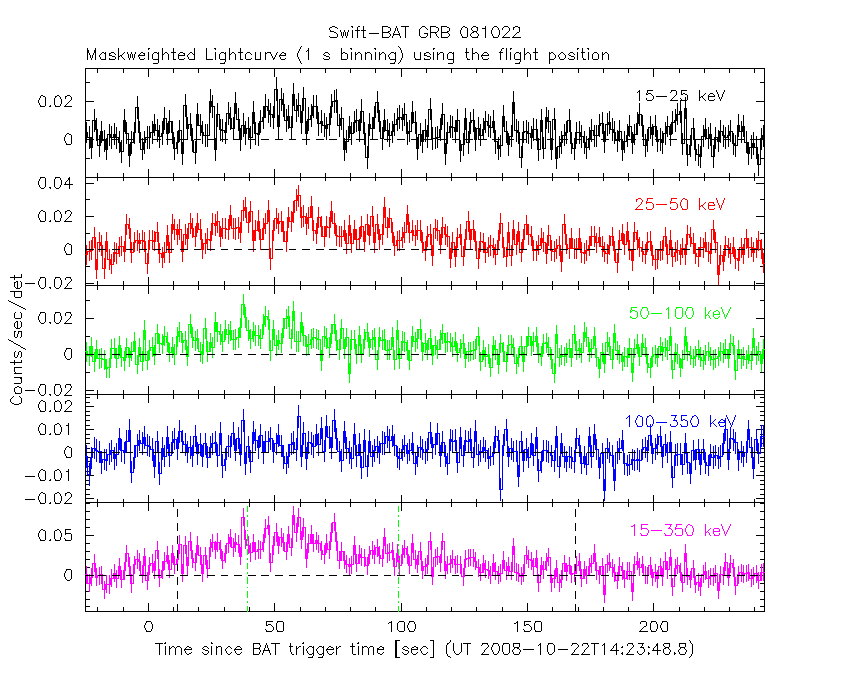
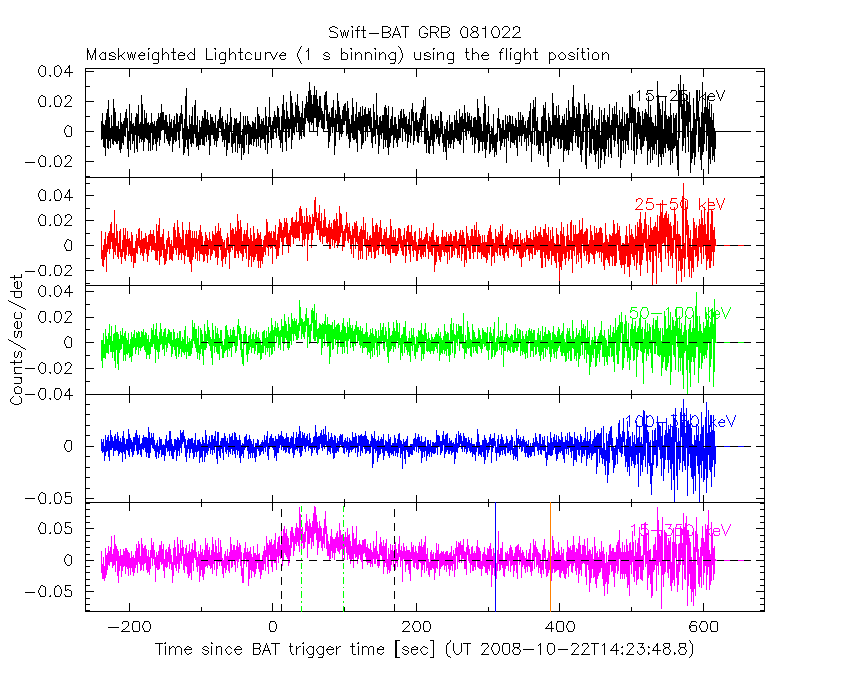
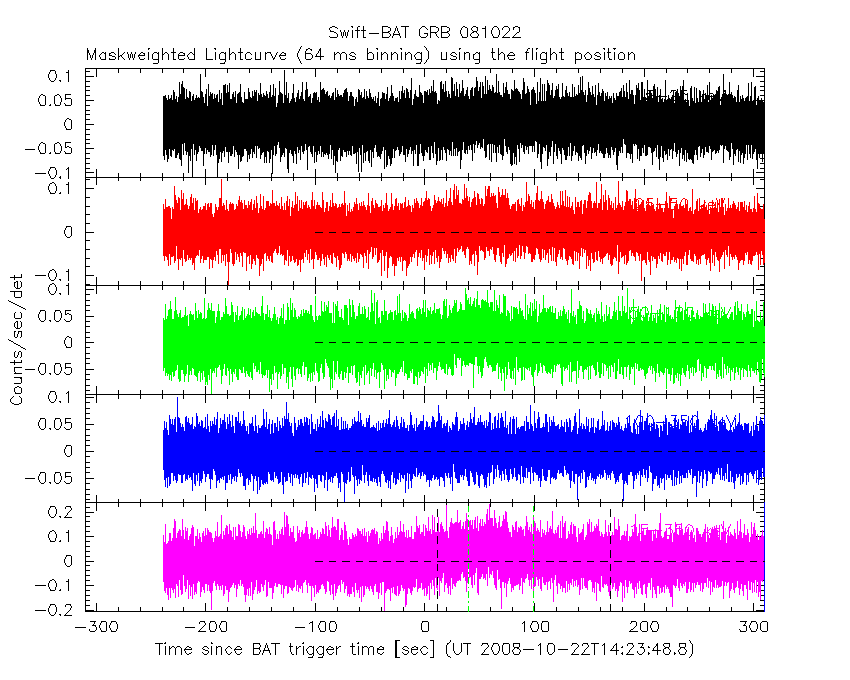
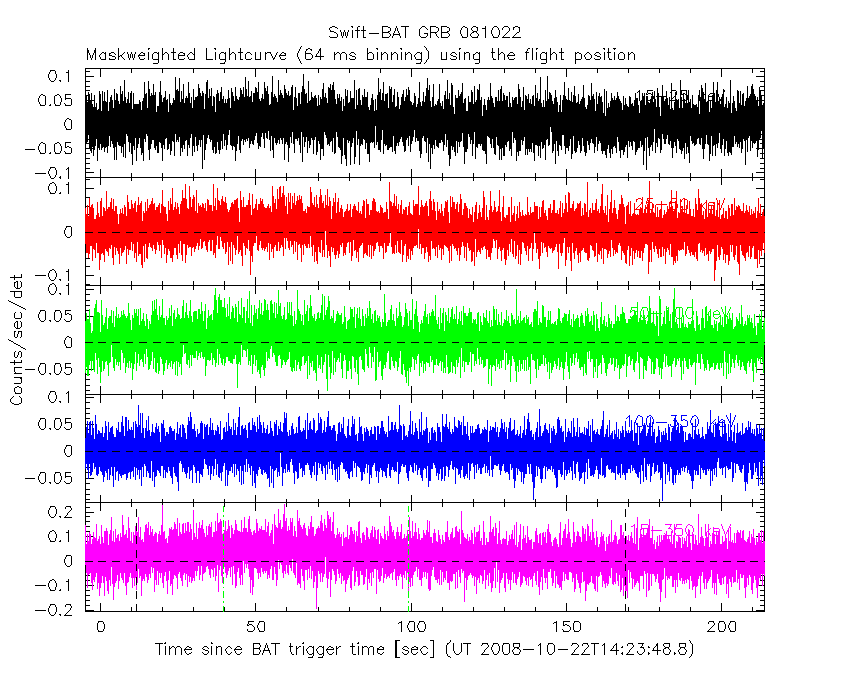
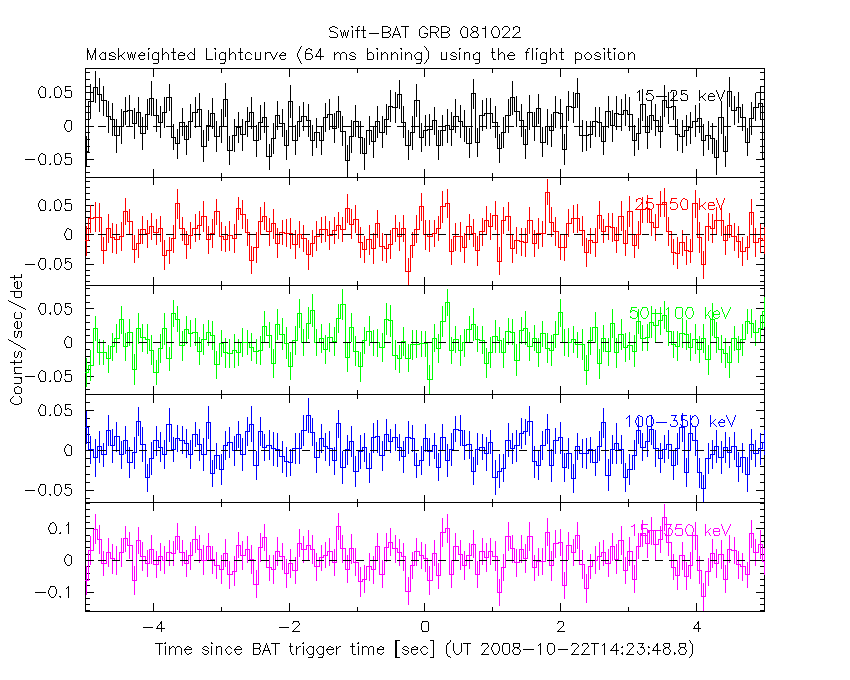
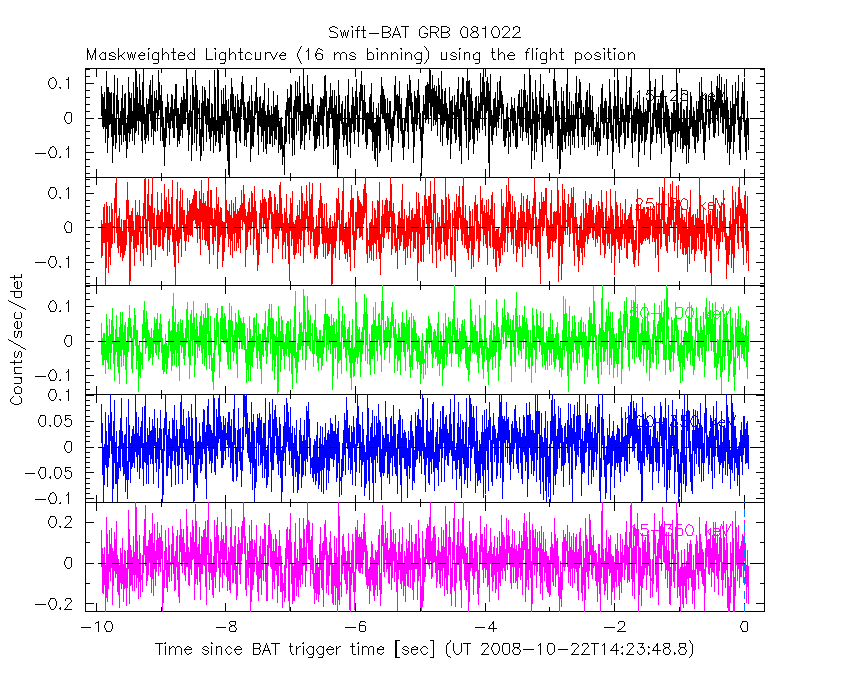
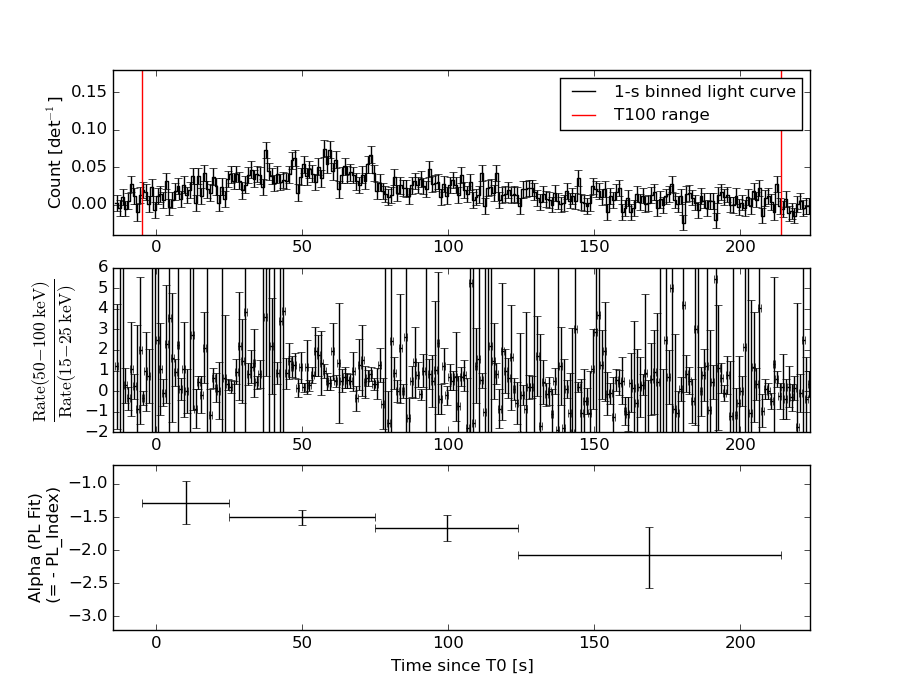
Lightcurves
Notes:
- 1) The mask-weighted light curves are using the flight position.
- 2) Multiple plots of different time binning/intervals are shown to cover all scenarios of short/long GRBs, rate/image triggers, and real/false positives.
- 3) For all the mask-weighted lightcurves, the y-axis units are counts/sec/det where a det is 0.4 x 0.4 = 0.16 sq cm.
- 4) The verticle lines correspond to following: green dotted lines are T50 interval, black dotted lines are T90 interval, blue solid line(s) is a spacecraft slew start time, and orange solid line(s) is a spacecraft slew end time.
- 5) Time of each bin is in the middle of the bin.
1 s binning
From T0-310 s to T0+310 s
From T100_start - 20 s to T100_end + 30 s
Full time interval
64 ms binning
Full time interval
From T100_start to T100_end
From T0-5 sec to T0+5 sec
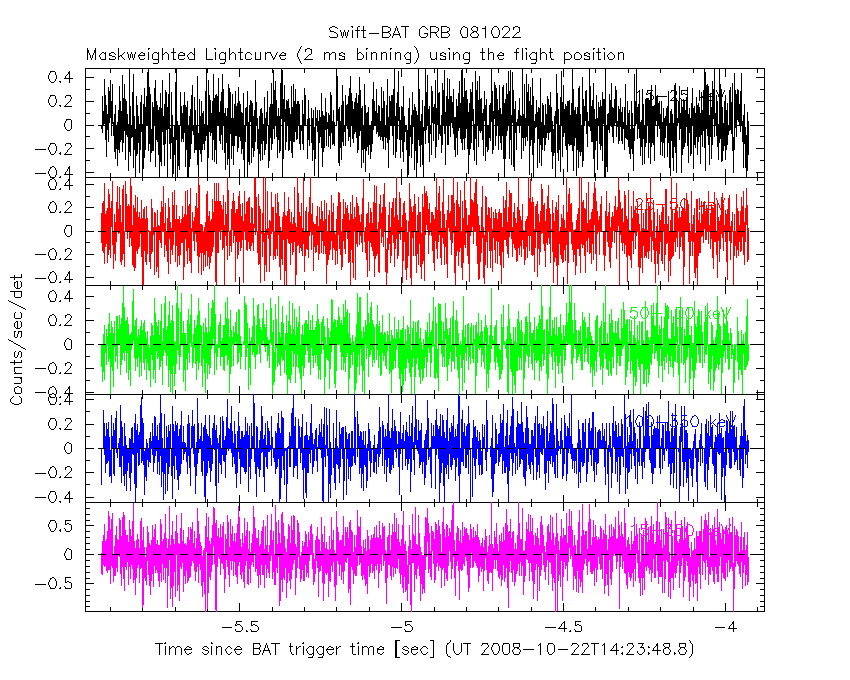
16 ms binning
From T100_start-5 s to T100_start+5 s
Blue+Cyan dotted lines: Time interval of the scaled map
From 0.000000 to 64.000000
8 ms binning
From T100_start-3 s to T100_start+3 s

Blue+Cyan dotted lines: Time interval of the scaled map
From 0.000000 to 64.000000
2 ms binning
From T100_start-1 s to T100_start+1 s
Blue+Cyan dotted lines: Time interval of the scaled map
From 0.000000 to 64.000000
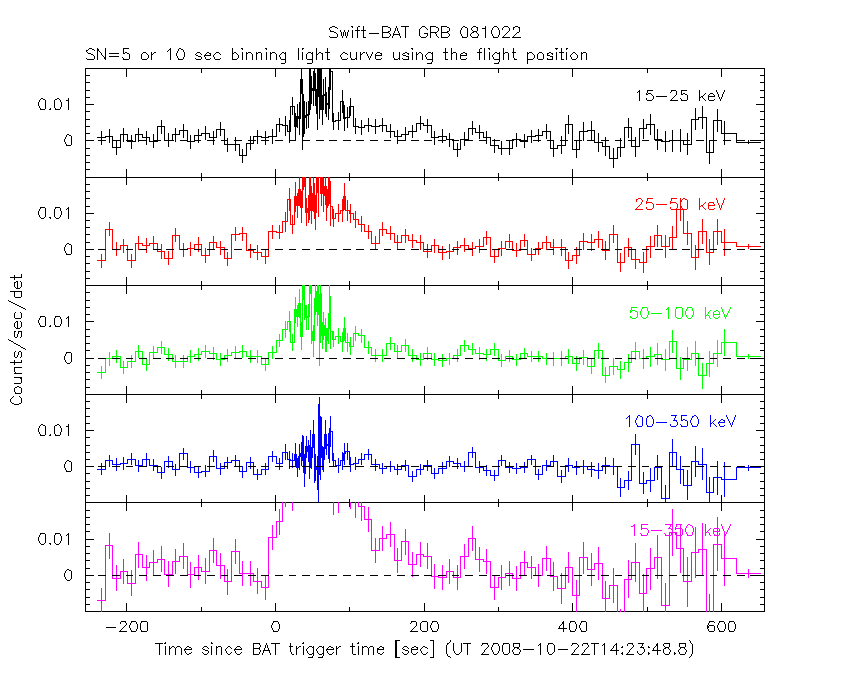
SN=5 or 10 sec. binning (whichever binning is satisfied first)
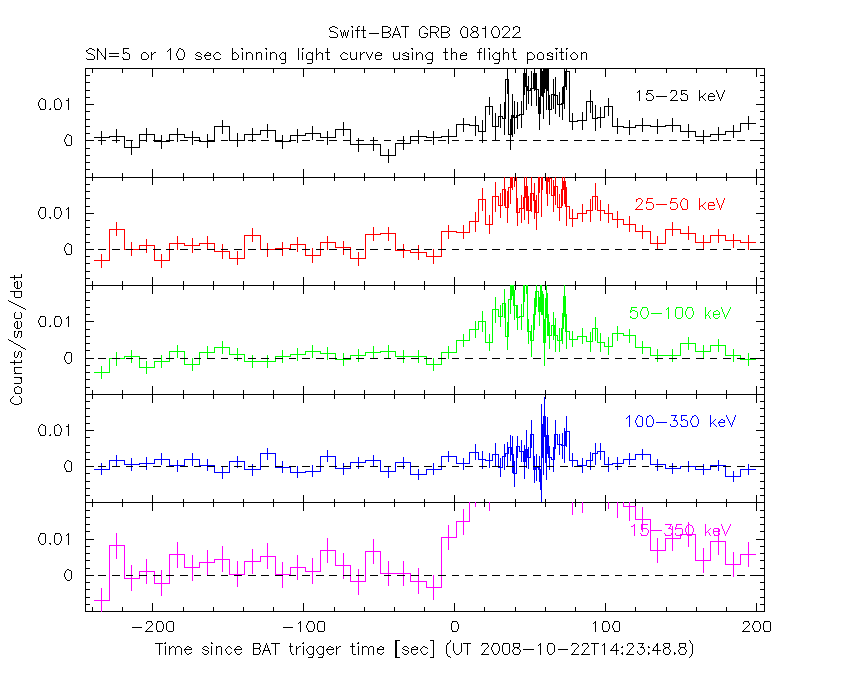
SN=5 or 10 sec. binning (T < 200 sec)
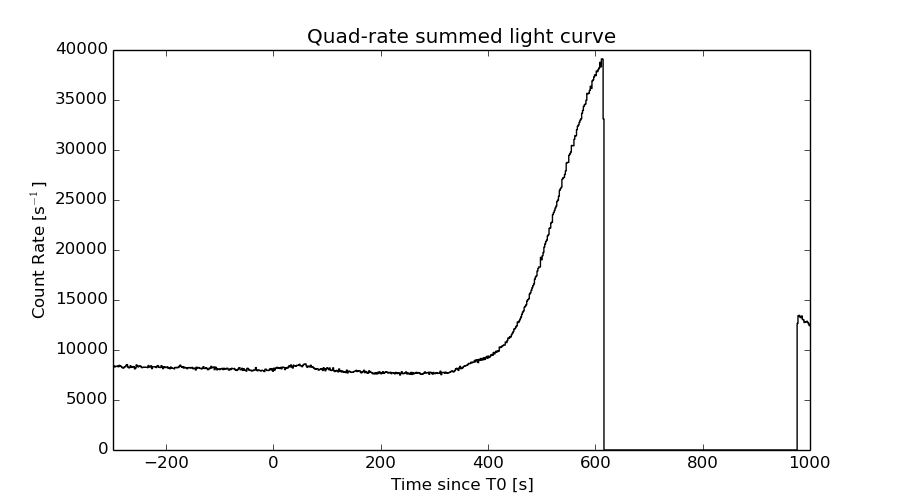
Quad-rate summed light curves (from T0-300s to T0+1000s)
Spectral Evolution
Spectra
Notes:
- 1) The fitting includes the systematic errors.
- 2) When the burst includes telescope slew time periods, the fitting uses an average response file made from multiple 5-s response files through out the slew time plus single time preiod for the non-slew times, and weighted by the total counts in the corresponding time period using addrmf. An average response file is needed becuase a spectral fit using the pre-slew DRM will introduce some errors in both a spectral shape and a normalization if the PHA file contains a lot of the slew/post-slew time interval.
- 3) For fits to more complicated models (e.g. a power-law over a cutoff power-law), the BAT team has decided to require a chi-square improvement of more than 6 for each extra dof.
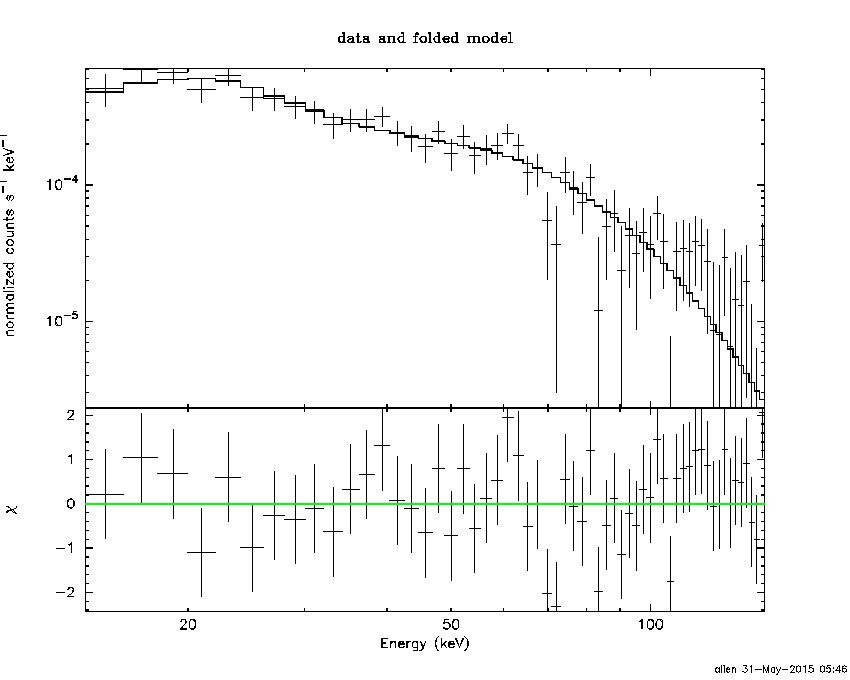
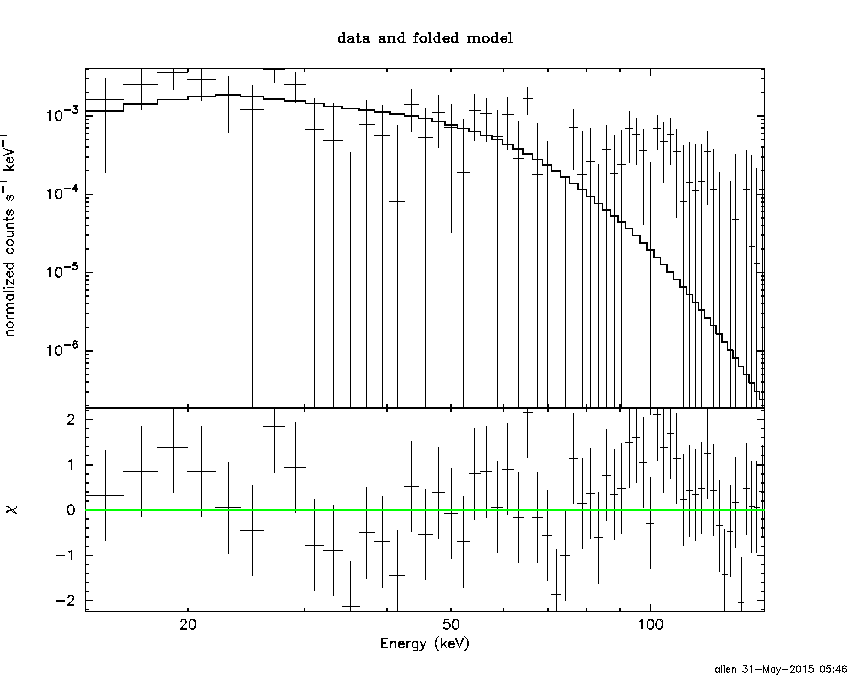
Time averaged spectrum fit using the average DRM
Power-law model
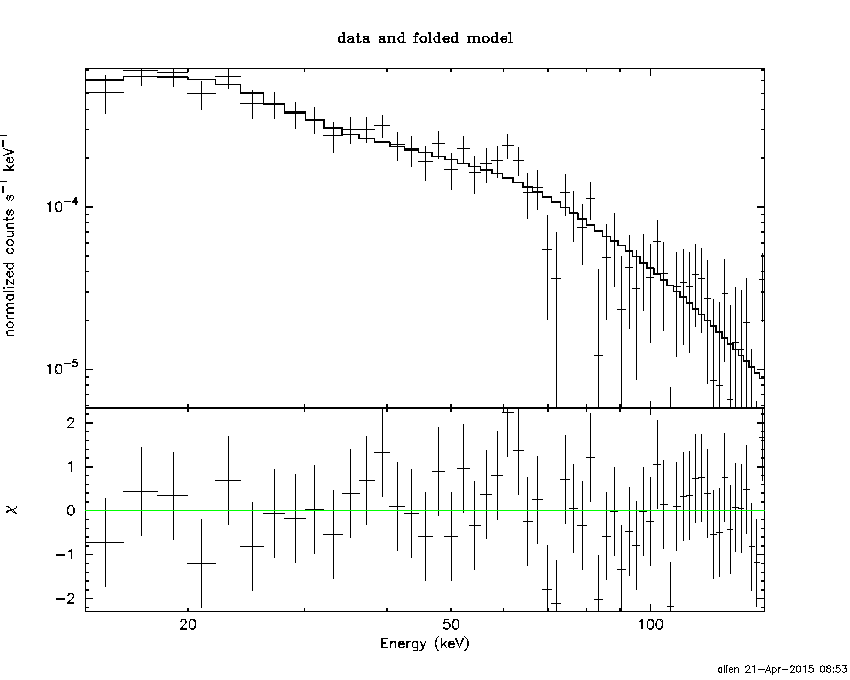
Time interval is from   -4.928 sec. to  213.820 sec.

Spectral model in power-law:
------------------------------------------------------------
Parameters  : value       lower 90%   higher 90%
Photon index: 1.61526     ( -0.1118   0.11299 )
Norm@50keV  : 1.26644E-03    ( -8.18131e-05   8.13239e-05 )
------------------------------------------------------------
#Fit statistic : Chi-Squared =          47.09 using 59 PHA bins.
# Reduced chi-squared =         0.8262 for     57 degrees of freedom
# Null hypothesis probability =   8.224058e-01

Photon flux (15-150 keV)    in 218.7 sec: 0.163522 ( -0.0102136  0.0102271 ) ph/cm2/s
Energy fluence (15-150 keV)             : 2.58558e-06 ( -1.79448e-07  1.80908e-07 ) ergs/cm2
Cutoff power-law model

Time interval is from   -4.928 sec. to  213.820 sec.
Spectral model in the cutoff power-law:
------------------------------------------------------------
Parameters  : value       lower 90%   higher 90%
Photon index: 1.30649     ( -0.494013   0.361636 )
Epeak [keV] : 108.297      ( -40.1691 -108.298 )
Norm@50keV  : 1.82965E-03    ( -0.00061789   0.00142592 )
------------------------------------------------------------
#Fit statistic : Chi-Squared =          45.70 using 59 PHA bins.
# Reduced chi-squared =         0.8161 for     56 degrees of freedom
# Null hypothesis probability =   8.354259e-01

Photon flux (15-150 keV)    in 218.7 sec: 0.160760 ( -0.010978  0.010924 ) ph/cm2/s
Energy fluence (15-150 keV)             : 2.51295e-06 ( -2.09077e-07  2.08858e-07 ) ergs/cm2
Band function

Time interval is from   -4.928 sec. to  213.820 sec.

Spectral model in the Band function:
------------------------------------------------------------
Parameters  : value       lower 90%   higher 90%
alpha       : -1.13761   ( 1.14203   6.02342 )
beta        : -1.89985    ( 1.89757   0.346544 )
Epeak [keV] : 82.1152      ( -82.1399 -82.1399 )
Norm@50keV   : 2.27669E-03    ( -0.00106801   0.0578829 )
------------------------------------------------------------
#Fit statistic : Chi-Squared =          45.27 using 59 PHA bins.
# Reduced chi-squared =         0.8231 for     55 degrees of freedom
# Null hypothesis probability =   8.222793e-01

Photon flux (15-150 keV)    in 218.7 sec:  (    ) ph/cm2/s
Energy fluence (15-150 keV)             : 2.5096e-06 ( 0  0 ) ergs/cm2
Single BB
Spectral model blackbody:
------------------------------------------------------------
Parameters  : value    Lower 90%  Upper 90%
kT [keV]    : 13.6712  (-1.02006  1.12464)
R^2/D10^2   : 2.46738E-02  (-0.00609172   0.0079768)
(R is the radius in km and D10 is the distance to the source in units of 10 kpc)
------------------------------------------------------------
#Fit statistic : Chi-Squared =          96.70 using 59 PHA bins.
# Reduced chi-squared =          1.696 for     57 degrees of freedom
# Null hypothesis probability =   8.070619e-04

Energy  Fluence     90% Error
[keV]   [erg/cm2]   [erg/cm2]
15- 25  2.135e-07   2.416e-08
25- 50  7.751e-07   6.277e-08
50-150  9.421e-07   1.198e-07
15-150  1.931e-06   1.410e-07
Thermal bremsstrahlung (OTTB)
Spectral model: thermal bremsstrahlung
------------------------------------------------------------
Parameters  : value         Lower 90%    Upper 90%
kT [keV]    : 164.860       (-44.6227      -165.129)
Norm        : 0.666700       (-0.0453043     0.0510536)
------------------------------------------------------------
#Fit statistic : Chi-Squared =          45.71 using 59 PHA bins.
# Reduced chi-squared =         0.8019 for     57 degrees of freedom
# Null hypothesis probability =   8.583395e-01

Energy  Fluence     90% Error
[keV]   [erg/cm2]   [erg/cm2]
15- 25  3.712e-07   3.095e-08
25- 50  6.972e-07   1.590e-07
50-150  1.429e-06   5.687e-07
15-150  2.498e-06   6.996e-07
Double BB
Spectral model: bbodyrad<1> + bbodyrad<2>
------------------------------------------------------------
Parameters  : value         Lower 90%    Upper 90%
kT1 [keV]   : 5.83320        (-1.68031      2.61874)
R1^2/D10^2  : 0.304935        (-0.206481      0.544247)
kT2 [keV]   : 20.7474        (-3.71357      10.4867)
R2^2/D10^2  : 4.52981E-03    (-0.00352447   0.00527746)
------------------------------------------------------------
#Fit statistic : Chi-Squared =          51.09 using 59 PHA bins.
# Reduced chi-squared =         0.9288 for     55 degrees of freedom
# Null hypothesis probability =   6.249474e-01

Energy  Fluence     90% Error
[keV]   [erg/cm2]   [erg/cm2]
15- 25  3.702e-07   1.544e-07
25- 50  6.842e-07   1.651e-07
50-150  1.346e-06   3.493e-07
15-150  2.400e-06   5.104e-07
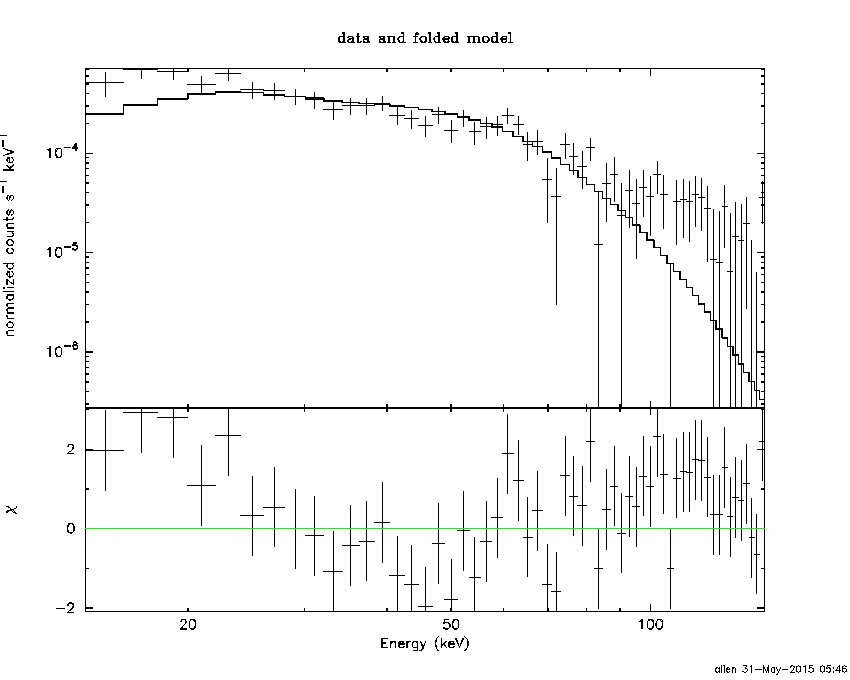
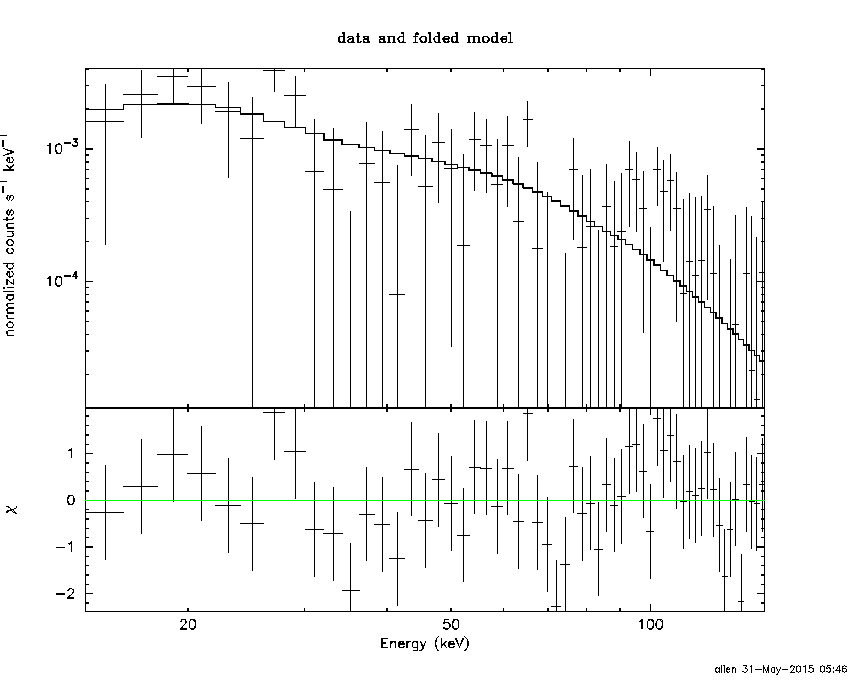
Peak spectrum fit
Power-law model
Time interval is from   57.176 sec. to   58.176 sec.

Spectral model in power-law:
------------------------------------------------------------
Parameters  : value       lower 90%   higher 90%
Photon index: 1.64854     ( -0.456172   0.492075 )
Norm@50keV  : 4.66442E-03    ( -0.00134078   0.00125408 )
------------------------------------------------------------
#Fit statistic : Chi-Squared =          48.39 using 59 PHA bins.
# Reduced chi-squared =         0.8490 for     57 degrees of freedom
# Null hypothesis probability =   7.844843e-01

Photon flux (15-150 keV)    in 1 sec: 0.608763 ( -0.146441  0.146471 ) ph/cm2/s
Energy fluence (15-150 keV)             : 4.33866e-08 ( -1.27389e-08  1.32042e-08 ) ergs/cm2
Cutoff power-law model
Time interval is from   57.176 sec. to   58.176 sec.
Spectral model in the cutoff power-law:
------------------------------------------------------------
Parameters  : value       lower 90%   higher 90%
Photon index: 2.30647     (     )
Epeak [keV] : 111.119      (   )
Norm@50keV  : 2.11222E-03    (     )
------------------------------------------------------------
#Fit statistic : Chi-Squared =          48.03 using 59 PHA bins.
# Reduced chi-squared =         0.8576 for     56 degrees of freedom
# Null hypothesis probability =   7.668424e-01

Photon flux (15-150 keV)    in 1 sec: 0.608810 ( -0.146241  0.146176 ) ph/cm2/s
Energy fluence (15-150 keV)             : 4.33024e-08 ( -6.3375e-09  1.29454e-08 ) ergs/cm2
Band function
Time interval is from   57.176 sec. to   58.176 sec.

Spectral model in the Band function:
------------------------------------------------------------
Parameters  : value       lower 90%   higher 90%
alpha       : 3.89221   ( 0.461612   0.461612 )
beta        : -1.69349    ( 1.66811   0.471579 )
Epeak [keV] : 20.4725      ( -26.454 447.335 )
Norm@50keV   : 246.075    ( -245.847   934733 )
------------------------------------------------------------
#Fit statistic : Chi-Squared =          48.25 using 59 PHA bins.
# Reduced chi-squared =         0.8773 for     55 degrees of freedom
# Null hypothesis probability =   7.282345e-01

Photon flux (15-150 keV)    in 1 sec:  (    ) ph/cm2/s
Energy fluence (15-150 keV)             : 0 ( 0  0 ) ergs/cm2
Single BB
Spectral model blackbody:
------------------------------------------------------------
Parameters  : value    Lower 90%  Upper 90%
kT [keV]    : 11.2170  (-4.55052  9.15111)
R^2/D10^2   : 0.176804  (-0.148779   1.00728)
(R is the radius in km and D10 is the distance to the source in units of 10 kpc)
------------------------------------------------------------
#Fit statistic : Chi-Squared =          58.27 using 59 PHA bins.
# Reduced chi-squared =          1.022 for     57 degrees of freedom
# Null hypothesis probability =   4.284424e-01

Energy  Fluence     90% Error
[keV]   [erg/cm2]   [erg/cm2]
15- 25  4.665e-09   2.900e-09
25- 50  1.352e-08   6.784e-09
50-150  9.754e-09   6.791e-09
15-150  2.794e-08   1.666e-08
Thermal bremsstrahlung (OTTB)
Spectral model: thermal bremsstrahlung
------------------------------------------------------------
Parameters  : value         Lower 90%    Upper 90%
kT [keV]    : 176.677       (-122.141      -178.752)
Norm        : 2.45932       (-0.606985     0.923804)
------------------------------------------------------------
#Fit statistic : Chi-Squared =          49.18 using 59 PHA bins.
# Reduced chi-squared =         0.8628 for     57 degrees of freedom
# Null hypothesis probability =   7.597928e-01

Energy  Fluence     90% Error
[keV]   [erg/cm2]   [erg/cm2]
15- 25  6.215e-09   3.791e-09
25- 50  1.178e-08   6.735e-09
50-150  2.478e-08   1.482e-08
15-150  4.277e-08   2.559e-08
Double BB
Spectral model: bbodyrad<1> + bbodyrad<2>
------------------------------------------------------------
Parameters  : value         Lower 90%    Upper 90%
kT1 [keV]   : 5.31514        (-1.85218      3.19558)
R1^2/D10^2  : 2.38194        (-1.95977      13.1953)
kT2 [keV]   : 33.2917        (-15.1025      111.332)
R2^2/D10^2  : 3.80263E-03    (-0.0036416   0.0225634)
------------------------------------------------------------
#Fit statistic : Chi-Squared =          46.57 using 59 PHA bins.
# Reduced chi-squared =         0.8468 for     55 degrees of freedom
# Null hypothesis probability =   7.835777e-01

Energy  Fluence     90% Error
[keV]   [erg/cm2]   [erg/cm2]
15- 25  7.969e-09   4.868e-09
25- 50  9.529e-09   5.155e-09
50-150  2.988e-08   1.817e-08
15-150  4.737e-08   2.568e-08
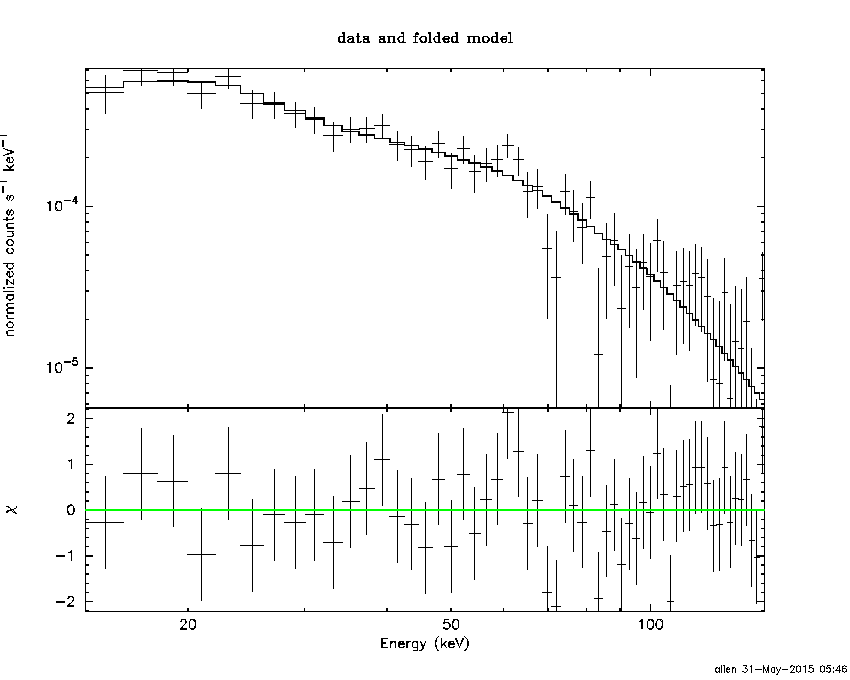
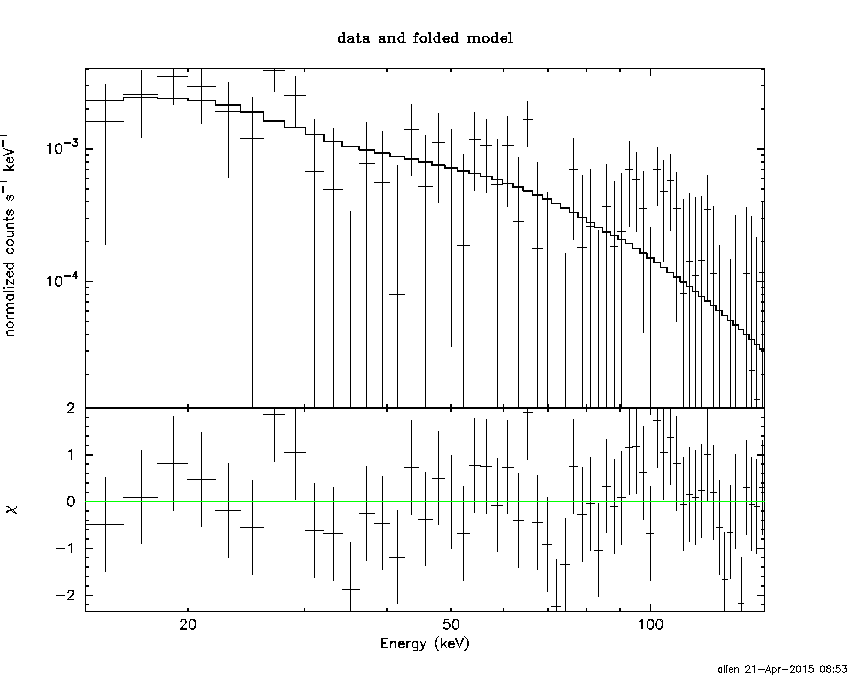
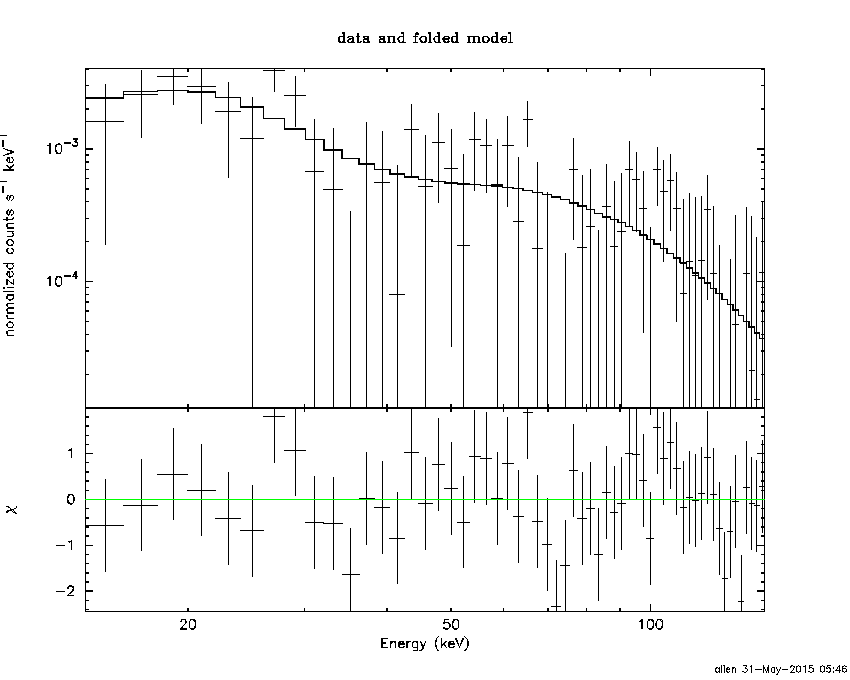
Pre-slew spectrum (Pre-slew PHA with pre-slew DRM)
Power-law model

Spectral model in power-law:
------------------------------------------------------------
Parameters  : value       lower 90%   higher 90%
Photon index: 1.61526     ( -0.1118   0.11299 )
Norm@50keV  : 1.26644E-03    ( -8.18131e-05   8.13239e-05 )
------------------------------------------------------------
#Fit statistic : Chi-Squared =          47.09 using 59 PHA bins.
# Reduced chi-squared =         0.8262 for     57 degrees of freedom
# Null hypothesis probability =   8.224058e-01

Photon flux (15-150 keV)    in 218.7 sec: 0.163522 ( -0.0102136  0.0102271 ) ph/cm2/s
Energy fluence (15-150 keV)             : 2.58558e-06 ( -1.79448e-07  1.80908e-07 ) ergs/cm2
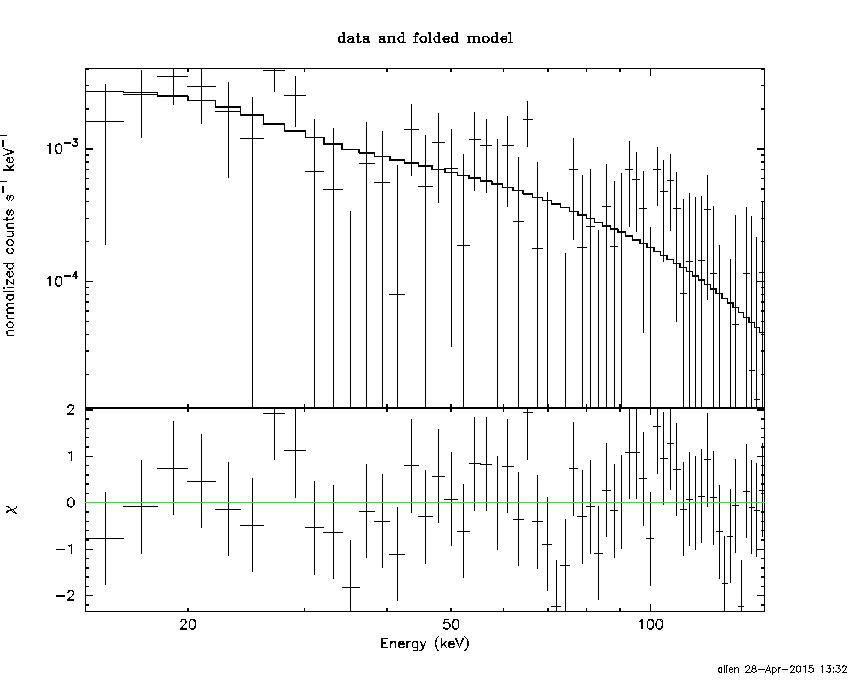
Cutoff power-law model

Spectral model in the cutoff power-law:
------------------------------------------------------------
Parameters  : value       lower 90%   higher 90%
Photon index: 1.30649     ( -0.494013   0.361636 )
Epeak [keV] : 108.297      ( -40.1691 -108.298 )
Norm@50keV  : 1.82965E-03    ( -0.00061789   0.00142592 )
------------------------------------------------------------
#Fit statistic : Chi-Squared =          45.70 using 59 PHA bins.
# Reduced chi-squared =         0.8161 for     56 degrees of freedom
# Null hypothesis probability =   8.354259e-01

Photon flux (15-150 keV)    in 218.7 sec: 0.160760 ( -0.010978  0.010924 ) ph/cm2/s
Energy fluence (15-150 keV)             : 2.51295e-06 ( -2.09077e-07  2.08858e-07 ) ergs/cm2
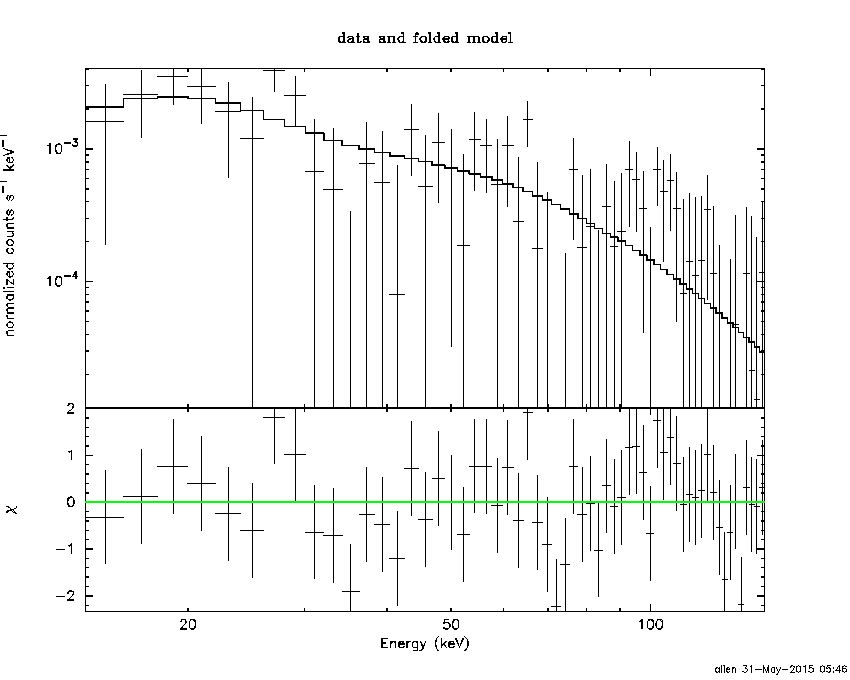
Band function
Spectral model in the Band function:
------------------------------------------------------------
Parameters  : value       lower 90%   higher 90%
alpha       : -1.13761   ( 1.14203   6.02342 )
beta        : -1.89985    ( 1.89757   0.346544 )
Epeak [keV] : 82.1152      ( -82.1399 -82.1399 )
Norm@50keV   : 2.27669E-03    ( -0.00106564   0.0512229 )
------------------------------------------------------------
#Fit statistic : Chi-Squared =          45.27 using 59 PHA bins.
# Reduced chi-squared =         0.8231 for     55 degrees of freedom
# Null hypothesis probability =   8.222793e-01

Photon flux (15-150 keV)    in 218.7 sec:  (    ) ph/cm2/s
Energy fluence (15-150 keV)             : 2.5096e-06 ( 0  0 ) ergs/cm2
S(25-50 keV) vs. S(50-100 keV) plot
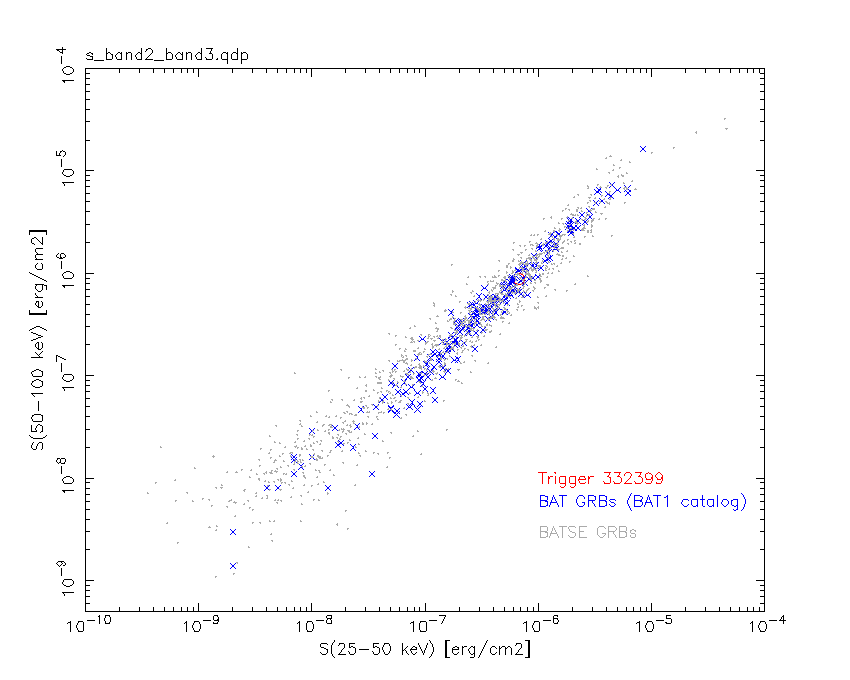
S(25-50 keV)  = 6.75e-07
S(50-100 keV) = 8.81e-07
T90 vs. Hardness ratio plot
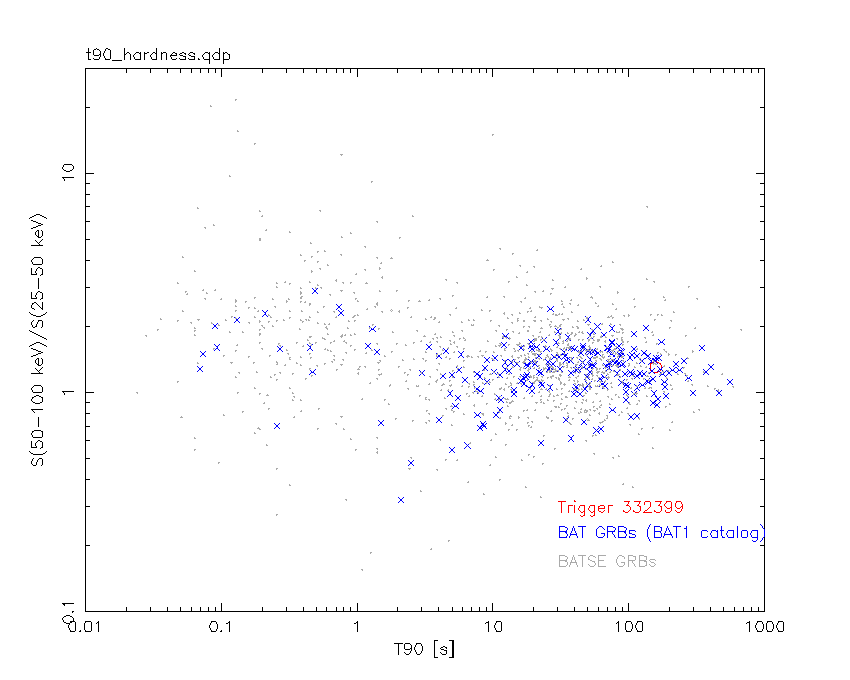
T90                                   = 157.580000013113 sec.
Hardness ratio (energy fluence ratio) = 1.30519
Color vs. Color plot
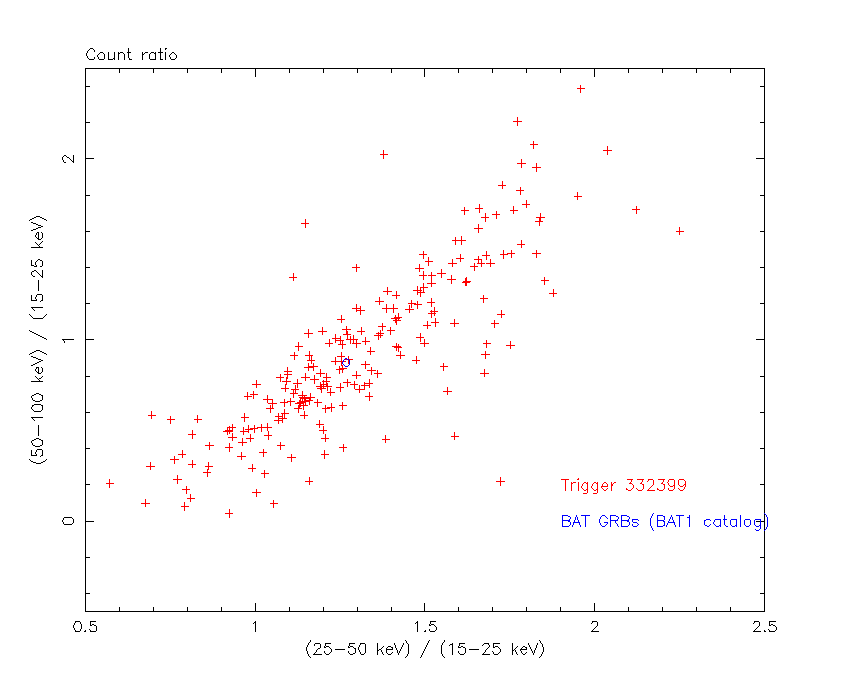
Count Ratio  (25-50 keV) / (15-25 keV) = 1.26803
Count Ratio (50-100 keV) / (15-25 keV) = 0.875418
Mask shadow pattern
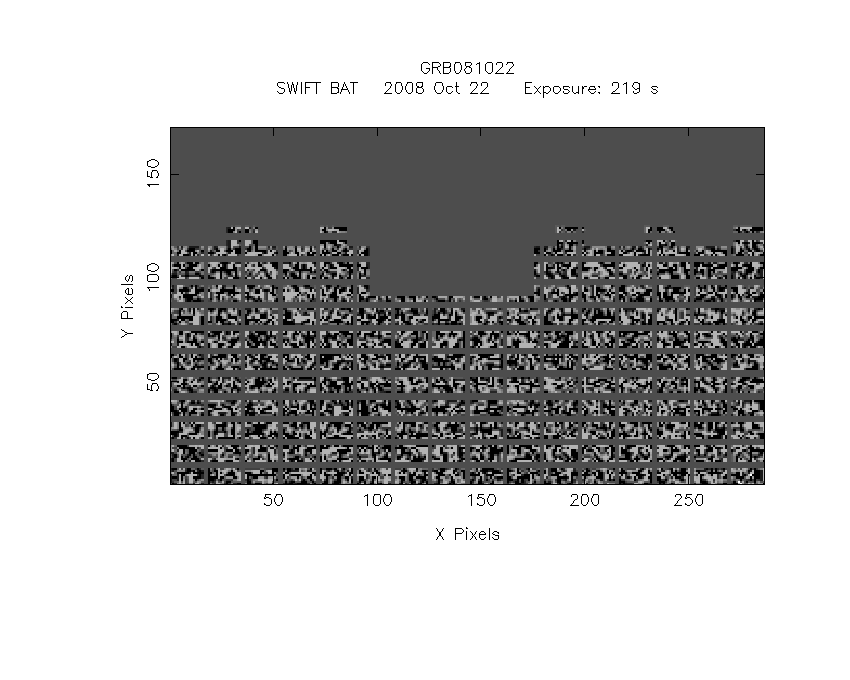
IMX = 3.074378814217653E-02, IMY = 4.259403152872967E-01
TIME vs. PHA plot around the trigger time
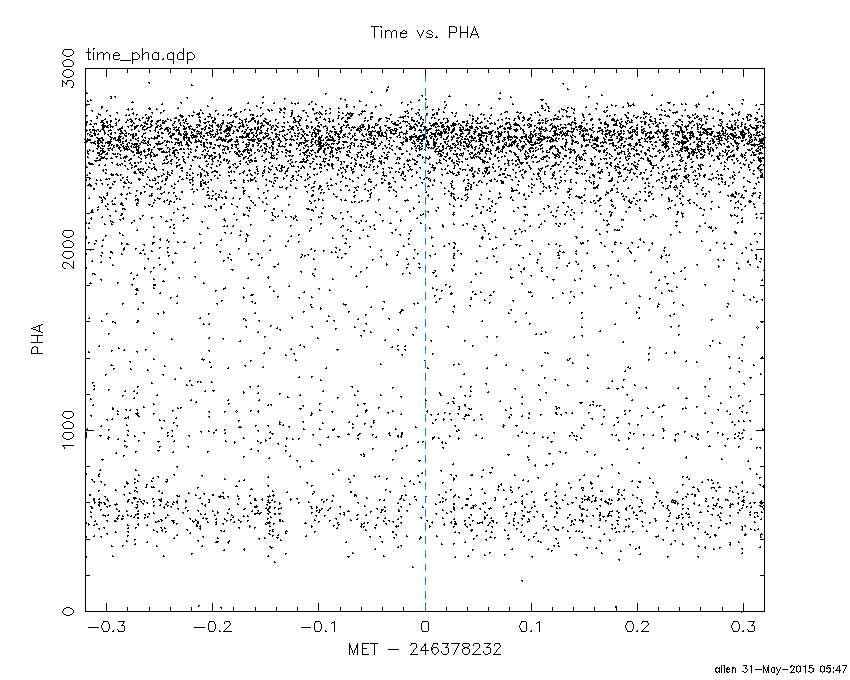
Blue+Cyan dotted lines: Time interval of the scaled map
From 0.000000 to 64.000000
TIME vs. DetID plot around the trigger time
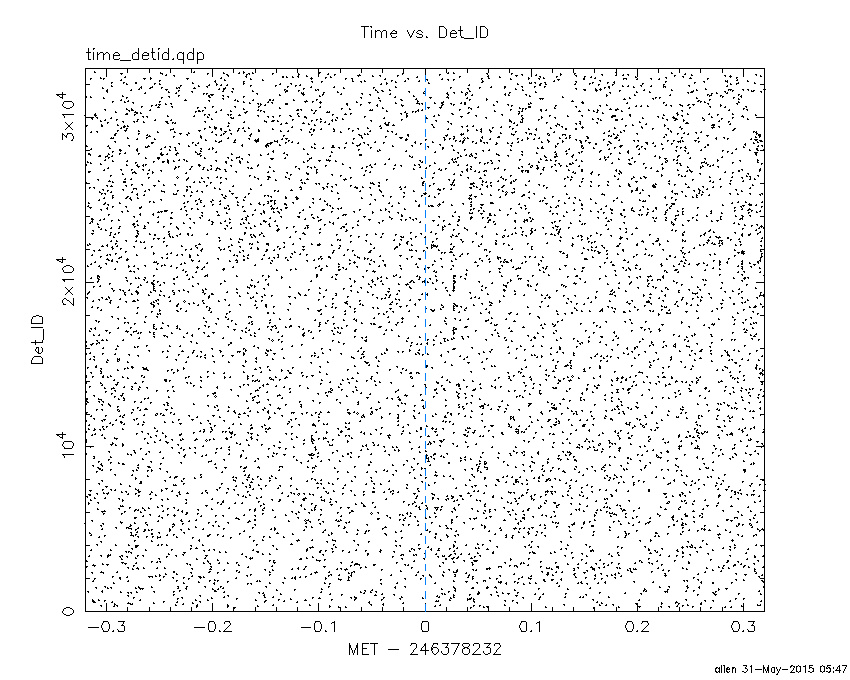
Blue+Cyan dotted lines: Time interval of the scaled map
From 0.000000 to 64.000000
100 us light curve (15-350 keV)
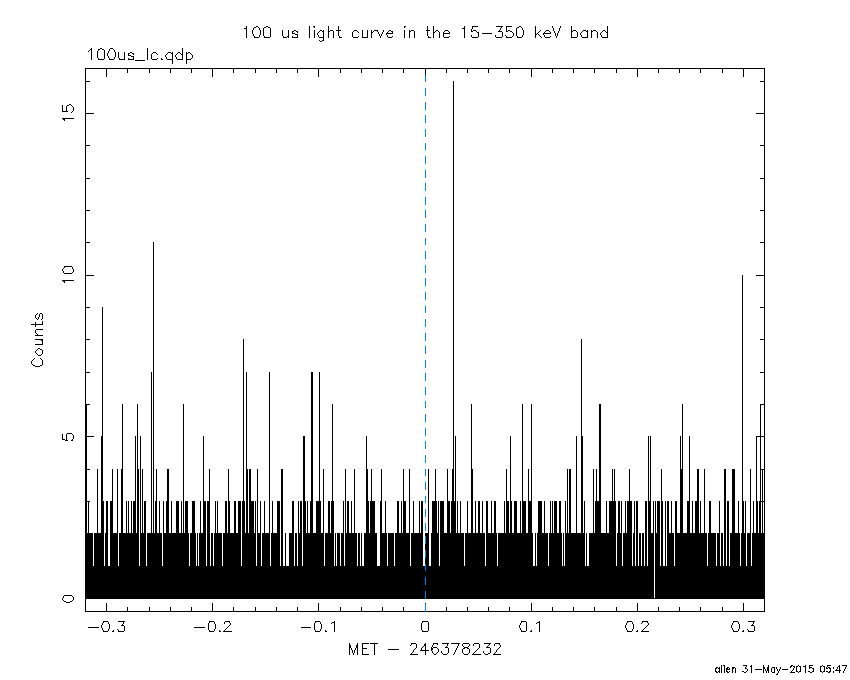
Blue+Cyan dotted lines: Time interval of the scaled map
From 0.000000 to 64.000000
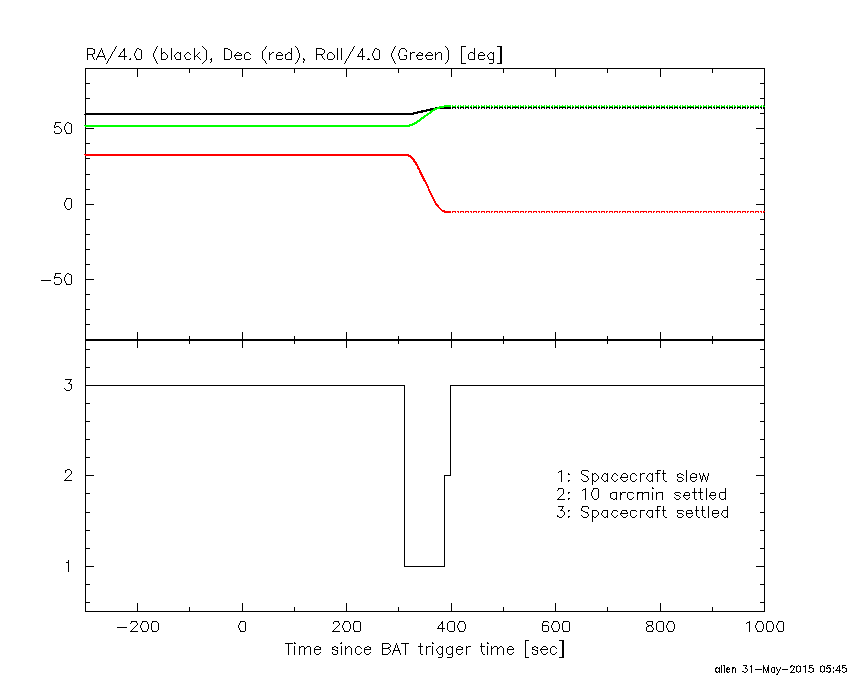
Spacecraft aspect plot
Bright source in the pre-burst/pre-slew/post-slew images
Pre-burst image of 15-350 keV band
Time interval of the image:
-239.000000 -4.928000

# RAcent  DECcent POSerr Theta    Phi  PeakCts   SNR AngSep     Name
#  [deg]    [deg]    ['] [deg]  [deg]                   [']
254.4365  35.3311    0.8  13.3  137.0   2.4235  14.4    1.2	Her X-1
268.3318  -1.5032    2.7  44.2 -162.5   1.3661   4.3    3.7	SW J1753.5-0127
274.1685 -13.9936    8.1  57.7 -159.1  -1.6262  -1.4    9.8	GX 17+2
288.7442  10.8634   70.3  50.8  166.3  -0.0989  -0.2    5.9	GRS 1915+105
284.7051  21.8525    2.1  42.0  155.7   1.9466   5.4 ------	UNKNOWN
270.6245  11.5894    2.2  36.1 -178.9   1.1152   5.2 ------	UNKNOWN
189.8893  20.0957    3.3  45.1  -30.9   1.0917   3.5 ------	UNKNOWN
Pre-slew background subtracted image of 15-350 keV band
Time interval of the image:
-4.928000 213.820000

# RAcent  DECcent POSerr Theta    Phi  PeakCts   SNR AngSep     Name
#  [deg]    [deg]    ['] [deg]  [deg]                   [']
254.2635  35.3752    9.6  13.2  136.7  -0.2186  -1.2    9.7	Her X-1
268.3361  -1.4648    7.4  44.2 -162.5  -0.5018  -1.5    2.0	SW J1753.5-0127
274.0313 -14.0164    7.7  57.7 -158.9   1.2994   1.5    1.9	GX 17+2
288.9270  10.9295   76.7  50.9  166.1   0.0910   0.1    7.6	GRS 1915+105
175.3205  64.6947    2.5  49.5   32.5   4.0203   4.6 ------	UNKNOWN
171.5065  63.3478    2.1  51.0   30.6   4.9131   5.4 ------	UNKNOWN
278.2835  -7.0579    1.7  54.8 -168.0   3.9482   6.9 ------	UNKNOWN
226.5815  12.4093    0.6  23.1  -85.9   4.0104  18.7 ------	UNKNOWN
191.9718  12.2390    2.4  47.3  -41.8   2.5460   4.8 ------	UNKNOWN
Post-slew image of 15-350 keV band
Time interval of the image:
387.200600 663.150000

# RAcent  DECcent POSerr Theta    Phi  PeakCts   SNR AngSep     Name
#  [deg]    [deg]    ['] [deg]  [deg]                   [']
244.9598 -15.6413    1.6  15.2 -124.5   6.6373   7.2    1.1	Sco X-1
254.3117  35.3435    5.9  40.3    8.7   2.5369   1.9    7.1	Her X-1
256.1691 -37.9051    7.8  32.9 -169.4  -1.4952  -1.5    9.4	4U 1700-377
256.5696 -36.3170    3.9  31.4 -170.0   2.8727   3.0    9.1	GX 349+2
263.1728 -24.8599   76.6  21.1  172.5   0.1356   0.2   11.3	GX 1+4
264.5339 -44.3370    7.0  40.1 -178.6   2.3245   1.7   11.2	4U 1735-44
268.2153  -1.4550    3.7  12.7   85.2   2.9489   3.1    9.2	SW J1753.5-0127
270.4344 -25.0524    4.6  24.4  157.8  -2.5066  -2.5    8.3	GX 5-1
270.2513 -25.7073   11.4  24.8  159.0   1.0471   1.0    3.5	GRS 1758-258
274.1200 -13.8552    0.0  19.9  128.6  -0.5582  -0.5   12.7	GX 17+2
275.8169 -30.5404    9.4  31.7  157.1   1.6433   1.2   11.8	H1820-303
285.0896 -24.9747  236.5  34.3  139.5   0.0824   0.0    4.4	HT1900.1-2455
288.7296  10.9669    5.8  36.3   74.7   5.4057   2.0    4.2	GRS 1915+105
262.9912 -33.8735    5.5  29.6  179.1   2.2347   2.1    2.3	GX 354-0
276.6422 -35.4850    2.8  36.0  161.6   5.8438   4.1 ------	UNKNOWN
245.9007  29.4777    3.3  35.8   -4.3   3.9302   3.5 ------	UNKNOWN
236.0319  47.4988    3.0  55.3   -5.4  11.6016   3.9 ------	UNKNOWN
215.7814 -16.8579    2.9  41.1  -99.2  14.6637   3.9 ------	UNKNOWN
Plot creation:
Sun May 31 05:47:45 EDT 2015