Click here for the BAT GCN circular template
Image
Pre-slew 15.0-350.0 keV image (Event data)
#   RAcent    DECcent   POSerr    Theta     Phi              Peak Cts       SNR   Name
   27.8894    61.3537   0.0130    19.4050    -7.6971         0.1934305     14.838 TRIG_00332516

Foreground time interval of the image:
 -1.656   0.268 (delta_t =   1.924 [sec])
Background time interval of the image:
-239.064  -1.656 (delta_t = 237.408 [sec])
Lightcurves
Notes:
- 1) The mask-weighted light curves are using the flight position.
- 2) Multiple plots of different time binning/intervals are shown to cover all scenarios of short/long GRBs, rate/image triggers, and real/false positives.
- 3) For all the mask-weighted lightcurves, the y-axis units are counts/sec/det where a det is 0.4 x 0.4 = 0.16 sq cm.
- 4) The verticle lines correspond to following: green dotted lines are T50 interval, black dotted lines are T90 interval, blue solid line(s) is a spacecraft slew start time, and orange solid line(s) is a spacecraft slew end time.
- 5) Time of each bin is in the middle of the bin.
1 s binning
From T0-310 s to T0+310 s

From T100_start - 20 s to T100_end + 30 s
Full time interval
64 ms binning
Full time interval

From T100_start to T100_end
From T0-5 sec to T0+5 sec
16 ms binning
From T100_start-5 s to T100_start+5 s

Blue+Cyan dotted lines: Time interval of the scaled map
From 0.000000 to 0.128000
8 ms binning
From T100_start-3 s to T100_start+3 s

Blue+Cyan dotted lines: Time interval of the scaled map
From 0.000000 to 0.128000
2 ms binning
From T100_start-1 s to T100_start+1 s

Blue+Cyan dotted lines: Time interval of the scaled map
From 0.000000 to 0.128000
SN=5 or 10 sec. binning (whichever binning is satisfied first)
SN=5 or 10 sec. binning (T < 200 sec)
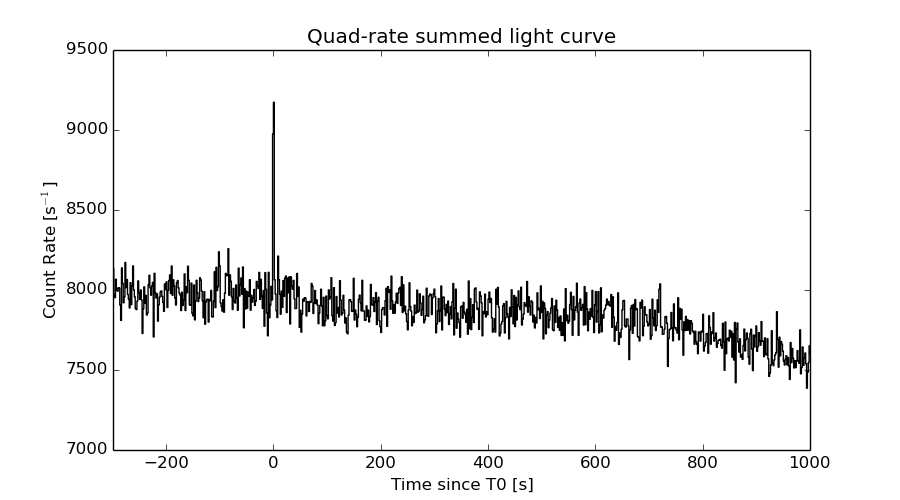
Quad-rate summed light curves (from T0-300s to T0+1000s)
Spectral Evolution

Spectra
Notes:
- 1) The fitting includes the systematic errors.
- 2) When the burst includes telescope slew time periods, the fitting uses an average response file made from multiple 5-s response files through out the slew time plus single time preiod for the non-slew times, and weighted by the total counts in the corresponding time period using addrmf. An average response file is needed becuase a spectral fit using the pre-slew DRM will introduce some errors in both a spectral shape and a normalization if the PHA file contains a lot of the slew/post-slew time interval.
- 3) For fits to more complicated models (e.g. a power-law over a cutoff power-law), the BAT team has decided to require a chi-square improvement of more than 6 for each extra dof.
Time averaged spectrum fit using the average DRM
Power-law model
Time interval is from   -1.656 sec. to    0.268 sec.

Spectral model in power-law:
------------------------------------------------------------
Parameters  : value       lower 90%   higher 90%
Photon index: 1.10608     ( -0.211978   0.205145 )
Norm@50keV  : 6.31680E-03    ( -0.000721074   0.000719764 )
------------------------------------------------------------
#Fit statistic : Chi-Squared =          81.60 using 59 PHA bins.
# Reduced chi-squared =          1.432 for     57 degrees of freedom
# Null hypothesis probability =   1.798267e-02

Photon flux (15-150 keV)    in 1.924 sec: 0.733143 ( -0.0859335  0.0861389 ) ph/cm2/s
Energy fluence (15-150 keV)             : 1.26824e-07 ( -1.60625e-08  1.61977e-08 ) ergs/cm2
Cutoff power-law model

Time interval is from   -1.656 sec. to    0.268 sec.
Spectral model in the cutoff power-law:
------------------------------------------------------------
Parameters  : value       lower 90%   higher 90%
Photon index: 1.10137     ( -0.213682   0.206388 )
Epeak [keV] : 9999.33      ( -9999.36 -9999.36 )
Norm@50keV  : 6.35024E-03    ( -0.00243716   0.00441701 )
------------------------------------------------------------
#Fit statistic : Chi-Squared =          81.62 using 59 PHA bins.
# Reduced chi-squared =          1.457 for     56 degrees of freedom
# Null hypothesis probability =   1.435461e-02

Photon flux (15-150 keV)    in 1.924 sec: 0.734174 (    ) ph/cm2/s
Energy fluence (15-150 keV)             : 1.26074e-07 ( -1.53579e-08  1.66774e-08 ) ergs/cm2
Band function

Time interval is from   -1.656 sec. to    0.268 sec.

Spectral model in the Band function:
------------------------------------------------------------
Parameters  : value       lower 90%   higher 90%
alpha       : 4.80876   ( -4.80876   -4.80876 )
beta        : -1.20255    ( -0.271315   0.242148 )
Epeak [keV] : 27.9408      ( -27.9408 6.96663 )
Norm@50keV   : 185.552    ( -21.0259   1.46644e+06 )
------------------------------------------------------------
#Fit statistic : Chi-Squared =          80.31 using 59 PHA bins.
# Reduced chi-squared =          1.460 for     55 degrees of freedom
# Null hypothesis probability =   1.462526e-02

Photon flux (15-150 keV)    in 1.924 sec:  (    ) ph/cm2/s
Energy fluence (15-150 keV)             : 0 ( 0  0 ) ergs/cm2
Single BB

Spectral model blackbody:
------------------------------------------------------------
Parameters  : value    Lower 90%  Upper 90%
kT [keV]    : 19.2170  (-3.18405  4.21498)
R^2/D10^2   : 3.79985E-02  (-0.0176683   0.0307358)
(R is the radius in km and D10 is the distance to the source in units of 10 kpc)
------------------------------------------------------------
#Fit statistic : Chi-Squared =         104.06 using 59 PHA bins.
# Reduced chi-squared =         1.8256 for     57 degrees of freedom
# Null hypothesis probability =   1.419207e-04

Energy  Fluence     90% Error
[keV]   [erg/cm2]   [erg/cm2]
15- 25  5.285e-09   1.382e-09
25- 50  2.562e-08   5.035e-09
50-150  6.969e-08   1.501e-08
15-150  1.006e-07   1.678e-08
Thermal bremsstrahlung (OTTB)

Spectral model: thermal bremsstrahlung
------------------------------------------------------------
Parameters  : value         Lower 90%    Upper 90%
kT [keV]    : 200.000       (      )
Norm        : 3.00658       (-0.353107     0.35309)
------------------------------------------------------------
#Fit statistic : Chi-Squared =          94.76 using 59 PHA bins.
# Reduced chi-squared =          1.662 for     57 degrees of freedom
# Null hypothesis probability =   1.248333e-03

Energy  Fluence     90% Error
[keV]   [erg/cm2]   [erg/cm2]
15- 25  1.440e-08   8.126e-09
25- 50  2.770e-08   1.534e-08
50-150  6.076e-08   3.363e-08
15-150  1.029e-07   5.636e-08
Double BB
Spectral model: bbodyrad<1> + bbodyrad<2>
------------------------------------------------------------
Parameters  : value         Lower 90%    Upper 90%
kT1 [keV]   : 9.84186        (-3.26668      2.66854)
R1^2/D10^2  : 0.253403        (-0.0989638      0.35281)
kT2 [keV]   : 75.4050        (-154.022      -196.847)
R2^2/D10^2  : 6.85231E-04    (-3.46301e-05   0.00259839)
------------------------------------------------------------
#Fit statistic : Chi-Squared =          78.60 using 59 PHA bins.
# Reduced chi-squared =          1.429 for     55 degrees of freedom
# Null hypothesis probability =   2.007483e-02

Energy  Fluence     90% Error
[keV]   [erg/cm2]   [erg/cm2]
15- 25  1.015e-08   5.186e-09
25- 50  2.780e-08   1.340e-08
50-150  8.842e-08   4.927e-08
15-150  1.264e-07   6.009e-08
Peak spectrum fit
Power-law model

Time interval is from   -0.732 sec. to    0.268 sec.

Spectral model in power-law:
------------------------------------------------------------
Parameters  : value       lower 90%   higher 90%
Photon index: 1.07705     ( -0.211809   0.205095 )
Norm@50keV  : 9.39096E-03    ( -0.00105845   0.00105556 )
------------------------------------------------------------
#Fit statistic : Chi-Squared =          66.32 using 59 PHA bins.
# Reduced chi-squared =          1.163 for     57 degrees of freedom
# Null hypothesis probability =   1.865151e-01

Photon flux (15-150 keV)    in 1 sec: 1.08699 ( -0.125263  0.125603 ) ph/cm2/s
Energy fluence (15-150 keV)             : 9.8915e-08 ( -1.24182e-08  1.25146e-08 ) ergs/cm2
Cutoff power-law model
Time interval is from   -0.732 sec. to    0.268 sec.
Spectral model in the cutoff power-law:
------------------------------------------------------------
Parameters  : value       lower 90%   higher 90%
Photon index: 1.06761     ( -0.280376   0.210739 )
Epeak [keV] : 9999.08      ( -9999.32 -9999.32 )
Norm@50keV  : 9.43989E-03    ( -0.00944049   0.00447682 )
------------------------------------------------------------
#Fit statistic : Chi-Squared =          66.35 using 59 PHA bins.
# Reduced chi-squared =          1.185 for     56 degrees of freedom
# Null hypothesis probability =   1.621497e-01

Photon flux (15-150 keV)    in 1 sec: 1.08939 ( -0.126531  0.12326 ) ph/cm2/s
Energy fluence (15-150 keV)             : 9.88188e-08 ( -1.22411e-08  1.29292e-08 ) ergs/cm2
Band function

Time interval is from   -0.732 sec. to    0.268 sec.

Spectral model in the Band function:
------------------------------------------------------------
Parameters  : value       lower 90%   higher 90%
alpha       : 1.51287   ( 0.746522   0.746522 )
beta        : -1.10799    ( 1.08698   0.219827 )
Epeak [keV] : 31.3130      ( -58.9588 727.611 )
Norm@50keV   : 0.958060    ( -0.957045   343.001 )
------------------------------------------------------------
#Fit statistic : Chi-Squared =          66.18 using 59 PHA bins.
# Reduced chi-squared =          1.203 for     55 degrees of freedom
# Null hypothesis probability =   1.437850e-01

Photon flux (15-150 keV)    in 1 sec:  (    ) ph/cm2/s
Energy fluence (15-150 keV)             : 0 ( 0  0 ) ergs/cm2
Single BB
Spectral model blackbody:
------------------------------------------------------------
Parameters  : value    Lower 90%  Upper 90%
kT [keV]    : 20.1511  (-3.49738  4.68271)
R^2/D10^2   : 4.84997E-02  (-0.0230871   0.0410917)
(R is the radius in km and D10 is the distance to the source in units of 10 kpc)
------------------------------------------------------------
#Fit statistic : Chi-Squared =          92.89 using 59 PHA bins.
# Reduced chi-squared =          1.630 for     57 degrees of freedom
# Null hypothesis probability =   1.879021e-03

Energy  Fluence     90% Error
[keV]   [erg/cm2]   [erg/cm2]
15- 25  3.785e-09   8.845e-10
25- 50  1.895e-08   3.375e-09
50-150  5.710e-08   1.146e-08
15-150  7.983e-08   1.452e-08
Thermal bremsstrahlung (OTTB)
Spectral model: thermal bremsstrahlung
------------------------------------------------------------
Parameters  : value         Lower 90%    Upper 90%
kT [keV]    : 200.000       (      )
Norm        : 4.42722       (-0.514866     0.514846)
------------------------------------------------------------
#Fit statistic : Chi-Squared =          81.79 using 59 PHA bins.
# Reduced chi-squared =          1.435 for     57 degrees of freedom
# Null hypothesis probability =   1.734833e-02

Energy  Fluence     90% Error
[keV]   [erg/cm2]   [erg/cm2]
15- 25  1.103e-08   6.110e-09
25- 50  2.121e-08   1.170e-08
50-150  4.652e-08   2.582e-08
15-150  7.875e-08   4.342e-08
Double BB

------------------------------------------------------------
Parameters  : value         Lower 90%    Upper 90%
kT1 [keV]   : 10.5119        (-2.29275      2.38291)
R1^2/D10^2  : 0.315303        (-0.193037      0.327533)
kT2 [keV]   : 199.318        (      )
R2^2/D10^2  : 2.30247E-04    (-4.77945e-05   0.00298956)
------------------------------------------------------------
#Fit statistic : Chi-Squared =          62.48 using 59 PHA bins.
#Fit statistic : Chi-Squared =          61.71 using 59 PHA bins.
# Reduced chi-squared =          1.136 for     55 degrees of freedom
# Reduced chi-squared =          1.122 for     55 degrees of freedom
# Null hypothesis probability =   2.278568e-01
# Null hypothesis probability =   2.486821e-01

Energy  Fluence     90% Error
[keV]   [erg/cm2]   [erg/cm2]
15- 25  7.803e-09   3.202e-09
25- 50  2.108e-08   9.104e-09
50-150  7.054e-08   4.084e-08
15-150  9.942e-08   5.095e-08
Pre-slew spectrum (Pre-slew PHA with pre-slew DRM)
Power-law model
Spectral model in power-law:
------------------------------------------------------------
Parameters  : value       lower 90%   higher 90%
Photon index: 1.10608     ( -0.211978   0.205145 )
Norm@50keV  : 6.31680E-03    ( -0.000721074   0.000719764 )
------------------------------------------------------------
#Fit statistic : Chi-Squared =          81.60 using 59 PHA bins.
# Reduced chi-squared =          1.432 for     57 degrees of freedom
# Null hypothesis probability =   1.798267e-02

Photon flux (15-150 keV)    in 1.924 sec: 0.733143 ( -0.0859335  0.0861389 ) ph/cm2/s
Energy fluence (15-150 keV)             : 1.26824e-07 ( -1.60625e-08  1.61977e-08 ) ergs/cm2
Cutoff power-law model

Spectral model in the cutoff power-law:
------------------------------------------------------------
Parameters  : value       lower 90%   higher 90%
Photon index: 1.10137     ( -0.213682   0.206388 )
Epeak [keV] : 9999.33      ( -9999.36 -9999.36 )
Norm@50keV  : 6.35024E-03    ( -0.00243716   0.00441701 )
------------------------------------------------------------
#Fit statistic : Chi-Squared =          81.62 using 59 PHA bins.
# Reduced chi-squared =          1.457 for     56 degrees of freedom
# Null hypothesis probability =   1.435461e-02

Photon flux (15-150 keV)    in 1.924 sec: 0.734174 (    ) ph/cm2/s
Energy fluence (15-150 keV)             : 1.26074e-07 ( -1.53579e-08  1.66774e-08 ) ergs/cm2
Band function
Spectral model in the Band function:
------------------------------------------------------------
Parameters  : value       lower 90%   higher 90%
alpha       : 4.80876   ( -4.80876   -4.80876 )
beta        : -1.20255    ( -0.271315   0.242148 )
Epeak [keV] : 27.9408      ( -27.9408 6.96663 )
Norm@50keV   : 185.552    ( -21.0259   1.46644e+06 )
------------------------------------------------------------
#Fit statistic : Chi-Squared =          80.31 using 59 PHA bins.
# Reduced chi-squared =          1.460 for     55 degrees of freedom
# Null hypothesis probability =   1.462526e-02

Photon flux (15-150 keV)    in 1.924 sec:  (    ) ph/cm2/s
Energy fluence (15-150 keV)             : 0 ( 0  0 ) ergs/cm2
S(25-50 keV) vs. S(50-100 keV) plot
S(25-50 keV)  = 2.51e-08
S(50-100 keV) = 4.67e-08
T90 vs. Hardness ratio plot
T90                                   = 1.82400000095367 sec.
Hardness ratio (energy fluence ratio) = 1.86056
Color vs. Color plot

Count Ratio  (25-50 keV) / (15-25 keV) = 1.67848
Count Ratio (50-100 keV) / (15-25 keV) = 1.42862
Mask shadow pattern
IMX = 3.490792835708678E-01, IMY = 4.717955129490216E-02
TIME vs. PHA plot around the trigger time

Blue+Cyan dotted lines: Time interval of the scaled map
From 0.000000 to 0.128000
TIME vs. DetID plot around the trigger time
Blue+Cyan dotted lines: Time interval of the scaled map
From 0.000000 to 0.128000
100 us light curve (15-350 keV)

Blue+Cyan dotted lines: Time interval of the scaled map
From 0.000000 to 0.128000
Spacecraft aspect plot
Bright source in the pre-burst/pre-slew/post-slew images
Pre-burst image of 15-350 keV band
Time interval of the image:
-239.064000 -1.656000

# RAcent  DECcent POSerr Theta    Phi  PeakCts   SNR AngSep     Name
#  [deg]    [deg]    ['] [deg]  [deg]                   [']
299.5924  35.1990    0.4  43.4 -145.1   9.6949  30.4    0.2	Cyg X-1
308.1368  40.9505    4.3  34.6 -144.4   0.5788   2.7    1.2	Cyg X-3
326.1262  38.3321    3.0  25.2 -165.9   0.6565   3.9    2.2	Cyg X-2
327.6488   3.5298    3.0  54.0  161.1   4.0275   3.9 ------	UNKNOWN
 72.0904  41.4136    3.5  50.4   14.4   1.7854   3.4 ------	UNKNOWN
 53.7233  53.1844    1.7  33.8    8.6   1.4054   6.8 ------	UNKNOWN
 95.7514  52.3387    3.0  55.8   -9.0   2.3276   3.8 ------	UNKNOWN
315.7480  48.3460    2.8  26.2 -136.9   0.7980   4.2 ------	UNKNOWN
Pre-slew background subtracted image of 15-350 keV band
Time interval of the image:
-1.656000 0.268000

# RAcent  DECcent POSerr Theta    Phi  PeakCts   SNR AngSep     Name
#  [deg]    [deg]    ['] [deg]  [deg]                   [']
299.7502  35.2635   84.3  43.2 -145.1  -0.0035  -0.1    8.7	Cyg X-1
307.9284  40.9520   21.9  34.7 -144.3   0.0092   0.5    8.2	Cyg X-3
326.1786  38.2239    4.3  25.2 -166.1   0.0362   2.7    5.9	Cyg X-2
333.1788  18.4963    2.1  38.1  162.1   0.1143   5.6 ------	UNKNOWN
 27.8894  61.3538    0.8  19.4   -7.7   0.1934  14.8 ------	UNKNOWN
355.3607  64.7256    2.2  13.0  -58.6   0.0675   5.2 ------	UNKNOWN
309.1709  50.1869    2.6  29.5 -129.7   0.0746   4.4 ------	UNKNOWN
Post-slew image of 15-350 keV band
Time interval of the image:
56.436600 963.021000

# RAcent  DECcent POSerr Theta    Phi  PeakCts   SNR AngSep     Name
#  [deg]    [deg]    ['] [deg]  [deg]                   [']
299.5936  35.1914    1.9  58.9 -161.0  23.8417   6.1    0.6	Cyg X-1
308.1764  40.8773    3.4  50.3 -163.6   3.7345   3.4    5.4	Cyg X-3
326.2125  38.4592   10.3  43.6  179.4   0.8184   1.1    8.5	Cyg X-2
  9.0760  42.8395    2.8  21.6  131.6   1.9246   4.1 ------	UNKNOWN
 53.7801  53.1745    0.9  16.0   20.5   5.6836  13.6 ------	UNKNOWN
345.1585  56.4311    2.9  22.2 -171.8   1.6396   3.9 ------	UNKNOWN
262.2471  70.1089    3.5  43.1 -112.2   7.9066   3.3 ------	UNKNOWN
Plot creation:
Sun May 31 05:45:41 EDT 2015