Click here for the BAT GCN circular template
Image
Pre-slew 15.0-350.0 keV image (Event data)
#   RAcent    DECcent   POSerr    Theta     Phi              Peak Cts       SNR   Name
  121.8896     2.3054   0.0079    21.2145    25.4649         2.8584905     24.402 TRIG_00332851

Foreground time interval of the image:
 29.344 136.701 (delta_t = 107.357 [sec])
Background time interval of the image:
-322.899 -289.900 (delta_t =  32.999 [sec])
-239.000  29.344 (delta_t = 268.344 [sec])
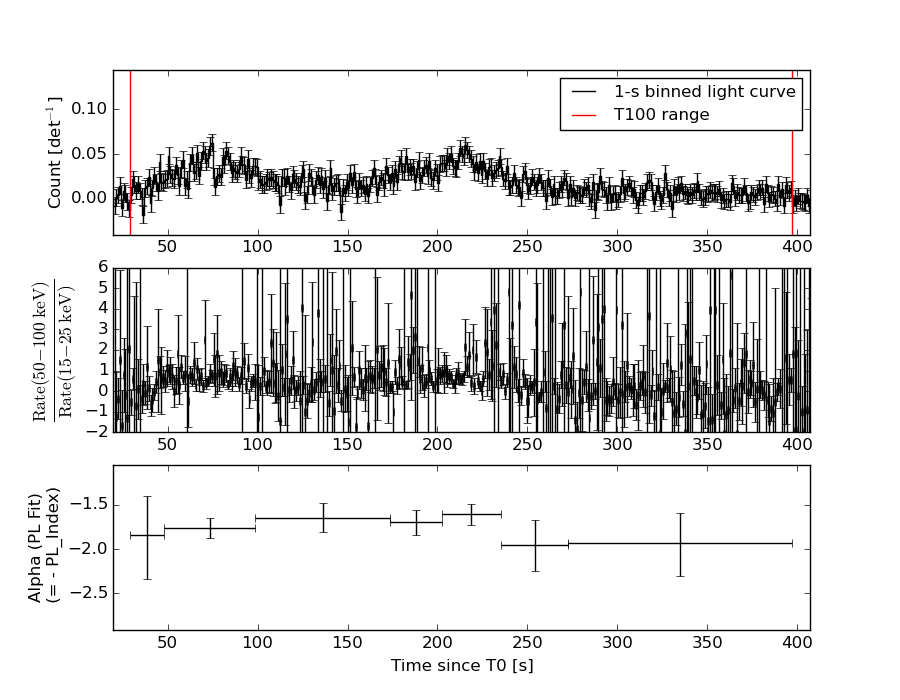
Lightcurves
Notes:
- 1) The mask-weighted light curves are using the flight position.
- 2) Multiple plots of different time binning/intervals are shown to cover all scenarios of short/long GRBs, rate/image triggers, and real/false positives.
- 3) For all the mask-weighted lightcurves, the y-axis units are counts/sec/det where a det is 0.4 x 0.4 = 0.16 sq cm.
- 4) The verticle lines correspond to following: green dotted lines are T50 interval, black dotted lines are T90 interval, blue solid line(s) is a spacecraft slew start time, and orange solid line(s) is a spacecraft slew end time.
- 5) Time of each bin is in the middle of the bin.
1 s binning
From T0-310 s to T0+310 s

From T100_start - 20 s to T100_end + 30 s
Full time interval

64 ms binning
Full time interval

From T100_start to T100_end

From T0-5 sec to T0+5 sec

16 ms binning
From T100_start-5 s to T100_start+5 s
Blue+Cyan dotted lines: Time interval of the scaled map
From 0.000000 to 128.000000
8 ms binning
From T100_start-3 s to T100_start+3 s

Blue+Cyan dotted lines: Time interval of the scaled map
From 0.000000 to 128.000000
2 ms binning
From T100_start-1 s to T100_start+1 s
Blue+Cyan dotted lines: Time interval of the scaled map
From 0.000000 to 128.000000
SN=5 or 10 sec. binning (whichever binning is satisfied first)

SN=5 or 10 sec. binning (T < 200 sec)
Quad-rate summed light curves (from T0-300s to T0+1000s)

Spectral Evolution
Spectra
Notes:
- 1) The fitting includes the systematic errors.
- 2) When the burst includes telescope slew time periods, the fitting uses an average response file made from multiple 5-s response files through out the slew time plus single time preiod for the non-slew times, and weighted by the total counts in the corresponding time period using addrmf. An average response file is needed becuase a spectral fit using the pre-slew DRM will introduce some errors in both a spectral shape and a normalization if the PHA file contains a lot of the slew/post-slew time interval.
- 3) For fits to more complicated models (e.g. a power-law over a cutoff power-law), the BAT team has decided to require a chi-square improvement of more than 6 for each extra dof.
Time averaged spectrum fit using the average DRM
Power-law model

Time interval is from   29.344 sec. to  397.088 sec.

Spectral model in power-law:
------------------------------------------------------------
Parameters  : value       lower 90%   higher 90%
Photon index: 1.77359     ( -0.0822206   0.0831377 )
Norm@50keV  : 1.16445E-03    ( -5.4578e-05   5.42465e-05 )
------------------------------------------------------------
#Fit statistic : Chi-Squared =          42.82 using 59 PHA bins.
# Reduced chi-squared =         0.7512 for     57 degrees of freedom
# Null hypothesis probability =   9.183052e-01

Photon flux (15-150 keV)    in 367.7 sec: 0.158846 ( -0.00700696  0.00701895 ) ph/cm2/s
Energy fluence (15-150 keV)             : 3.94605e-06 ( -1.90523e-07  1.91837e-07 ) ergs/cm2
Cutoff power-law model

Time interval is from   29.344 sec. to  397.088 sec.
Spectral model in the cutoff power-law:
------------------------------------------------------------
Parameters  : value       lower 90%   higher 90%
Photon index: 1.40442     ( -0.3433   0.317032 )
Epeak [keV] : 75.2477      ( -17.1073 142.59 )
Norm@50keV  : 1.82029E-03    ( -0.000566538   0.000917085 )
------------------------------------------------------------
#Fit statistic : Chi-Squared =          38.80 using 59 PHA bins.
# Reduced chi-squared =         0.6929 for     56 degrees of freedom
# Null hypothesis probability =   9.612124e-01

Photon flux (15-150 keV)    in 367.7 sec: 0.155045 ( -0.007674  0.007679 ) ph/cm2/s
Energy fluence (15-150 keV)             : 3.79724e-06 ( -2.27397e-07  2.28856e-07 ) ergs/cm2
Band function

Time interval is from   29.344 sec. to  397.088 sec.

Spectral model in the Band function:
------------------------------------------------------------
Parameters  : value       lower 90%   higher 90%
alpha       : -1.40437   ( -0.311738   0.176367 )
beta        : -10.0000    ( 10   5.32907e-15 )
Epeak [keV] : 75.2313      ( -15 143.052 )
Norm@50keV   : 1.82011E-03    ( -0.000566306   0.000918015 )
------------------------------------------------------------
#Fit statistic : Chi-Squared =          38.80 using 59 PHA bins.
# Reduced chi-squared =         0.7055 for     55 degrees of freedom
# Null hypothesis probability =   9.519319e-01

Photon flux (15-150 keV)    in 367.7 sec: 0.155910 (    ) ph/cm2/s
Energy fluence (15-150 keV)             : 3.84772e-06 ( 0  0 ) ergs/cm2
Single BB

Spectral model blackbody:
------------------------------------------------------------
Parameters  : value    Lower 90%  Upper 90%
kT [keV]    : 12.2720  (  )
R^2/D10^2   : 3.36163E-02  (   )
(R is the radius in km and D10 is the distance to the source in units of 10 kpc)
------------------------------------------------------------
#Fit statistic : Chi-Squared =         148.12 using 59 PHA bins.
# Reduced chi-squared =         2.5986 for     57 degrees of freedom
# Null hypothesis probability =   4.873657e-10

Energy  Fluence     90% Error
[keV]   [erg/cm2]   [erg/cm2]
15- 25  3.943e-07   3.225e-08
25- 50  1.274e-06   6.747e-08
50-150  1.171e-06   1.158e-07
15-150  2.839e-06   1.430e-07
Thermal bremsstrahlung (OTTB)

Spectral model: thermal bremsstrahlung
------------------------------------------------------------
Parameters  : value         Lower 90%    Upper 90%
kT [keV]    : 110.899       (-19.3034      23.9805)
Norm        : 0.676805       (-0.0398292     0.0473342)
------------------------------------------------------------
#Fit statistic : Chi-Squared =          39.09 using 59 PHA bins.
# Reduced chi-squared =         0.6858 for     57 degrees of freedom
# Null hypothesis probability =   9.663971e-01

Energy  Fluence     90% Error
[keV]   [erg/cm2]   [erg/cm2]
15- 25  6.498e-07   5.240e-08
25- 50  1.146e-06   6.711e-08
50-150  1.965e-06   5.297e-07
15-150  3.761e-06   5.622e-07
Double BB

Spectral model: bbodyrad<1> + bbodyrad<2>
------------------------------------------------------------
Parameters  : value         Lower 90%    Upper 90%
kT1 [keV]   : 6.42858        (-0.874807      0.938933)
R1^2/D10^2  : 0.247417        (-0.0926667      0.172925)
kT2 [keV]   : 22.3930        (-3.08479      4.40589)
R2^2/D10^2  : 2.80661E-03    (-0.00138696   0.00221804)
------------------------------------------------------------
#Fit statistic : Chi-Squared =          37.96 using 59 PHA bins.
# Reduced chi-squared =         0.6902 for     55 degrees of freedom
# Null hypothesis probability =   9.612689e-01

Energy  Fluence     90% Error
[keV]   [erg/cm2]   [erg/cm2]
15- 25  6.430e-07   9.579e-08
25- 50  1.140e-06   1.316e-07
50-150  1.978e-06   4.127e-07
15-150  3.761e-06   5.541e-07
Peak spectrum fit
Power-law model

Time interval is from   73.724 sec. to   74.724 sec.

Spectral model in power-law:
------------------------------------------------------------
Parameters  : value       lower 90%   higher 90%
Photon index: 1.63905     ( -0.373457   0.39631 )
Norm@50keV  : 4.39141E-03    ( -0.00106469   0.00103003 )
------------------------------------------------------------
#Fit statistic : Chi-Squared =          39.79 using 59 PHA bins.
# Reduced chi-squared =         0.6981 for     57 degrees of freedom
# Null hypothesis probability =   9.595813e-01

Photon flux (15-150 keV)    in 1 sec: 0.571356 ( -0.122334  0.122387 ) ph/cm2/s
Energy fluence (15-150 keV)             : 4.08879e-08 ( -1.03114e-08  1.06743e-08 ) ergs/cm2
Cutoff power-law model

Time interval is from   73.724 sec. to   74.724 sec.
Spectral model in the cutoff power-law:
------------------------------------------------------------
Parameters  : value       lower 90%   higher 90%
Photon index: 0.889333     ( -2.4357   1.31994 )
Epeak [keV] : 68.3716      ( -60.3597 -68.3628 )
Norm@50keV  : 1.11279E-02    ( -0.0111331   0.198377 )
------------------------------------------------------------
#Fit statistic : Chi-Squared =          39.21 using 59 PHA bins.
# Reduced chi-squared =         0.7002 for     56 degrees of freedom
# Null hypothesis probability =   9.568399e-01

Photon flux (15-150 keV)    in 1 sec: 0.555010 ( -0.12935  0.127706 ) ph/cm2/s
Energy fluence (15-150 keV)             : 3.8294e-08 ( -1.08853e-08  1.18264e-08 ) ergs/cm2
Band function

Time interval is from   73.724 sec. to   74.724 sec.

Spectral model in the Band function:
------------------------------------------------------------
Parameters  : value       lower 90%   higher 90%
alpha       : -0.960452   ( -3.25307   1.49029 )
beta        : -9.10235    ( 8.91454   18.9145 )
Epeak [keV] : 72.0467      ( -31.7525 -72.0467 )
Norm@50keV   : 1.00798E-02    ( -0.00214114   0.00444417 )
------------------------------------------------------------
#Fit statistic : Chi-Squared =          39.22 using 59 PHA bins.
# Reduced chi-squared =         0.7131 for     55 degrees of freedom
# Null hypothesis probability =   9.466634e-01

Photon flux (15-150 keV)    in 1 sec:  (    ) ph/cm2/s
Energy fluence (15-150 keV)             : 0 ( 0  0 ) ergs/cm2
Single BB

Spectral model blackbody:
------------------------------------------------------------
Parameters  : value    Lower 90%  Upper 90%
kT [keV]    : 13.1914  (-2.76941  3.67301)
R^2/D10^2   : 0.102651  (-0.0607007   0.136731)
(R is the radius in km and D10 is the distance to the source in units of 10 kpc)
------------------------------------------------------------
#Fit statistic : Chi-Squared =          41.75 using 59 PHA bins.
# Reduced chi-squared =         0.7324 for     57 degrees of freedom
# Null hypothesis probability =   9.352916e-01

Energy  Fluence     90% Error
[keV]   [erg/cm2]   [erg/cm2]
15- 25  3.787e-09   1.632e-09
25- 50  1.325e-08   5.580e-09
50-150  1.470e-08   7.505e-09
15-150  3.174e-08   1.433e-08
Thermal bremsstrahlung (OTTB)

Spectral model: thermal bremsstrahlung
------------------------------------------------------------
Parameters  : value         Lower 90%    Upper 90%
kT [keV]    : 152.695       (-88.3406      -150.054)
Norm        : 2.35948       (-0.531042     0.770476)
------------------------------------------------------------
#Fit statistic : Chi-Squared =          39.37 using 59 PHA bins.
# Reduced chi-squared =         0.6908 for     57 degrees of freedom
# Null hypothesis probability =   9.637665e-01

Energy  Fluence     90% Error
[keV]   [erg/cm2]   [erg/cm2]
15- 25  6.051e-09   3.482e-09
25- 50  1.124e-08   6.475e-09
50-150  2.236e-08   1.362e-08
15-150  3.965e-08   2.318e-08
Double BB

Spectral model: bbodyrad<1> + bbodyrad<2>
------------------------------------------------------------
Parameters  : value         Lower 90%    Upper 90%
kT1 [keV]   : 2.32483        (-1.72222      4.47067)
R1^2/D10^2  : 87.1951        (-99.0362      1067.49)
kT2 [keV]   : 14.9884        (-3.4377      6.43295)
R2^2/D10^2  : 6.05842E-02    (-0.0487526   0.045304)
------------------------------------------------------------
#Fit statistic : Chi-Squared =          37.61 using 59 PHA bins.
# Reduced chi-squared =         0.6839 for     55 degrees of freedom
# Null hypothesis probability =   9.647347e-01

Energy  Fluence     90% Error
[keV]   [erg/cm2]   [erg/cm2]
15- 25  5.625e-09   2.970e-09
25- 50  1.147e-08   6.681e-09
50-150  1.730e-08   1.084e-08
15-150  3.438e-08   1.830e-08
Pre-slew spectrum (Pre-slew PHA with pre-slew DRM)
Power-law model

Spectral model in power-law:
------------------------------------------------------------
Parameters  : value       lower 90%   higher 90%
Photon index: 1.78647     ( -0.107104   0.108936 )
Norm@50keV  : 1.60922E-03    ( -0.000106321   0.000105322 )
------------------------------------------------------------
#Fit statistic : Chi-Squared =          59.22 using 59 PHA bins.
# Reduced chi-squared =          1.039 for     57 degrees of freedom
# Null hypothesis probability =   3.945704e-01

Photon flux (15-150 keV)    in 107.4 sec: 0.220595 ( -0.0129275  0.012937 ) ph/cm2/s
Energy fluence (15-150 keV)             : 1.59192e-06 ( -1.07609e-07  1.08778e-07 ) ergs/cm2
Cutoff power-law model
Spectral model in the cutoff power-law:
------------------------------------------------------------
Parameters  : value       lower 90%   higher 90%
Photon index: 1.25358     ( -0.48738   0.430903 )
Epeak [keV] : 61.5370      ( -12.698 69.1845 )
Norm@50keV  : 3.17480E-03    ( -0.00131674   0.00271426 )
------------------------------------------------------------
#Fit statistic : Chi-Squared =          54.63 using 59 PHA bins.
# Reduced chi-squared =         0.9755 for     56 degrees of freedom
# Null hypothesis probability =   5.269151e-01

Photon flux (15-150 keV)    in 107.4 sec: 0.214605 ( -0.013751  0.013749 ) ph/cm2/s
Energy fluence (15-150 keV)             : 1.49948e-06 ( -1.28569e-07  1.30523e-07 ) ergs/cm2
Band function

Spectral model in the Band function:
------------------------------------------------------------
Parameters  : value       lower 90%   higher 90%
alpha       : -1.27334   ( -0.41147   0.433843 )
beta        : -9.36650    ( 9.37108   19.3711 )
Epeak [keV] : 62.6403      ( -12.8674 57.043 )
Norm@50keV   : 3.08613E-03    ( -0.0012301   0.000993344 )
------------------------------------------------------------
#Fit statistic : Chi-Squared =          54.64 using 59 PHA bins.
# Reduced chi-squared =         0.9934 for     55 degrees of freedom
# Null hypothesis probability =   4.884618e-01

Photon flux (15-150 keV)    in 107.4 sec:  (    ) ph/cm2/s
Energy fluence (15-150 keV)             : 1.51532e-06 ( -1.51457e-06  -1.16787e-07 ) ergs/cm2
S(25-50 keV) vs. S(50-100 keV) plot
S(25-50 keV)  = 1.10e-06
S(50-100 keV) = 1.29e-06
T90 vs. Hardness ratio plot

T90                                   = 284.423999994993 sec.
Hardness ratio (energy fluence ratio) = 1.17273
Color vs. Color plot
Count Ratio  (25-50 keV) / (15-25 keV) = 1.2602
Count Ratio (50-100 keV) / (15-25 keV) = 0.761222
Mask shadow pattern

IMX = 3.504548298085697E-01, IMY = -1.668952291069005E-01
TIME vs. PHA plot around the trigger time

Blue+Cyan dotted lines: Time interval of the scaled map
From 0.000000 to 128.000000
TIME vs. DetID plot around the trigger time

Blue+Cyan dotted lines: Time interval of the scaled map
From 0.000000 to 128.000000
100 us light curve (15-350 keV)

Blue+Cyan dotted lines: Time interval of the scaled map
From 0.000000 to 128.000000
Spacecraft aspect plot

Bright source in the pre-burst/pre-slew/post-slew images
Pre-burst image of 15-350 keV band
Time interval of the image:
-322.899410 -289.900000
-239.000000 29.344000

# RAcent  DECcent POSerr Theta    Phi  PeakCts   SNR AngSep     Name
#  [deg]    [deg]    ['] [deg]  [deg]                   [']
124.6739  10.1625    2.9  13.2   33.6   0.6933   3.9 ------	UNKNOWN
137.0808 -11.4677    2.3  31.7  -15.3   1.0025   4.9 ------	UNKNOWN
Pre-slew background subtracted image of 15-350 keV band
Time interval of the image:
29.344000 136.700600

# RAcent  DECcent POSerr Theta    Phi  PeakCts   SNR AngSep     Name
#  [deg]    [deg]    ['] [deg]  [deg]                   [']
121.8896   2.3053    0.5  21.2   25.5   2.8582  24.4 ------	UNKNOWN
Post-slew image of 15-350 keV band
Time interval of the image:
179.900600 867.000600

# RAcent  DECcent POSerr Theta    Phi  PeakCts   SNR AngSep     Name
#  [deg]    [deg]    ['] [deg]  [deg]                   [']
135.4183 -40.4261    7.3  44.5  -27.7  -0.9444  -1.6    9.2	Vela X-1
 98.4222 -39.6132    2.7  47.1   11.8   3.5360   4.3 ------	UNKNOWN
130.6691  56.1020    3.1  54.3  173.1   5.5247   3.8 ------	UNKNOWN
118.9243  16.9855    2.6  15.0  156.0   1.4338   4.5 ------	UNKNOWN
121.8632   2.2995    1.0   0.0   72.0   3.8376  11.7 ------	UNKNOWN
131.3552   3.8338    2.4   9.6 -112.4   1.4058   4.8 ------	UNKNOWN
129.8072 -44.1303    3.2  47.0  -20.7   2.3811   3.7 ------	UNKNOWN
135.5690 -48.3022    2.5  52.0  -24.5   4.2391   4.6 ------	UNKNOWN
Plot creation:
Sun May 31 05:43:58 EDT 2015