Special notes of this burst
Image
Pre-slew 15.0-350.0 keV image (Event data)
#   RAcent    DECcent   POSerr    Theta     Phi              Peak Cts       SNR   Name
   95.8345    -0.1048   0.0139    26.1701    66.0786         0.1144589     13.879 TRIG_00333320

Foreground time interval of the image:
  0.000   0.220 (delta_t =   0.220 [sec])
Background time interval of the image:
-239.200   0.000 (delta_t = 239.200 [sec])
Lightcurves
Notes:
- 1) The mask-weighted light curves are using the flight position.
- 2) Multiple plots of different time binning/intervals are shown to cover all scenarios of short/long GRBs, rate/image triggers, and real/false positives.
- 3) For all the mask-weighted lightcurves, the y-axis units are counts/sec/det where a det is 0.4 x 0.4 = 0.16 sq cm.
- 4) The verticle lines correspond to following: green dotted lines are T50 interval, black dotted lines are T90 interval, blue solid line(s) is a spacecraft slew start time, and orange solid line(s) is a spacecraft slew end time.
- 5) Time of each bin is in the middle of the bin.
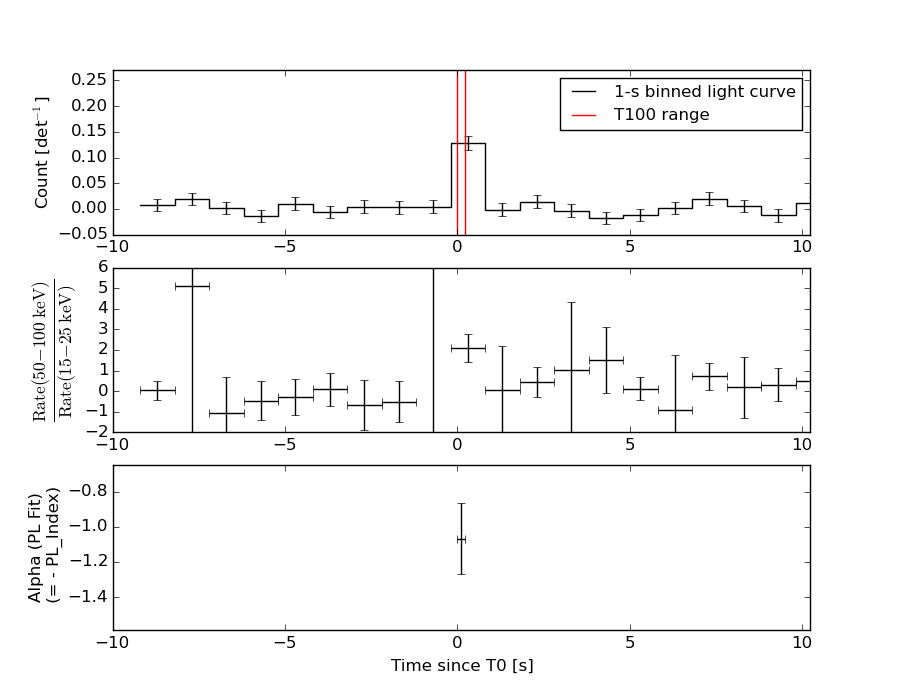
1 s binning
From T0-310 s to T0+310 s
From T100_start - 20 s to T100_end + 30 s
Full time interval
64 ms binning
Full time interval
From T100_start to T100_end
From T0-5 sec to T0+5 sec
16 ms binning
From T100_start-5 s to T100_start+5 s
Blue+Cyan dotted lines: Time interval of the scaled map
From 0.000000 to 0.256000
8 ms binning
From T100_start-3 s to T100_start+3 s
Blue+Cyan dotted lines: Time interval of the scaled map
From 0.000000 to 0.256000
2 ms binning
From T100_start-1 s to T100_start+1 s
Blue+Cyan dotted lines: Time interval of the scaled map
From 0.000000 to 0.256000
SN=5 or 10 sec. binning (whichever binning is satisfied first)
SN=5 or 10 sec. binning (T < 200 sec)
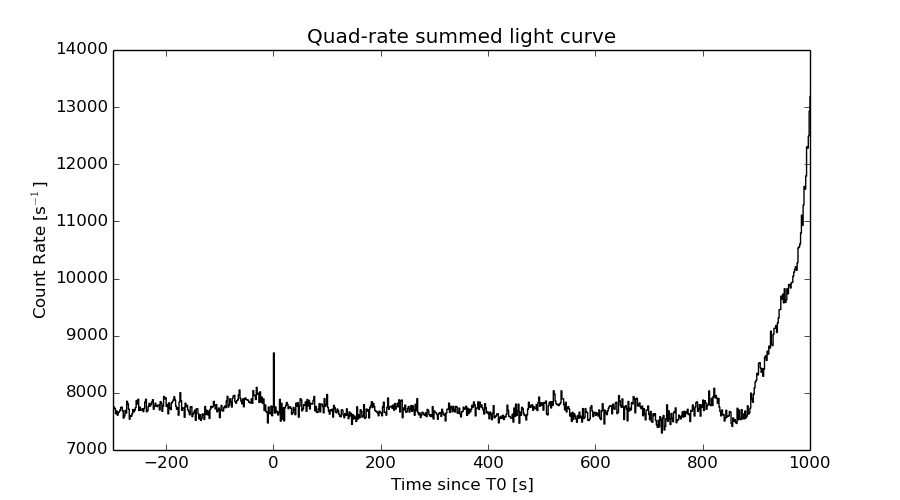
Quad-rate summed light curves (from T0-300s to T0+1000s)
Spectral Evolution
Spectra
Notes:
- 1) The fitting includes the systematic errors.
- 2) When the burst includes telescope slew time periods, the fitting uses an average response file made from multiple 5-s response files through out the slew time plus single time preiod for the non-slew times, and weighted by the total counts in the corresponding time period using addrmf. An average response file is needed becuase a spectral fit using the pre-slew DRM will introduce some errors in both a spectral shape and a normalization if the PHA file contains a lot of the slew/post-slew time interval.
- 3) For fits to more complicated models (e.g. a power-law over a cutoff power-law), the BAT team has decided to require a chi-square improvement of more than 6 for each extra dof.
Time averaged spectrum fit using the average DRM
Power-law model

Time interval is from    0.000 sec. to    0.220 sec.

Spectral model in power-law:
------------------------------------------------------------
Parameters  : value       lower 90%   higher 90%
Photon index: 1.06982     ( -0.203647   0.200171 )
Norm@50keV  : 3.09313E-02    ( -0.00411603   0.00411582 )
------------------------------------------------------------
#Fit statistic : Chi-Squared =          66.83 using 59 PHA bins.
# Reduced chi-squared =          1.173 for     57 degrees of freedom
# Null hypothesis probability =   1.750087e-01

Photon flux (15-150 keV)    in 0.22 sec: 3.57807 ( -0.48075  0.481055 ) ph/cm2/s
Energy fluence (15-150 keV)             : 7.18487e-08 ( -1.05506e-08  1.063e-08 ) ergs/cm2
Cutoff power-law model

Time interval is from    0.000 sec. to    0.220 sec.
Spectral model in the cutoff power-law:
------------------------------------------------------------
Parameters  : value       lower 90%   higher 90%
Photon index: -0.253557     ( -1.1892   0.935964 )
Epeak [keV] : 91.2407      ( -21.0997 88.3746 )
Norm@50keV  : 0.134134    ( -0.0852733   0.32405 )
------------------------------------------------------------
#Fit statistic : Chi-Squared =          60.60 using 59 PHA bins.
# Reduced chi-squared =          1.082 for     56 degrees of freedom
# Null hypothesis probability =   3.135248e-01

Photon flux (15-150 keV)    in 0.22 sec: 3.50753 ( -0.48611  0.48576 ) ph/cm2/s
Energy fluence (15-150 keV)             : 6.80526e-08 ( -1.10563e-08  1.12011e-08 ) ergs/cm2
Band function
Time interval is from    0.000 sec. to    0.220 sec.

Spectral model in the Band function:
------------------------------------------------------------
Parameters  : value       lower 90%   higher 90%
alpha       : 0.328885   ( -0.998862   -0.331615 )
beta        : -2.32800    ( 2.33114   1.23367 )
Epeak [keV] : 87.8281      ( -54.8937 83.3065 )
Norm@50keV   : 0.147799    ( -0.148165   189.938 )
------------------------------------------------------------
#Fit statistic : Chi-Squared =          60.50 using 59 PHA bins.
# Reduced chi-squared =          1.100 for     55 degrees of freedom
# Null hypothesis probability =   2.841453e-01

Photon flux (15-150 keV)    in 0.22 sec:  (    ) ph/cm2/s
Energy fluence (15-150 keV)             : 0 ( 0  0 ) ergs/cm2
Single BB
Spectral model blackbody:
------------------------------------------------------------
Parameters  : value    Lower 90%  Upper 90%
kT [keV]    : 19.3177  (-2.58532  3.11199)
R^2/D10^2   : 0.206387  (-0.0802004   0.122949)
(R is the radius in km and D10 is the distance to the source in units of 10 kpc)
------------------------------------------------------------
#Fit statistic : Chi-Squared =          63.11 using 59 PHA bins.
# Reduced chi-squared =          1.107 for     57 degrees of freedom
# Null hypothesis probability =   2.692218e-01

Energy  Fluence     90% Error
[keV]   [erg/cm2]   [erg/cm2]
15- 25  3.310e-09   7.997e-10
25- 50  1.611e-08   3.003e-09
50-150  4.431e-08   1.065e-08
15-150  6.373e-08   1.122e-08
Thermal bremsstrahlung (OTTB)
Spectral model: thermal bremsstrahlung
------------------------------------------------------------
Parameters  : value         Lower 90%    Upper 90%
kT [keV]    : 200.000       (      )
Norm        : 14.1096       (-1.96978     1.96978)
------------------------------------------------------------
#Fit statistic : Chi-Squared =          78.88 using 59 PHA bins.
# Reduced chi-squared =          1.384 for     57 degrees of freedom
# Null hypothesis probability =   2.907732e-02

Energy  Fluence     90% Error
[keV]   [erg/cm2]   [erg/cm2]
15- 25  7.775e-09   4.411e-09
25- 50  1.496e-08   8.369e-09
50-150  3.280e-08   1.841e-08
15-150  5.553e-08   3.105e-08
Double BB

Spectral model: bbodyrad<1> + bbodyrad<2>
------------------------------------------------------------
Parameters  : value         Lower 90%    Upper 90%
kT1 [keV]   : 6.96535        (-3.85048      -6.97063)
R1^2/D10^2  : 1.54266        (-1.4935      9.81508)
kT2 [keV]   : 22.8417        (-5.99094      -22.8443)
R2^2/D10^2  : 0.106160    (-0.103329   0.133953)
------------------------------------------------------------
#Fit statistic : Chi-Squared =          60.10 using 59 PHA bins.
# Reduced chi-squared =          1.093 for     55 degrees of freedom
# Null hypothesis probability =   2.964111e-01

Energy  Fluence     90% Error
[keV]   [erg/cm2]   [erg/cm2]
15- 25  4.847e-09   2.693e-09
25- 50  1.554e-08   7.690e-09
50-150  4.726e-08   2.666e-08
15-150  6.765e-08   3.549e-08
Peak spectrum fit
Power-law model
Time interval is from   -0.388 sec. to    0.612 sec.

Spectral model in power-law:
------------------------------------------------------------
Parameters  : value       lower 90%   higher 90%
Photon index: 1.14223     ( -0.276382   0.269689 )
Norm@50keV  : 8.65152E-03    ( -0.00146113   0.00146083 )
------------------------------------------------------------
#Fit statistic : Chi-Squared =          69.35 using 59 PHA bins.
# Reduced chi-squared =          1.217 for     57 degrees of freedom
# Null hypothesis probability =   1.263718e-01

Photon flux (15-150 keV)    in 1 sec: 1.00803 ( -0.173789  0.174299 ) ph/cm2/s
Energy fluence (15-150 keV)             : 8.92732e-08 ( -1.64219e-08  1.66331e-08 ) ergs/cm2
Cutoff power-law model

Time interval is from   -0.388 sec. to    0.612 sec.
Spectral model in the cutoff power-law:
------------------------------------------------------------
Parameters  : value       lower 90%   higher 90%
Photon index: -0.535215     ( -1.93755   1.31741 )
Epeak [keV] : 82.7980      ( -19.2983 95.9477 )
Norm@50keV  : 5.10017E-02    ( -0.051002   0.281892 )
------------------------------------------------------------
#Fit statistic : Chi-Squared =          64.25 using 59 PHA bins.
# Reduced chi-squared =          1.147 for     56 degrees of freedom
# Null hypothesis probability =   2.098547e-01

Photon flux (15-150 keV)    in 1 sec: 0.944247 ( -0.182394  0.182253 ) ph/cm2/s
Energy fluence (15-150 keV)             : 8.18683e-08 ( -1.70624e-08  1.7701e-08 ) ergs/cm2
Band function
Time interval is from   -0.388 sec. to    0.612 sec.

Spectral model in the Band function:
------------------------------------------------------------
Parameters  : value       lower 90%   higher 90%
alpha       : 0.534120   ( -1.37439   1.92757 )
beta        : -10.0000    ( 10   3.55271e-15 )
Epeak [keV] : 82.8248      ( -16.9965 95.7282 )
Norm@50keV   : 5.09324E-02    ( -0.0509324   0.282259 )
------------------------------------------------------------
#Fit statistic : Chi-Squared =          64.25 using 59 PHA bins.
# Reduced chi-squared =          1.168 for     55 degrees of freedom
# Null hypothesis probability =   1.840587e-01

Photon flux (15-150 keV)    in 1 sec: 0.967436 (    ) ph/cm2/s
Energy fluence (15-150 keV)             : 8.56958e-08 ( 0  0 ) ergs/cm2
Single BB
Spectral model blackbody:
------------------------------------------------------------
Parameters  : value    Lower 90%  Upper 90%
kT [keV]    : 19.0695  (-3.18371  4.08765)
R^2/D10^2   : 5.80197E-02  (-0.0275754   0.048461)
(R is the radius in km and D10 is the distance to the source in units of 10 kpc)
------------------------------------------------------------
#Fit statistic : Chi-Squared =          64.87 using 59 PHA bins.
# Reduced chi-squared =          1.138 for     57 degrees of freedom
# Null hypothesis probability =   2.214077e-01

Energy  Fluence     90% Error
[keV]   [erg/cm2]   [erg/cm2]
15- 25  4.142e-09   1.386e-09
25- 50  1.997e-08   5.450e-09
50-150  5.341e-08   1.769e-08
15-150  7.753e-08   2.163e-08
Thermal bremsstrahlung (OTTB)
Spectral model: thermal bremsstrahlung
------------------------------------------------------------
Parameters  : value         Lower 90%    Upper 90%
kT [keV]    : 200.000       (      )
Norm        : 4.15158       (-0.718287     0.718238)
------------------------------------------------------------
#Fit statistic : Chi-Squared =          73.85 using 59 PHA bins.
# Reduced chi-squared =          1.296 for     57 degrees of freedom
# Null hypothesis probability =   6.606497e-02

Energy  Fluence     90% Error
[keV]   [erg/cm2]   [erg/cm2]
15- 25  1.034e-08   5.965e-09
25- 50  1.990e-08   1.125e-08
50-150  4.363e-08   2.461e-08
15-150  7.387e-08   4.343e-08
Double BB
Spectral model: bbodyrad<1> + bbodyrad<2>
------------------------------------------------------------
Parameters  : value         Lower 90%    Upper 90%
kT1 [keV]   : 5.25803        (-5.25803      -5.25803)
R1^2/D10^2  : 0.885680        (-0.885614      -0.885614)
kT2 [keV]   : 20.7289        (-4.23745      -20.7289)
R2^2/D10^2  : 4.18716E-02    (-0.0418703   0.0513648)
------------------------------------------------------------
#Fit statistic : Chi-Squared =          63.81 using 59 PHA bins.
# Reduced chi-squared =          1.160 for     55 degrees of freedom
# Null hypothesis probability =   1.945149e-01

Energy  Fluence     90% Error
[keV]   [erg/cm2]   [erg/cm2]
15- 25  6.041e-09   3.579e-09
25- 50  1.936e-08   1.075e-08
50-150  5.584e-08   3.304e-08
15-150  8.124e-08   4.473e-08
Pre-slew spectrum (Pre-slew PHA with pre-slew DRM)
Power-law model

Spectral model in power-law:
------------------------------------------------------------
Parameters  : value       lower 90%   higher 90%
Photon index: 1.06982     ( -0.203647   0.200171 )
Norm@50keV  : 3.09313E-02    ( -0.00411603   0.00411582 )
------------------------------------------------------------
#Fit statistic : Chi-Squared =          66.83 using 59 PHA bins.
# Reduced chi-squared =          1.173 for     57 degrees of freedom
# Null hypothesis probability =   1.750087e-01

Photon flux (15-150 keV)    in 0.22 sec: 3.57807 ( -0.48075  0.481055 ) ph/cm2/s
Energy fluence (15-150 keV)             : 7.18487e-08 ( -1.05506e-08  1.063e-08 ) ergs/cm2
Cutoff power-law model
Spectral model in the cutoff power-law:
------------------------------------------------------------
Parameters  : value       lower 90%   higher 90%
Photon index: -0.253557     ( -1.1892   0.935964 )
Epeak [keV] : 91.2407      ( -21.0997 88.3746 )
Norm@50keV  : 0.134134    ( -0.0852733   0.32405 )
------------------------------------------------------------
#Fit statistic : Chi-Squared =          60.60 using 59 PHA bins.
# Reduced chi-squared =          1.082 for     56 degrees of freedom
# Null hypothesis probability =   3.135248e-01

Photon flux (15-150 keV)    in 0.22 sec: 3.50753 ( -0.48611  0.48576 ) ph/cm2/s
Energy fluence (15-150 keV)             : 6.80526e-08 ( -1.10563e-08  1.12011e-08 ) ergs/cm2
Band function

Spectral model in the Band function:
------------------------------------------------------------
Parameters  : value       lower 90%   higher 90%
alpha       : 0.328885   ( -0.998862   -0.331615 )
beta        : -2.32800    ( 2.33114   1.23383 )
Epeak [keV] : 87.8281      ( -54.8937 83.3065 )
Norm@50keV   : 0.147799    ( -0.148165   189.938 )
------------------------------------------------------------
#Fit statistic : Chi-Squared =          60.50 using 59 PHA bins.
# Reduced chi-squared =          1.100 for     55 degrees of freedom
# Null hypothesis probability =   2.841453e-01

Photon flux (15-150 keV)    in 0.22 sec:  (    ) ph/cm2/s
Energy fluence (15-150 keV)             : 0 ( 0  0 ) ergs/cm2
S(25-50 keV) vs. S(50-100 keV) plot
S(25-50 keV)  = 1.39e-08
S(50-100 keV) = 2.65e-08
T90 vs. Hardness ratio plot
T90                                   = 0.180000007152557 sec.
Hardness ratio (energy fluence ratio) = 1.90647
Color vs. Color plot
Count Ratio  (25-50 keV) / (15-25 keV) = 2.10934
Count Ratio (50-100 keV) / (15-25 keV) = 2.24588
Mask shadow pattern
IMX = 1.992596715391991E-01, IMY = -4.492014886940798E-01
TIME vs. PHA plot around the trigger time
Blue+Cyan dotted lines: Time interval of the scaled map
From 0.000000 to 0.256000
TIME vs. DetID plot around the trigger time
Blue+Cyan dotted lines: Time interval of the scaled map
From 0.000000 to 0.256000
100 us light curve (15-350 keV)
Blue+Cyan dotted lines: Time interval of the scaled map
From 0.000000 to 0.256000
Spacecraft aspect plot
Bright source in the pre-burst/pre-slew/post-slew images
Pre-burst image of 15-350 keV band
Time interval of the image:
-239.200000 0.000000

# RAcent  DECcent POSerr Theta    Phi  PeakCts   SNR AngSep     Name
#  [deg]    [deg]    ['] [deg]  [deg]                   [']
135.5256 -40.5548    0.4  44.6  -33.8  10.9291  29.9    0.1	Vela X-1
100.2705  35.9513    2.1  39.2  132.8   2.1536   5.3 ------	UNKNOWN
127.8902 -51.2528    2.4  53.8  -23.7   2.5189   4.7 ------	UNKNOWN
148.9791 -41.6236    2.6  50.3  -45.3   3.7996   4.4 ------	UNKNOWN
153.3337 -32.8253    2.5  46.0  -56.6   3.6229   4.7 ------	UNKNOWN
Pre-slew background subtracted image of 15-350 keV band
Time interval of the image:
0.000000 0.220000

# RAcent  DECcent POSerr Theta    Phi  PeakCts   SNR AngSep     Name
#  [deg]    [deg]    ['] [deg]  [deg]                   [']
135.2844 -40.6743    0.0  44.7  -33.5  -0.0199  -2.0   13.2	Vela X-1
 81.5817 -29.8362    2.5  50.1   28.0   0.1220   4.6 ------	UNKNOWN
 95.8345  -0.1049    0.8  26.2   66.1   0.1144  13.9 ------	UNKNOWN
Post-slew image of 15-350 keV band
Time interval of the image:
980.900600 1055.682400

# RAcent  DECcent POSerr Theta    Phi  PeakCts   SNR AngSep     Name
#  [deg]    [deg]    ['] [deg]  [deg]                   [']
135.4955 -40.5505    1.2  34.3  138.4   3.7998  10.0    1.5	Vela X-1
170.4640 -60.7438   15.5   8.8   88.0   0.1742   0.7    8.5	Cen X-3
186.6516 -62.8090    2.8   8.0   32.0   0.9377   4.1    2.3	GX 301-2
255.9792 -37.8676  252.0  50.5  -34.3   0.0373   0.0    1.4	4U 1700-377
256.4460 -36.4503   77.0  51.7  -35.2  -0.1336  -0.1    1.7	GX 349+2
264.7040 -44.4312    8.3  50.7  -22.2  -0.8024  -1.4    2.0	4U 1735-44
281.1253 -61.8242    2.3  46.8    3.8   2.2399   4.9 ------	UNKNOWN
262.9143 -61.3925    2.8  39.8   -3.7   1.3110   4.1 ------	UNKNOWN
163.3376 -25.8402    2.8  32.6 -170.8   0.9817   4.1 ------	UNKNOWN
151.3213  -5.5852    2.6  55.6 -175.8   4.7632   4.5 ------	UNKNOWN
247.9761 -52.6281    2.5  37.0  -22.3   1.3422   4.6 ------	UNKNOWN
230.9992 -27.9788    3.0  43.6  -64.6   4.0927   3.9 ------	UNKNOWN
Plot creation:
Sun May 31 05:39:46 EDT 2015