Special notes of this burst
Image
Pre-slew 15.0-350.0 keV image (Event data)
#   RAcent    DECcent   POSerr    Theta     Phi              Peak Cts       SNR   Name
   82.5739   -43.3094   0.0126    38.6517  -170.2407         2.0001983     15.314 TRIG_00334877

Foreground time interval of the image:
  9.884  73.701 (delta_t =  63.817 [sec])
Background time interval of the image:
-68.699   9.884 (delta_t =  78.583 [sec])
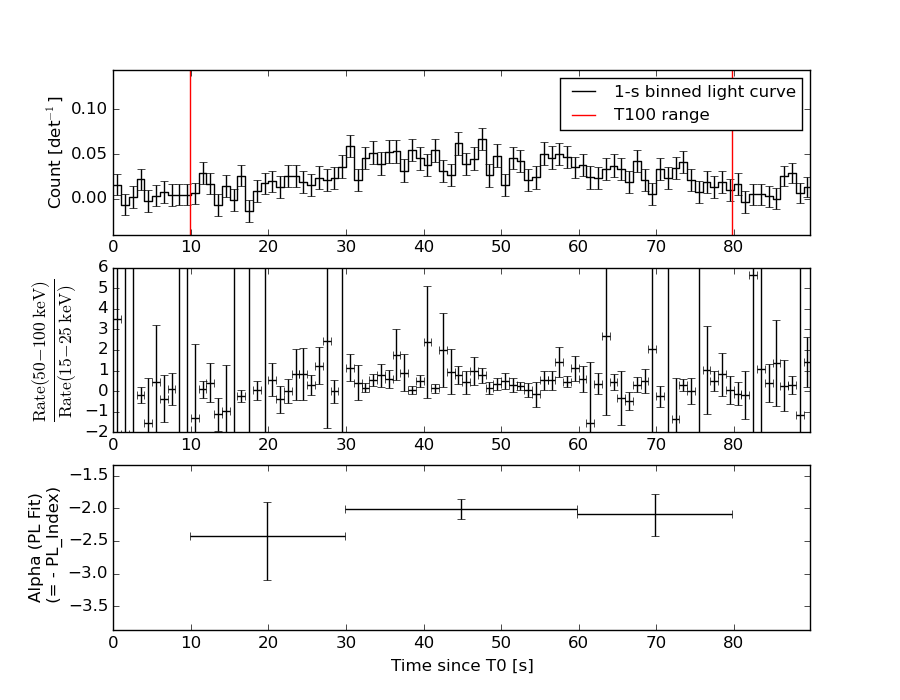
Lightcurves
Notes:
- 1) The mask-weighted light curves are using the flight position.
- 2) Multiple plots of different time binning/intervals are shown to cover all scenarios of short/long GRBs, rate/image triggers, and real/false positives.
- 3) For all the mask-weighted lightcurves, the y-axis units are counts/sec/det where a det is 0.4 x 0.4 = 0.16 sq cm.
- 4) The verticle lines correspond to following: green dotted lines are T50 interval, black dotted lines are T90 interval, blue solid line(s) is a spacecraft slew start time, and orange solid line(s) is a spacecraft slew end time.
- 5) Time of each bin is in the middle of the bin.
1 s binning
From T0-310 s to T0+310 s
From T100_start - 20 s to T100_end + 30 s
Full time interval
64 ms binning
Full time interval
From T100_start to T100_end
From T0-5 sec to T0+5 sec
16 ms binning
From T100_start-5 s to T100_start+5 s
Blue+Cyan dotted lines: Time interval of the scaled map
From 0.000000 to 64.000000
8 ms binning
From T100_start-3 s to T100_start+3 s
Blue+Cyan dotted lines: Time interval of the scaled map
From 0.000000 to 64.000000
2 ms binning
From T100_start-1 s to T100_start+1 s
Blue+Cyan dotted lines: Time interval of the scaled map
From 0.000000 to 64.000000
SN=5 or 10 sec. binning (whichever binning is satisfied first)

SN=5 or 10 sec. binning (T < 200 sec)
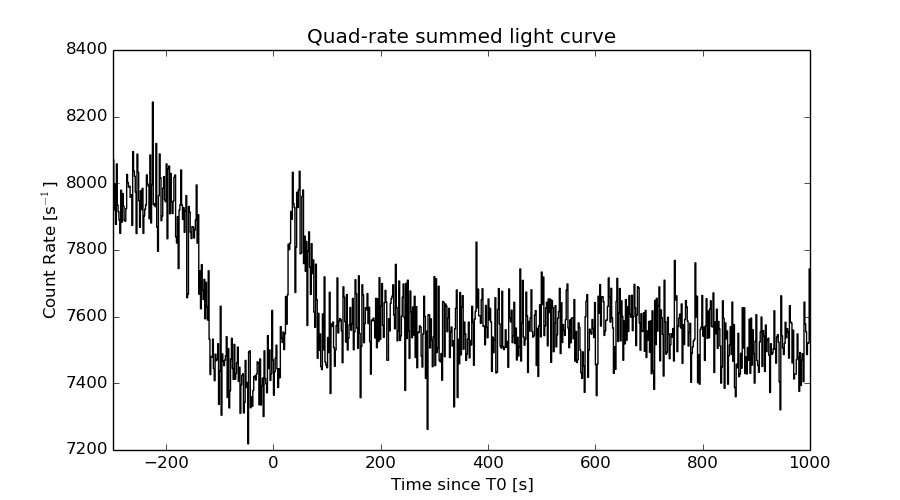
Quad-rate summed light curves (from T0-300s to T0+1000s)
Spectral Evolution
Spectra
Notes:
- 1) The fitting includes the systematic errors.
- 2) When the burst includes telescope slew time periods, the fitting uses an average response file made from multiple 5-s response files through out the slew time plus single time preiod for the non-slew times, and weighted by the total counts in the corresponding time period using addrmf. An average response file is needed becuase a spectral fit using the pre-slew DRM will introduce some errors in both a spectral shape and a normalization if the PHA file contains a lot of the slew/post-slew time interval.
- 3) For fits to more complicated models (e.g. a power-law over a cutoff power-law), the BAT team has decided to require a chi-square improvement of more than 6 for each extra dof.
Time averaged spectrum fit using the average DRM
Power-law model
Time interval is from    9.884 sec. to   79.836 sec.

Spectral model in power-law:
------------------------------------------------------------
Parameters  : value       lower 90%   higher 90%
Photon index: 2.10778     ( -0.151397   0.158197 )
Norm@50keV  : 1.81000E-03    ( -0.000185319   0.000181853 )
------------------------------------------------------------
#Fit statistic : Chi-Squared =          62.27 using 59 PHA bins.
# Reduced chi-squared =          1.092 for     57 degrees of freedom
# Null hypothesis probability =   2.942253e-01

Photon flux (15-150 keV)    in 69.95 sec: 0.285858 ( -0.02247  0.0224848 ) ph/cm2/s
Energy fluence (15-150 keV)             : 1.17724e-06 ( -1.07723e-07  1.09367e-07 ) ergs/cm2
Cutoff power-law model

Time interval is from    9.884 sec. to   79.836 sec.
Spectral model in the cutoff power-law:
------------------------------------------------------------
Parameters  : value       lower 90%   higher 90%
Photon index: 1.73144     ( -0.669806   0.408033 )
Epeak [keV] : 29.6801      ( -26.2206 40.4784 )
Norm@50keV  : 2.98468E-03    ( -0.00149946   0.00425116 )
------------------------------------------------------------
#Fit statistic : Chi-Squared =          61.06 using 59 PHA bins.
# Reduced chi-squared =          1.090 for     56 degrees of freedom
# Null hypothesis probability =   2.989902e-01

Photon flux (15-150 keV)    in 69.95 sec: 0.281117 ( -0.023593  0.023405 ) ph/cm2/s
Energy fluence (15-150 keV)             : 1.1329e-06 ( -1.24938e-07  1.28197e-07 ) ergs/cm2
Band function
Time interval is from    9.884 sec. to   79.836 sec.

Spectral model in the Band function:
------------------------------------------------------------
Parameters  : value       lower 90%   higher 90%
alpha       : -1.73143   ( 1.90707   0.197548 )
beta        : -10.00000    ( 10   20 )
Epeak [keV] : 29.6769      ( -9.64399 21.4098 )
Norm@50keV   : 2.98400E-03    ( -0.000231791   0.0042557 )
------------------------------------------------------------
#Fit statistic : Chi-Squared =          61.06 using 59 PHA bins.
# Reduced chi-squared =          1.110 for     55 degrees of freedom
# Null hypothesis probability =   2.672363e-01

Photon flux (15-150 keV)    in 69.95 sec:  (    ) ph/cm2/s
Energy fluence (15-150 keV)             : 0 ( 0  0 ) ergs/cm2
Single BB
Spectral model blackbody:
------------------------------------------------------------
Parameters  : value    Lower 90%  Upper 90%
kT [keV]    : 9.43699  (-0.927307  1.03108)
R^2/D10^2   : 0.159303  (-0.0530085   0.0801701)
(R is the radius in km and D10 is the distance to the source in units of 10 kpc)
------------------------------------------------------------
#Fit statistic : Chi-Squared =          97.68 using 59 PHA bins.
# Reduced chi-squared =          1.714 for     57 degrees of freedom
# Null hypothesis probability =   6.459404e-04

Energy  Fluence     90% Error
[keV]   [erg/cm2]   [erg/cm2]
15- 25  1.976e-07   2.490e-08
25- 50  4.516e-07   4.347e-08
50-150  1.988e-07   4.428e-08
15-150  8.481e-07   8.324e-08
Thermal bremsstrahlung (OTTB)
Spectral model: thermal bremsstrahlung
------------------------------------------------------------
Parameters  : value         Lower 90%    Upper 90%
kT [keV]    : 57.1939       (-12.1499      17.0154)
Norm        : 1.51452       (-0.205494     0.230897)
------------------------------------------------------------
#Fit statistic : Chi-Squared =          62.14 using 59 PHA bins.
# Reduced chi-squared =          1.090 for     57 degrees of freedom
# Null hypothesis probability =   2.982036e-01

Energy  Fluence     90% Error
[keV]   [erg/cm2]   [erg/cm2]
15- 25  2.641e-07   2.788e-08
25- 50  3.959e-07   3.281e-08
50-150  4.326e-07   9.107e-08
15-150  1.093e-06   1.126e-07
Double BB

Spectral model: bbodyrad<1> + bbodyrad<2>
------------------------------------------------------------
Parameters  : value         Lower 90%    Upper 90%
kT1 [keV]   : 5.05504        (-1.11232      1.29713)
R1^2/D10^2  : 1.31790        (-0.756643      2.35988)
kT2 [keV]   : 17.0989        (-3.47725      6.01707)
R2^2/D10^2  : 1.14572E-02    (-0.00814169   0.0186378)
------------------------------------------------------------
#Fit statistic : Chi-Squared =          60.93 using 59 PHA bins.
# Reduced chi-squared =          1.108 for     55 degrees of freedom
# Null hypothesis probability =   2.711940e-01

Energy  Fluence     90% Error
[keV]   [erg/cm2]   [erg/cm2]
15- 25  2.818e-07   1.061e-07
25- 50  3.689e-07   1.103e-07
50-150  4.496e-07   2.270e-07
15-150  1.100e-06   3.622e-07
Peak spectrum fit
Power-law model
Time interval is from   46.944 sec. to   47.944 sec.

Spectral model in power-law:
------------------------------------------------------------
Parameters  : value       lower 90%   higher 90%
Photon index: 1.61741     ( -0.483781   0.513158 )
Norm@50keV  : 4.68169E-03    ( -0.00141236   0.0013628 )
------------------------------------------------------------
#Fit statistic : Chi-Squared =          63.44 using 59 PHA bins.
# Reduced chi-squared =          1.113 for     57 degrees of freedom
# Null hypothesis probability =   2.599820e-01

Photon flux (15-150 keV)    in 1 sec: 0.604909 ( -0.168556  0.169022 ) ph/cm2/s
Energy fluence (15-150 keV)             : 4.36939e-08 ( -1.36263e-08  1.4052e-08 ) ergs/cm2
Cutoff power-law model
Time interval is from   46.944 sec. to   47.944 sec.
Spectral model in the cutoff power-law:
------------------------------------------------------------
Parameters  : value       lower 90%   higher 90%
Photon index: 1.19834     ( -2.6857   1.1045 )
Epeak [keV] : 91.9822      ( -91.9817 -91.9817 )
Norm@50keV  : 7.77192E-03    ( -0.00777197   0.158457 )
------------------------------------------------------------
#Fit statistic : Chi-Squared =          63.30 using 59 PHA bins.
# Reduced chi-squared =          1.130 for     56 degrees of freedom
# Null hypothesis probability =   2.344643e-01

Photon flux (15-150 keV)    in 1 sec: 0.595448 ( -0.175805  0.173655 ) ph/cm2/s
Energy fluence (15-150 keV)             : 4.23445e-08 ( -1.45097e-08  1.50452e-08 ) ergs/cm2
Band function

Time interval is from   46.944 sec. to   47.944 sec.

Spectral model in the Band function:
------------------------------------------------------------
Parameters  : value       lower 90%   higher 90%
alpha       : 4.96927   ( -4.96927   -4.96927 )
beta        : -1.71398    ( -0.693036   0.534218 )
Epeak [keV] : 23.5773      ( -23.5773 32.9615 )
Norm@50keV   : 764.479    ( -209.157   4.93702e+06 )
------------------------------------------------------------
#Fit statistic : Chi-Squared =          63.06 using 59 PHA bins.
# Reduced chi-squared =          1.147 for     55 degrees of freedom
# Null hypothesis probability =   2.127850e-01

Photon flux (15-150 keV)    in 1 sec:  (    ) ph/cm2/s
Energy fluence (15-150 keV)             : 4.20551e-08 ( 0  0 ) ergs/cm2
Single BB
Spectral model blackbody:
------------------------------------------------------------
Parameters  : value    Lower 90%  Upper 90%
kT [keV]    : 14.4906  (-4.22601  5.87808)
R^2/D10^2   : 7.67472E-02  (-0.0767053   0.183918)
(R is the radius in km and D10 is the distance to the source in units of 10 kpc)
------------------------------------------------------------
#Fit statistic : Chi-Squared =          65.92 using 59 PHA bins.
# Reduced chi-squared =          1.157 for     57 degrees of freedom
# Null hypothesis probability =   1.955624e-01

Energy  Fluence     90% Error
[keV]   [erg/cm2]   [erg/cm2]
15- 25  3.391e-09   2.115e-09
25- 50  1.304e-08   7.133e-09
50-150  1.834e-08   1.178e-08
15-150  3.478e-08   2.068e-08
Thermal bremsstrahlung (OTTB)
Spectral model: thermal bremsstrahlung
------------------------------------------------------------
Parameters  : value         Lower 90%    Upper 90%
kT [keV]    : 160.478       (-106.553      -161.606)
Norm        : 2.49276       (-0.711456     1.06409)
------------------------------------------------------------
#Fit statistic : Chi-Squared =          63.31 using 59 PHA bins.
# Reduced chi-squared =          1.111 for     57 degrees of freedom
# Null hypothesis probability =   2.636640e-01

Energy  Fluence     90% Error
[keV]   [erg/cm2]   [erg/cm2]
15- 25  6.363e-09   3.760e-09
25- 50  1.191e-08   6.920e-09
50-150  2.415e-08   1.523e-08
15-150  4.242e-08   2.564e-08
Double BB
Spectral model: bbodyrad<1> + bbodyrad<2>
------------------------------------------------------------
Parameters  : value         Lower 90%    Upper 90%
kT1 [keV]   : 4.30170        (-2.52537      -4.30229)
R1^2/D10^2  : 3.92063        (-3.81571      463.757)
kT2 [keV]   : 18.7110        (-6.19356      -18.7118)
R2^2/D10^2  : 2.68042E-02    (-0.0260107   0.0925883)
------------------------------------------------------------
#Fit statistic : Chi-Squared =          62.49 using 59 PHA bins.
# Reduced chi-squared =          1.136 for     55 degrees of freedom
# Null hypothesis probability =   2.275112e-01

Energy  Fluence     90% Error
[keV]   [erg/cm2]   [erg/cm2]
15- 25  6.871e-09   3.919e-09
25- 50  1.104e-08   6.180e-09
50-150  2.267e-08   1.456e-08
15-150  4.059e-08   2.233e-08
Pre-slew spectrum (Pre-slew PHA with pre-slew DRM)
Power-law model

Spectral model in power-law:
------------------------------------------------------------
Parameters  : value       lower 90%   higher 90%
Photon index: 2.09744     ( -0.150481   0.157155 )
Norm@50keV  : 1.88938E-03    ( -0.000193151   0.000189664 )
------------------------------------------------------------
#Fit statistic : Chi-Squared =          65.10 using 59 PHA bins.
# Reduced chi-squared =          1.142 for     57 degrees of freedom
# Null hypothesis probability =   2.156685e-01

Photon flux (15-150 keV)    in 63.82 sec: 0.296874 ( -0.0234405  0.0234547 ) ph/cm2/s
Energy fluence (15-150 keV)             : 1.12004e-06 ( -1.02942e-07  1.04507e-07 ) ergs/cm2
Cutoff power-law model

Spectral model in the cutoff power-law:
------------------------------------------------------------
Parameters  : value       lower 90%   higher 90%
Photon index: 1.62229     ( -0.699801   0.597738 )
Epeak [keV] : 32.8723      ( -29.394 25.0497 )
Norm@50keV  : 3.56046E-03    (     )
------------------------------------------------------------
#Fit statistic : Chi-Squared =          63.28 using 59 PHA bins.
# Reduced chi-squared =          1.130 for     56 degrees of freedom
# Null hypothesis probability =   2.348886e-01

Photon flux (15-150 keV)    in 63.82 sec: 0.290844 ( -0.024602  0.02458 ) ph/cm2/s
Energy fluence (15-150 keV)             : 1.06706e-06 ( -1.19152e-07  1.23109e-07 ) ergs/cm2
Band function
Spectral model in the Band function:
------------------------------------------------------------
Parameters  : value       lower 90%   higher 90%
alpha       : -1.62227   ( 1.86876   0.300899 )
beta        : -10.00000    ( 10   20 )
Epeak [keV] : 32.8659      ( -9.22427 19.216 )
Norm@50keV   : 3.55983E-03    ( -0.000277757   0.00547079 )
------------------------------------------------------------
#Fit statistic : Chi-Squared =          63.28 using 59 PHA bins.
# Reduced chi-squared =          1.151 for     55 degrees of freedom
# Null hypothesis probability =   2.072048e-01

Photon flux (15-150 keV)    in 63.82 sec:  (    ) ph/cm2/s
Energy fluence (15-150 keV)             : 1.06785e-06 ( 0  0 ) ergs/cm2
S(25-50 keV) vs. S(50-100 keV) plot

S(25-50 keV)  = 3.65e-07
S(50-100 keV) = 3.39e-07
T90 vs. Hardness ratio plot

T90                                   = 53.4040000140667 sec.
Hardness ratio (energy fluence ratio) = 0.928767
Color vs. Color plot
Count Ratio  (25-50 keV) / (15-25 keV) = 0.962794
Count Ratio (50-100 keV) / (15-25 keV) = 0.482189
Mask shadow pattern

IMX = -7.881934631565521E-01, IMY = 1.355677851365692E-01
TIME vs. PHA plot around the trigger time

Blue+Cyan dotted lines: Time interval of the scaled map
From 0.000000 to 64.000000
TIME vs. DetID plot around the trigger time
Blue+Cyan dotted lines: Time interval of the scaled map
From 0.000000 to 64.000000
100 us light curve (15-350 keV)
Blue+Cyan dotted lines: Time interval of the scaled map
From 0.000000 to 64.000000
Spacecraft aspect plot

Bright source in the pre-burst/pre-slew/post-slew images
Pre-burst image of 15-350 keV band
Time interval of the image:
-68.699410 9.884000

# RAcent  DECcent POSerr Theta    Phi  PeakCts   SNR AngSep     Name
#  [deg]    [deg]    ['] [deg]  [deg]                   [']
 86.7707 -12.4857    2.5  44.7  143.1   1.2302   4.6 ------	UNKNOWN
Pre-slew background subtracted image of 15-350 keV band
Time interval of the image:
9.884000 73.700600

# RAcent  DECcent POSerr Theta    Phi  PeakCts   SNR AngSep     Name
#  [deg]    [deg]    ['] [deg]  [deg]                   [']
 45.2621   4.9625    2.2  29.8   68.5   0.8296   5.2 ------	UNKNOWN
 82.5739 -43.3094    0.8  38.7 -170.2   2.0000  15.3 ------	UNKNOWN
 66.6086 -69.4719    2.2  47.4 -131.6   1.9845   5.3 ------	UNKNOWN
Post-slew image of 15-350 keV band
Time interval of the image:
141.500600 963.070800

# RAcent  DECcent POSerr Theta    Phi  PeakCts   SNR AngSep     Name
#  [deg]    [deg]    ['] [deg]  [deg]                   [']
135.4989 -40.5267    1.1  38.8 -136.4   7.8116  10.3    2.2	Vela X-1
 99.7033 -50.4334    2.5  13.7 -113.6   1.8166   4.6 ------	UNKNOWN
Plot creation:
Sun May 31 05:31:02 EDT 2015