Click here for the BAT GCN circular template
Image
Pre-slew 15.0-350.0 keV image (Event data)
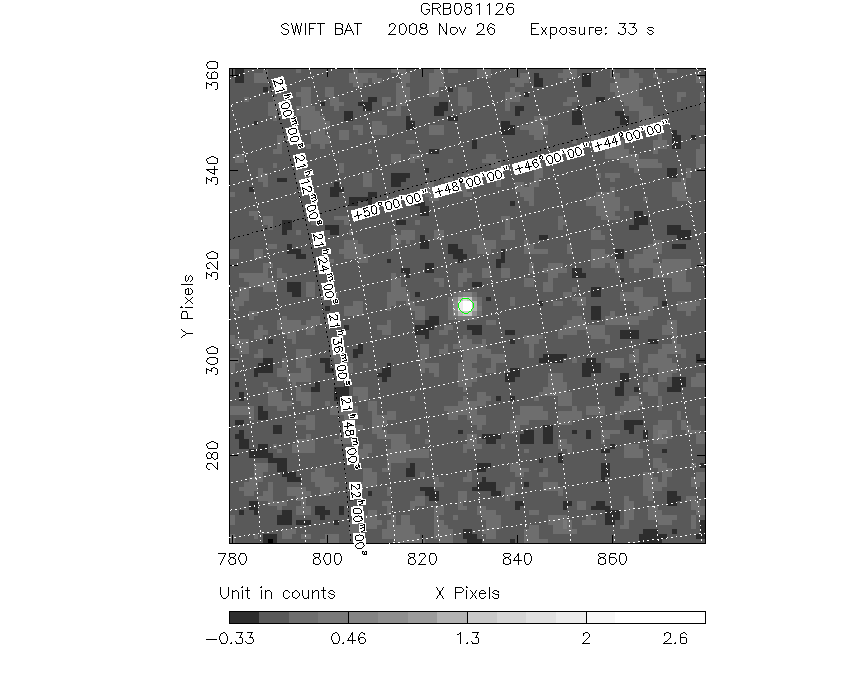
#   RAcent    DECcent   POSerr    Theta     Phi              Peak Cts       SNR   Name
  323.5221    48.7139   0.0048    19.9341    72.9909         3.0674038     39.920 TRIG_00335647

Foreground time interval of the image:
-21.528  11.333 (delta_t =  32.861 [sec])
Background time interval of the image:
-239.568 -21.528 (delta_t = 218.040 [sec])
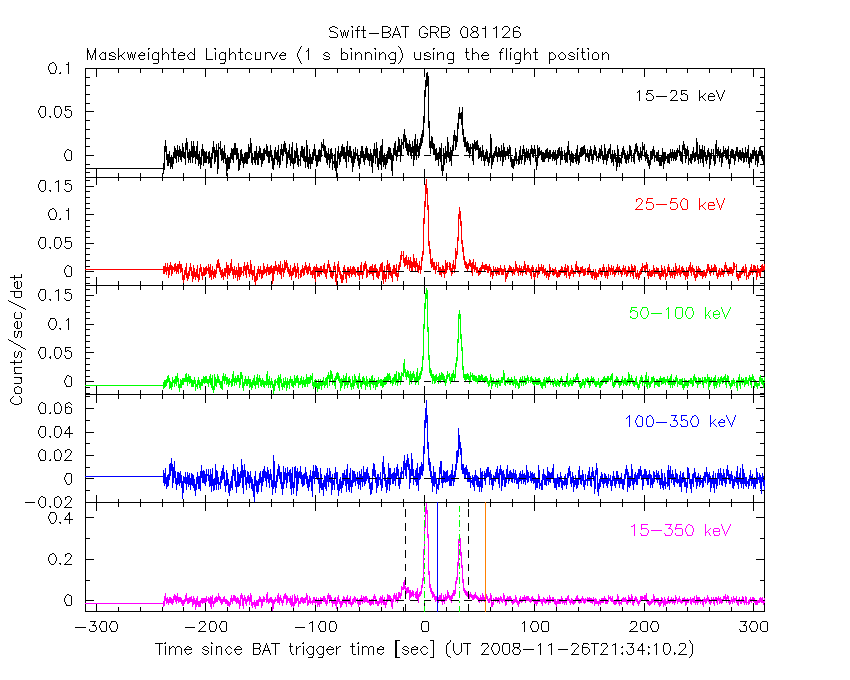
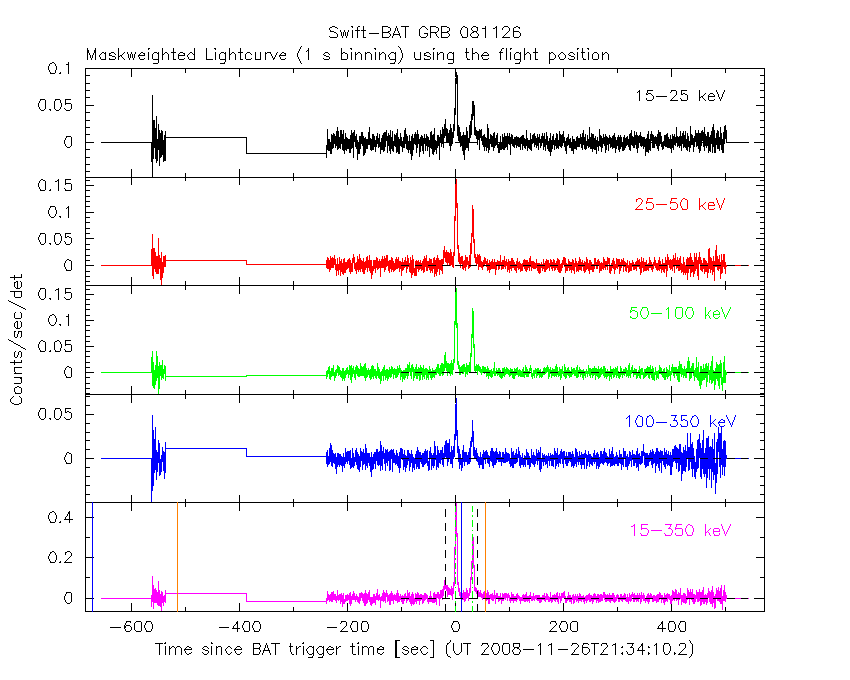
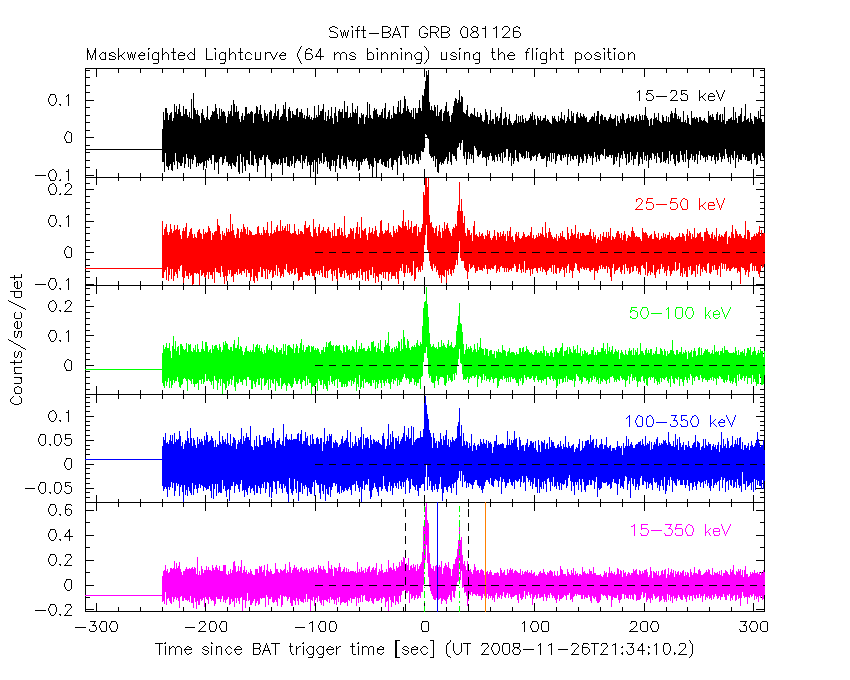
Lightcurves
Notes:
- 1) The mask-weighted light curves are using the flight position.
- 2) Multiple plots of different time binning/intervals are shown to cover all scenarios of short/long GRBs, rate/image triggers, and real/false positives.
- 3) For all the mask-weighted lightcurves, the y-axis units are counts/sec/det where a det is 0.4 x 0.4 = 0.16 sq cm.
- 4) The verticle lines correspond to following: green dotted lines are T50 interval, black dotted lines are T90 interval, blue solid line(s) is a spacecraft slew start time, and orange solid line(s) is a spacecraft slew end time.
- 5) Time of each bin is in the middle of the bin.
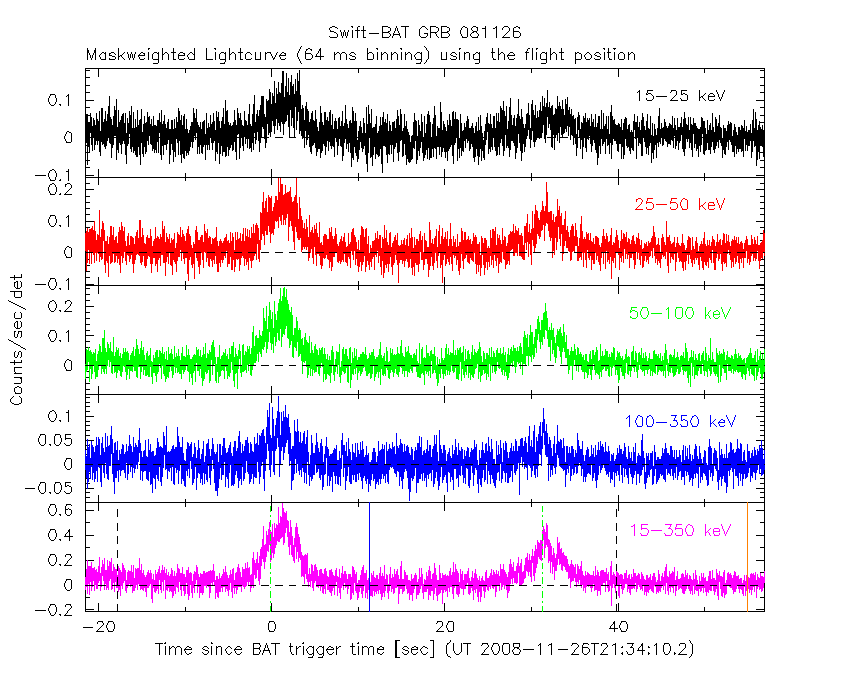
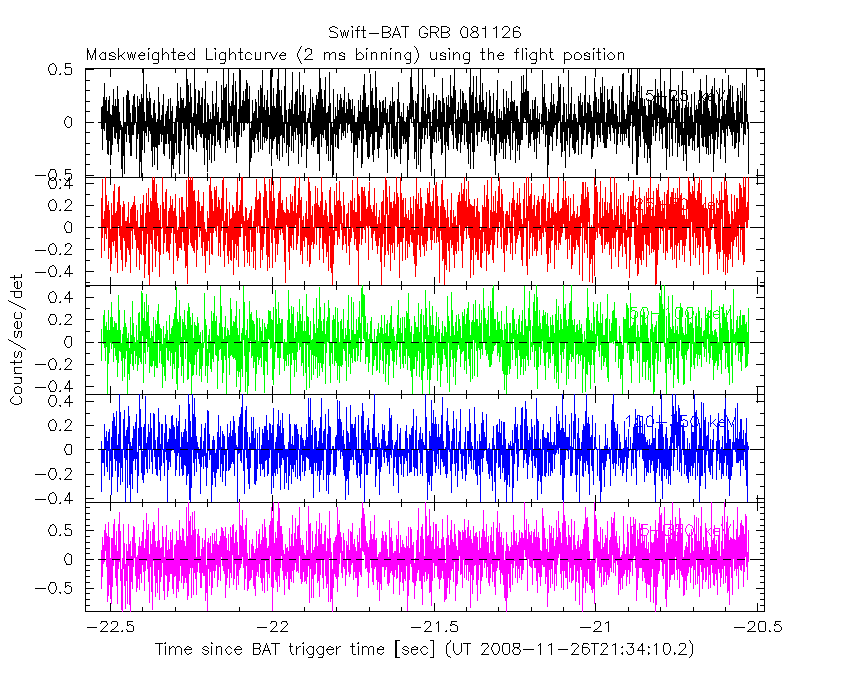
1 s binning
From T0-310 s to T0+310 s
From T100_start - 20 s to T100_end + 30 s

Full time interval
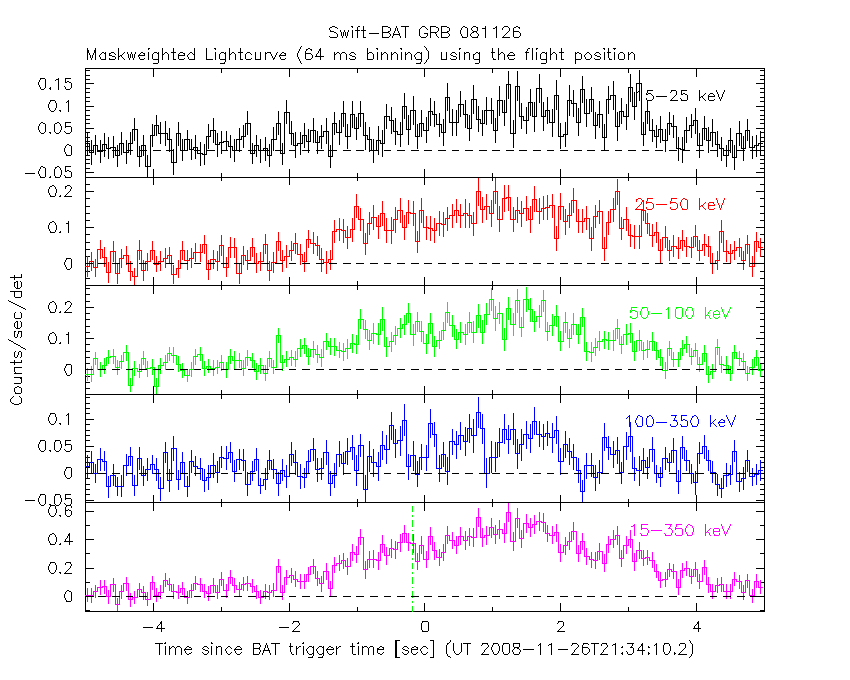
64 ms binning
Full time interval
From T100_start to T100_end
From T0-5 sec to T0+5 sec
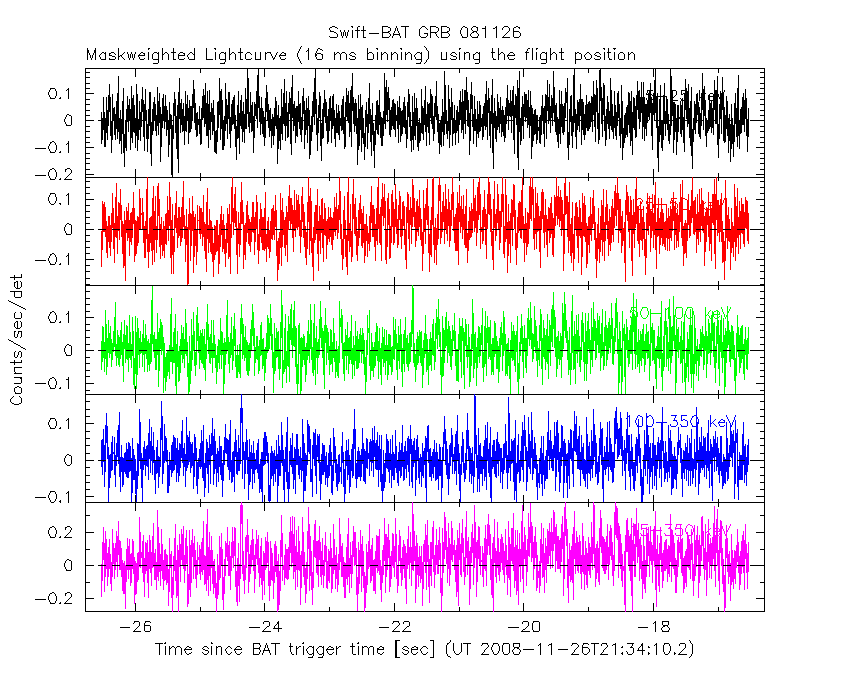
16 ms binning
From T100_start-5 s to T100_start+5 s
Blue+Cyan dotted lines: Time interval of the scaled map
From 0.000000 to 1.024000
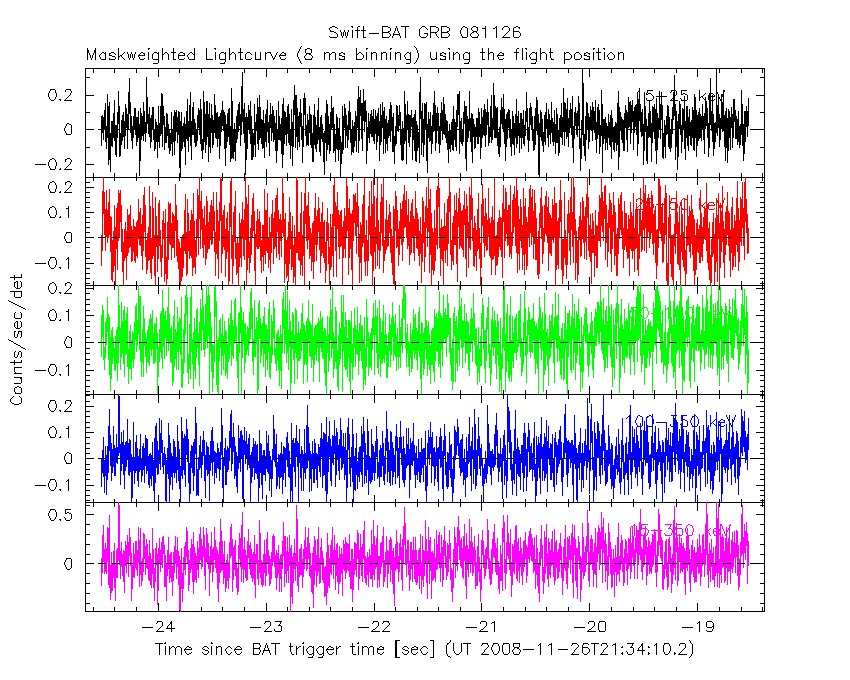
8 ms binning
From T100_start-3 s to T100_start+3 s
Blue+Cyan dotted lines: Time interval of the scaled map
From 0.000000 to 1.024000
2 ms binning
From T100_start-1 s to T100_start+1 s
Blue+Cyan dotted lines: Time interval of the scaled map
From 0.000000 to 1.024000
SN=5 or 10 sec. binning (whichever binning is satisfied first)
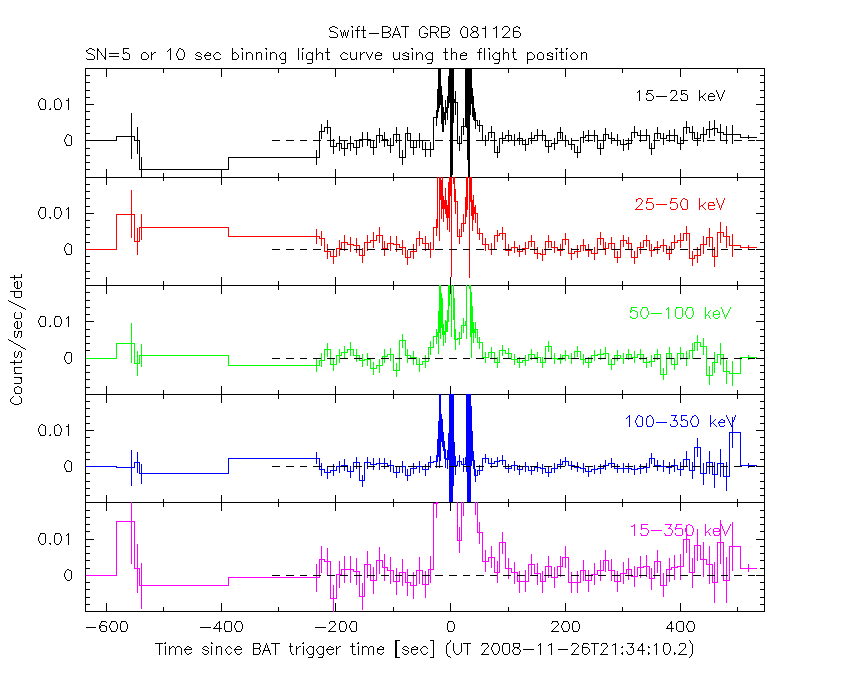
SN=5 or 10 sec. binning (T < 200 sec)

Quad-rate summed light curves (from T0-300s to T0+1000s)

Spectral Evolution

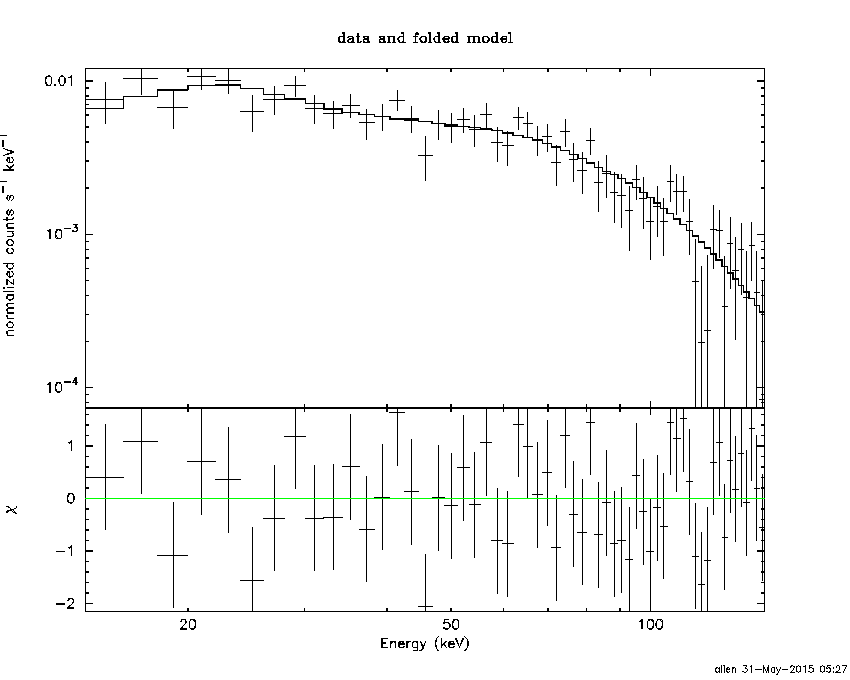
Spectra
Notes:
- 1) The fitting includes the systematic errors.
- 2) When the burst includes telescope slew time periods, the fitting uses an average response file made from multiple 5-s response files through out the slew time plus single time preiod for the non-slew times, and weighted by the total counts in the corresponding time period using addrmf. An average response file is needed becuase a spectral fit using the pre-slew DRM will introduce some errors in both a spectral shape and a normalization if the PHA file contains a lot of the slew/post-slew time interval.
- 3) For fits to more complicated models (e.g. a power-law over a cutoff power-law), the BAT team has decided to require a chi-square improvement of more than 6 for each extra dof.
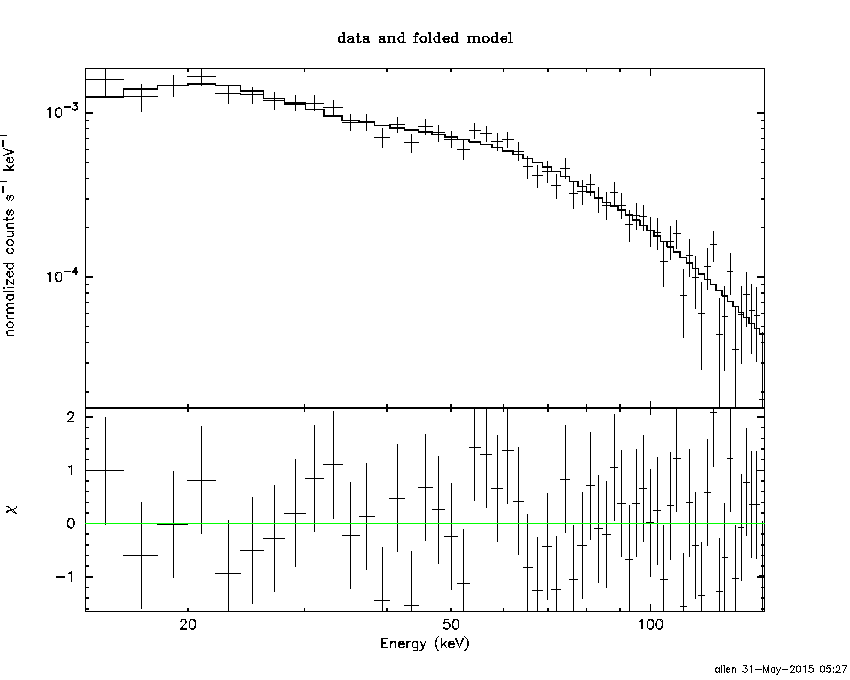
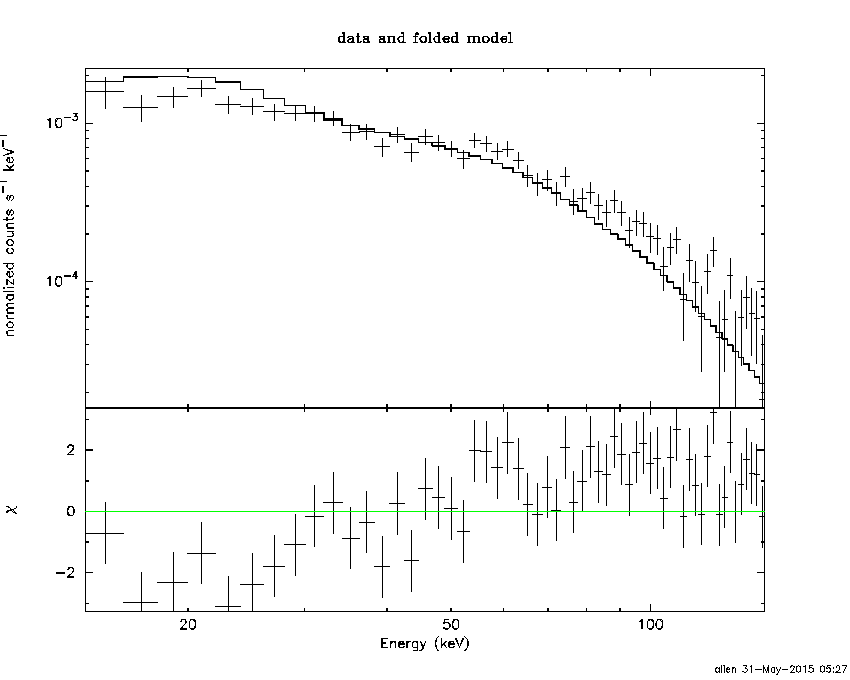
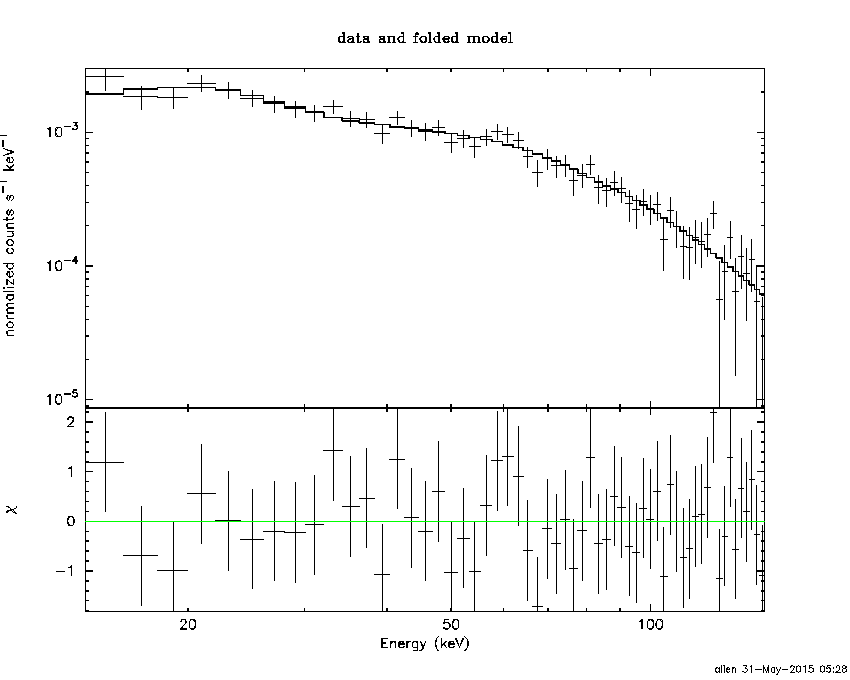
Time averaged spectrum fit using the average DRM
Power-law model

Time interval is from  -21.528 sec. to   56.912 sec.

Spectral model in power-law:
------------------------------------------------------------
Parameters  : value       lower 90%   higher 90%
Photon index: 1.20609     ( -0.0626119   0.0622731 )
Norm@50keV  : 4.34667E-03    ( -0.000145001   0.000144889 )
------------------------------------------------------------
#Fit statistic : Chi-Squared =          46.69 using 59 PHA bins.
# Reduced chi-squared =         0.8192 for     57 degrees of freedom
# Null hypothesis probability =   8.332612e-01

Photon flux (15-150 keV)    in 78.44 sec: 0.510651 ( -0.0181073  0.0181472 ) ph/cm2/s
Energy fluence (15-150 keV)             : 3.45318e-06 ( -1.23545e-07  1.23815e-07 ) ergs/cm2
Cutoff power-law model

Time interval is from  -21.528 sec. to   56.912 sec.
Spectral model in the cutoff power-law:
------------------------------------------------------------
Parameters  : value       lower 90%   higher 90%
Photon index: 1.06039     ( -0.251705   0.187152 )
Epeak [keV] : 366.207      ( -366.222 -366.222 )
Norm@50keV  : 5.04805E-03    ( -0.000863847   0.00143886 )
------------------------------------------------------------
#Fit statistic : Chi-Squared =          45.62 using 59 PHA bins.
# Reduced chi-squared =         0.8147 for     56 degrees of freedom
# Null hypothesis probability =   8.375682e-01

Photon flux (15-150 keV)    in 78.44 sec: 0.506014 ( -0.019528  0.019562 ) ph/cm2/s
Energy fluence (15-150 keV)             : 3.4243e-06 ( -1.34297e-07  1.33544e-07 ) ergs/cm2
Band function
Time interval is from  -21.528 sec. to   56.912 sec.

Spectral model in the Band function:
------------------------------------------------------------
Parameters  : value       lower 90%   higher 90%
alpha       : -0.538396   ( 0.625208   0.625208 )
beta        : -1.25154    ( 1.25138   0.0869679 )
Epeak [keV] : 77.0971      ( -76.8864 294.003 )
Norm@50keV   : 1.10553E-02    ( -0.00558539   243323 )
------------------------------------------------------------
#Fit statistic : Chi-Squared =          45.18 using 59 PHA bins.
# Reduced chi-squared =         0.8215 for     55 degrees of freedom
# Null hypothesis probability =   8.247605e-01

Photon flux (15-150 keV)    in 78.44 sec:  (    ) ph/cm2/s
Energy fluence (15-150 keV)             : 0 ( 0  0 ) ergs/cm2
Single BB
Spectral model blackbody:
------------------------------------------------------------
Parameters  : value    Lower 90%  Upper 90%
kT [keV]    : 19.8183  (  )
R^2/D10^2   : 2.36116E-02  (   )
(R is the radius in km and D10 is the distance to the source in units of 10 kpc)
------------------------------------------------------------
#Fit statistic : Chi-Squared =         204.64 using 59 PHA bins.
# Reduced chi-squared =         3.5901 for     57 degrees of freedom
# Null hypothesis probability =   1.632597e-18

Energy  Fluence     90% Error
[keV]   [erg/cm2]   [erg/cm2]
15- 25  1.407e-07   9.374e-09
25- 50  6.968e-07   3.404e-08
50-150  2.026e-06   1.165e-07
15-150  2.864e-06   1.177e-07
Thermal bremsstrahlung (OTTB)
Spectral model: thermal bremsstrahlung
------------------------------------------------------------
Parameters  : value         Lower 90%    Upper 90%
kT [keV]    : 199.362       (      )
Norm        : 2.15668       (     )
------------------------------------------------------------
#Fit statistic : Chi-Squared =         139.08 using 59 PHA bins.
# Reduced chi-squared =         2.4400 for     57 degrees of freedom
# Null hypothesis probability =   8.212199e-09

Energy  Fluence     90% Error
[keV]   [erg/cm2]   [erg/cm2]
15- 25  4.212e-07   1.530e-08
25- 50  8.104e-07   2.981e-08
50-150  1.777e-06   6.550e-08
15-150  3.009e-06   1.043e-07
Double BB

Spectral model: bbodyrad<1> + bbodyrad<2>
------------------------------------------------------------
Parameters  : value         Lower 90%    Upper 90%
kT1 [keV]   : 8.48428        (-1.22533      1.36761)
R1^2/D10^2  : 0.227099        (-0.0812675      0.145253)
kT2 [keV]   : 33.7902        (-4.53854      7.27866)
R2^2/D10^2  : 3.49539E-03    (-0.00161125   0.0021818)
------------------------------------------------------------
#Fit statistic : Chi-Squared =          49.85 using 59 PHA bins.
# Reduced chi-squared =         0.9065 for     55 degrees of freedom
# Null hypothesis probability =   6.709821e-01

Energy  Fluence     90% Error
[keV]   [erg/cm2]   [erg/cm2]
15- 25  2.868e-07   3.640e-08
25- 50  7.597e-07   7.060e-08
50-150  2.383e-06   2.930e-07
15-150  3.430e-06   3.373e-07
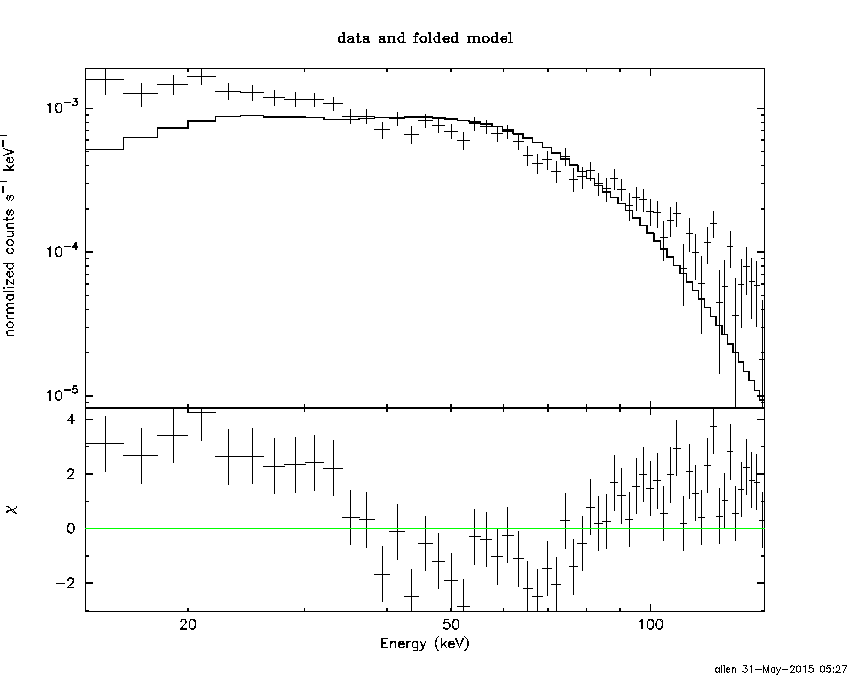
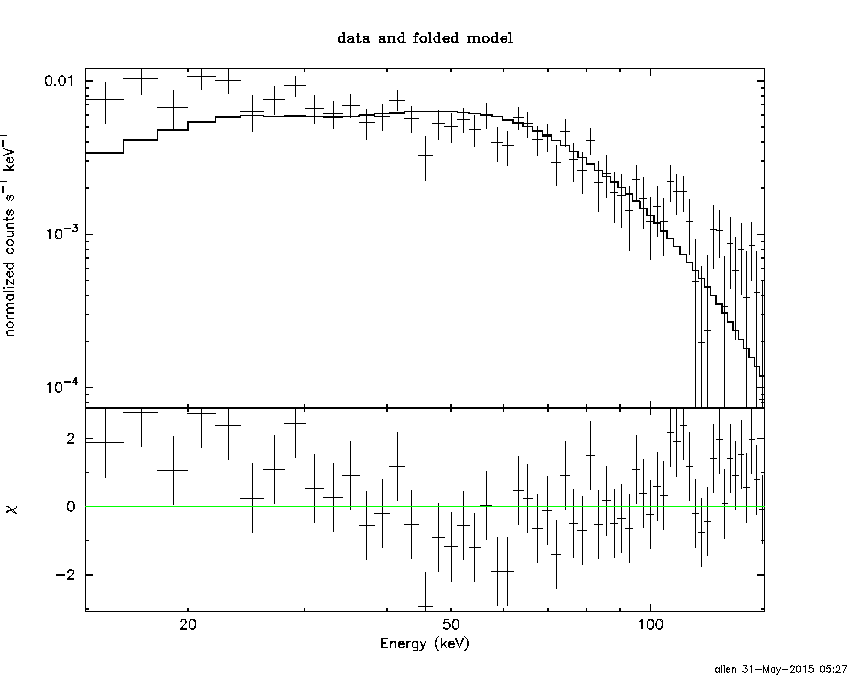
Peak spectrum fit
Power-law model

Time interval is from    0.752 sec. to    1.752 sec.

Spectral model in power-law:
------------------------------------------------------------
Parameters  : value       lower 90%   higher 90%
Photon index: 0.988378     ( -0.0999745   0.0989733 )
Norm@50keV  : 3.21506E-02    ( -0.0018103   0.00180728 )
------------------------------------------------------------
#Fit statistic : Chi-Squared =          47.07 using 59 PHA bins.
# Reduced chi-squared =         0.8259 for     57 degrees of freedom
# Null hypothesis probability =   8.228669e-01

Photon flux (15-150 keV)    in 1 sec: 3.69984 ( -0.211016  0.210512 ) ph/cm2/s
Energy fluence (15-150 keV)             : 3.48987e-07 ( -2.17224e-08  2.20172e-08 ) ergs/cm2
Cutoff power-law model

Time interval is from    0.752 sec. to    1.752 sec.
Spectral model in the cutoff power-law:
------------------------------------------------------------
Parameters  : value       lower 90%   higher 90%
Photon index: 0.799313     ( -0.407337   0.234812 )
Epeak [keV] : 366.373      ( -366.374 -366.374 )
Norm@50keV  : 3.90403E-02    ( -0.00822051   0.0193895 )
------------------------------------------------------------
#Fit statistic : Chi-Squared =          46.35 using 59 PHA bins.
# Reduced chi-squared =         0.8277 for     56 degrees of freedom
# Null hypothesis probability =   8.175752e-01

Photon flux (15-150 keV)    in 1 sec: 3.67224 ( -0.21758  0.21731 ) ph/cm2/s
Energy fluence (15-150 keV)             : 3.46292e-07 ( -2.2964e-08  2.2807e-08 ) ergs/cm2
Band function

Time interval is from    0.752 sec. to    1.752 sec.

Spectral model in the Band function:
------------------------------------------------------------
Parameters  : value       lower 90%   higher 90%
alpha       : -0.788414   ( 0.817437   5.81363 )
beta        : -1.18005    ( 1.19216   0.288346 )
Epeak [keV] : 343.196      ( -343.36 -343.36 )
Norm@50keV   : 3.95776E-02    ( -0.00875706   0 )
------------------------------------------------------------
#Fit statistic : Chi-Squared =          46.34 using 59 PHA bins.
# Reduced chi-squared =         0.8425 for     55 degrees of freedom
# Null hypothesis probability =   7.908178e-01

Photon flux (15-150 keV)    in 1 sec:  (    ) ph/cm2/s
Energy fluence (15-150 keV)             : 0 ( 0  0 ) ergs/cm2
Single BB
Spectral model blackbody:
------------------------------------------------------------
Parameters  : value    Lower 90%  Upper 90%
kT [keV]    : 22.2594  (-1.71489  1.91316)
R^2/D10^2   : 0.128305  (-0.0287972   0.0363081)
(R is the radius in km and D10 is the distance to the source in units of 10 kpc)
------------------------------------------------------------
#Fit statistic : Chi-Squared =          97.10 using 59 PHA bins.
# Reduced chi-squared =          1.703 for     57 degrees of freedom
# Null hypothesis probability =   7.375013e-04

Energy  Fluence     90% Error
[keV]   [erg/cm2]   [erg/cm2]
15- 25  1.170e-08   1.335e-09
25- 50  6.231e-08   5.085e-09
50-150  2.307e-07   2.070e-08
15-150  3.047e-07   2.305e-08
Thermal bremsstrahlung (OTTB)
Spectral model: thermal bremsstrahlung
------------------------------------------------------------
Parameters  : value         Lower 90%    Upper 90%
kT [keV]    : 199.362       (      )
Norm        : 14.7620       (     )
------------------------------------------------------------
#Fit statistic : Chi-Squared =         130.88 using 59 PHA bins.
# Reduced chi-squared =         2.2962 for     57 degrees of freedom
# Null hypothesis probability =   9.672013e-08

Energy  Fluence     90% Error
[keV]   [erg/cm2]   [erg/cm2]
15- 25  3.676e-08   2.450e-09
25- 50  7.071e-08   5.445e-09
50-150  1.551e-07   3.437e-08
15-150  2.625e-07   4.130e-08
Double BB
Spectral model: bbodyrad<1> + bbodyrad<2>
------------------------------------------------------------
Parameters  : value         Lower 90%    Upper 90%
kT1 [keV]   : 7.99271        (-1.99017      2.68413)
R1^2/D10^2  : 1.61375        (-0.899837      2.49767)
kT2 [keV]   : 33.8733        (-5.72179      12.0962)
R2^2/D10^2  : 3.05198E-02    (-0.0185593   0.0251475)
------------------------------------------------------------
#Fit statistic : Chi-Squared =          47.52 using 59 PHA bins.
# Reduced chi-squared =         0.8640 for     55 degrees of freedom
# Null hypothesis probability =   7.530295e-01

Energy  Fluence     90% Error
[keV]   [erg/cm2]   [erg/cm2]
15- 25  2.370e-08   7.295e-09
25- 50  6.531e-08   1.476e-08
50-150  2.592e-07   6.390e-08
15-150  3.482e-07   6.840e-08
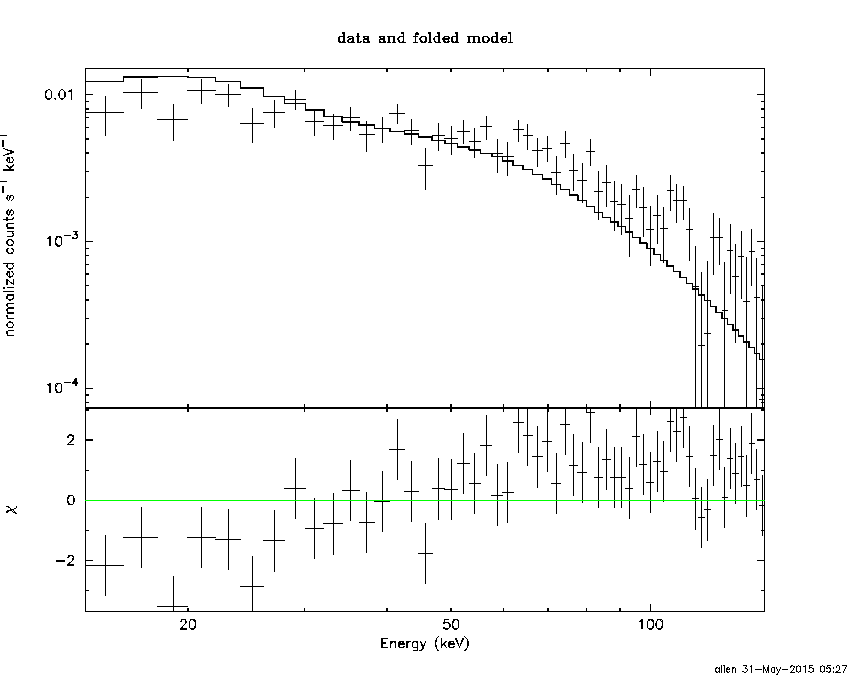
Pre-slew spectrum (Pre-slew PHA with pre-slew DRM)
Power-law model

Spectral model in power-law:
------------------------------------------------------------
Parameters  : value       lower 90%   higher 90%
Photon index: 1.22056     ( -0.0750866   0.0746609 )
Norm@50keV  : 6.06161E-03    ( -0.000242344   0.000242243 )
------------------------------------------------------------
#Fit statistic : Chi-Squared =          36.97 using 59 PHA bins.
# Reduced chi-squared =         0.6486 for     57 degrees of freedom
# Null hypothesis probability =   9.817472e-01

Photon flux (15-150 keV)    in 32.86 sec: 0.713636 ( -0.0301567  0.0302508 ) ph/cm2/s
Energy fluence (15-150 keV)             : 2.00927e-06 ( -8.73774e-08  8.77398e-08 ) ergs/cm2
Cutoff power-law model
Spectral model in the cutoff power-law:
------------------------------------------------------------
Parameters  : value       lower 90%   higher 90%
Photon index: 1.12801     ( -0.303181   0.0883694 )
Epeak [keV] : 490.227      ( -700.608 -884.143 )
Norm@50keV  : 6.67611E-03    ( -0.000522996   0.00221925 )
------------------------------------------------------------
#Fit statistic : Chi-Squared =          37.08 using 59 PHA bins.
# Reduced chi-squared =         0.6621 for     56 degrees of freedom
# Null hypothesis probability =   9.759774e-01

Photon flux (15-150 keV)    in 32.86 sec: 0.710352 ( -0.028315  0.03437 ) ph/cm2/s
Energy fluence (15-150 keV)             : 2.00329e-06 ( -9.40979e-08  9.233e-08 ) ergs/cm2
Band function

Spectral model in the Band function:
------------------------------------------------------------
Parameters  : value       lower 90%   higher 90%
alpha       : -0.870275   ( 0.875342   0.875342 )
beta        : -1.25732    ( 1.25716   0.104914 )
Epeak [keV] : 122.220      ( -125.368 -125.368 )
Norm@50keV   : 9.69649E-03    ( -0.00365344   0 )
------------------------------------------------------------
#Fit statistic : Chi-Squared =          36.51 using 59 PHA bins.
# Reduced chi-squared =         0.6638 for     55 degrees of freedom
# Null hypothesis probability =   9.741858e-01

Photon flux (15-150 keV)    in 32.86 sec:  (    ) ph/cm2/s
Energy fluence (15-150 keV)             : 0 ( 0  0 ) ergs/cm2
S(25-50 keV) vs. S(50-100 keV) plot

S(25-50 keV)  = 7.28e-07
S(50-100 keV) = 1.26e-06
T90 vs. Hardness ratio plot
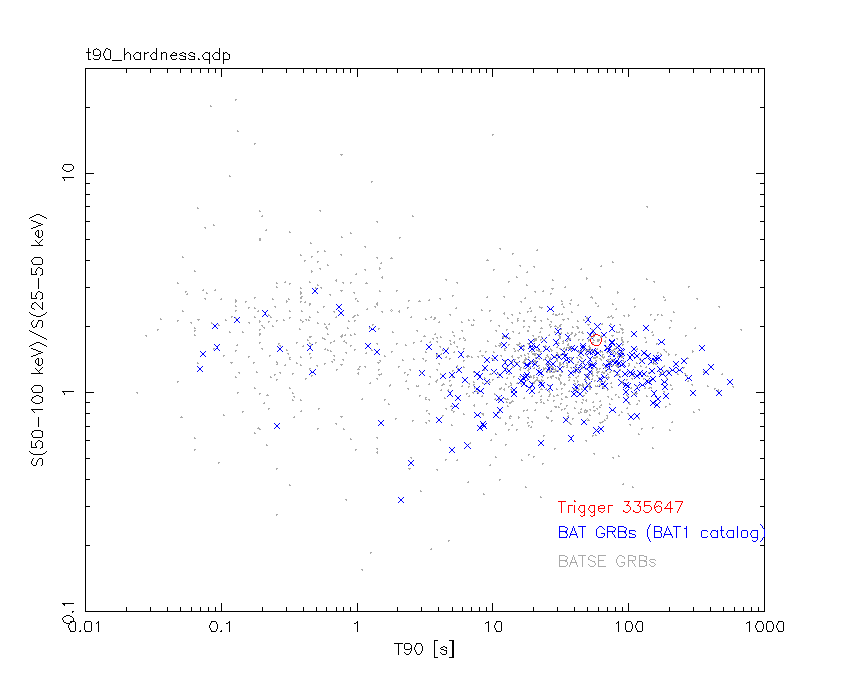
T90                                   = 57.6480000019073 sec.
Hardness ratio (energy fluence ratio) = 1.73077
Color vs. Color plot
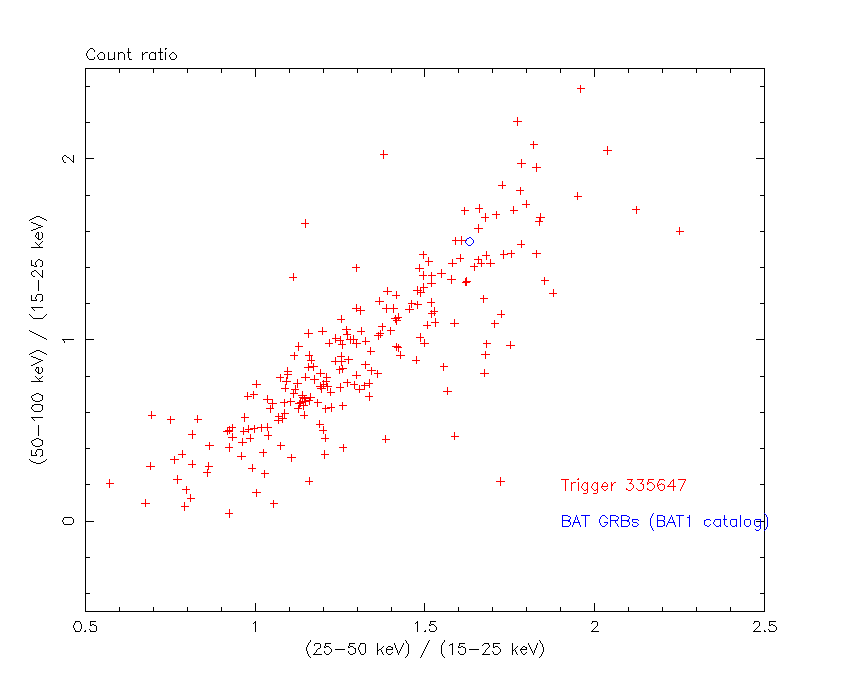
Count Ratio  (25-50 keV) / (15-25 keV) = 1.63116
Count Ratio (50-100 keV) / (15-25 keV) = 1.54356
Mask shadow pattern
IMX = 1.060888796040506E-01, IMY = -3.468050399278023E-01
TIME vs. PHA plot around the trigger time

Blue+Cyan dotted lines: Time interval of the scaled map
From 0.000000 to 1.024000
TIME vs. DetID plot around the trigger time
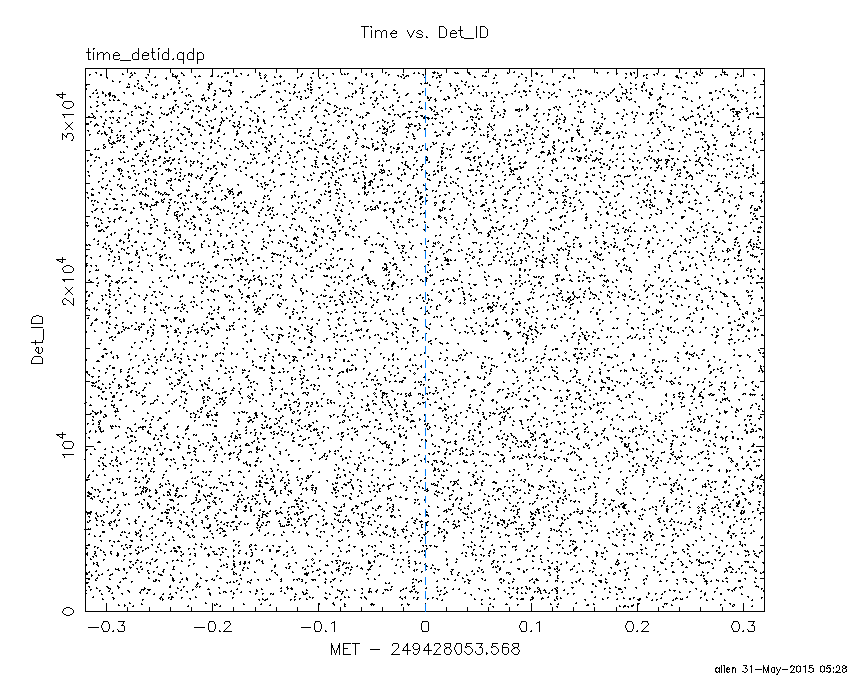
Blue+Cyan dotted lines: Time interval of the scaled map
From 0.000000 to 1.024000
100 us light curve (15-350 keV)
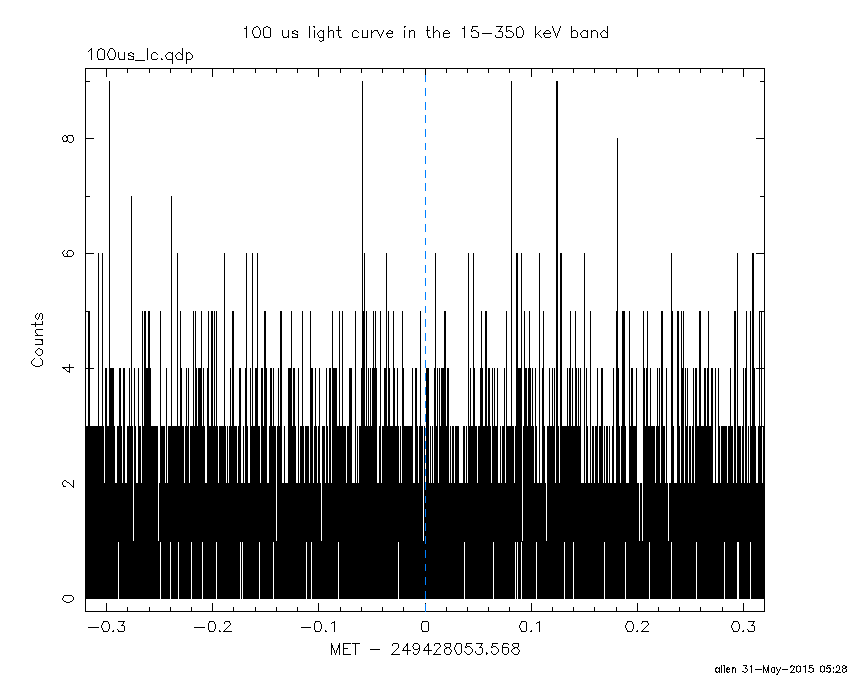
Blue+Cyan dotted lines: Time interval of the scaled map
From 0.000000 to 1.024000
Spacecraft aspect plot

Bright source in the pre-burst/pre-slew/post-slew images
Pre-burst image of 15-350 keV band
Time interval of the image:
-239.568000 -21.528000

# RAcent  DECcent POSerr Theta    Phi  PeakCts   SNR AngSep     Name
#  [deg]    [deg]    ['] [deg]  [deg]                   [']
254.4596  35.3451    1.8  37.7  -50.9   2.0342   6.2    0.2	Her X-1
288.7955  10.9375    0.9  28.3 -126.0   3.1915  13.4    0.5	GRS 1915+105
299.5955  35.2014    0.2   2.2 -107.0  10.3016  57.9    0.3	Cyg X-1
308.0033  40.7576    0.0   6.4   76.2   0.2146   1.2   12.7	Cyg X-3
326.2592  38.1915    5.1  19.6  105.0   0.5146   2.2    8.8	Cyg X-2
284.2068  28.4307    2.3  16.8  -88.0   0.9480   5.1 ------	UNKNOWN
309.7055 -20.9728    2.1  58.3 -162.2   5.9991   5.5 ------	UNKNOWN
291.0328  -5.5561    2.9  43.5 -137.9   1.4537   3.9 ------	UNKNOWN
268.9864   7.9682    3.1  41.3  -99.4   3.7500   3.7 ------	UNKNOWN
Pre-slew background subtracted image of 15-350 keV band
Time interval of the image:
-21.528000 11.332620

# RAcent  DECcent POSerr Theta    Phi  PeakCts   SNR AngSep     Name
#  [deg]    [deg]    ['] [deg]  [deg]                   [']
254.3911  35.2643   14.6  37.8  -51.0  -0.0908  -0.8    5.7	Her X-1
288.8460  11.1288    0.0  28.1 -126.0  -0.1852  -2.3   11.3	GRS 1915+105
299.5976  35.2045   15.7   2.2 -107.0  -0.0453  -0.7    0.4	Cyg X-1
307.9237  41.0555   13.2   6.5   73.7   0.0560   0.9   10.5	Cyg X-3
325.9962  38.2462    8.7  19.4  104.9   0.1010   1.3    9.4	Cyg X-2
323.5221  48.7139    0.3  19.9   73.0   3.0674  39.9 ------	UNKNOWN
266.2687  63.1668    2.3  34.0   -1.1   0.4182   5.0 ------	UNKNOWN
251.0601  25.9289    3.0  44.0  -62.7   1.0741   3.8 ------	UNKNOWN
Post-slew image of 15-350 keV band
Time interval of the image:
54.932600 542.442000

# RAcent  DECcent POSerr Theta    Phi  PeakCts   SNR AngSep     Name
#  [deg]    [deg]    ['] [deg]  [deg]                   [']
299.5977  35.2082    0.6  22.2  -97.4  21.9516  20.9    0.5	Cyg X-1
308.3573  40.9380   10.5  13.2  -99.1   1.0661   1.1   11.2	Cyg X-3
326.2009  38.4068    5.2  10.5 -170.5   2.0889   2.2    5.3	Cyg X-2
247.9721  73.7942    2.9  39.9   -3.7   5.7144   4.0 ------	UNKNOWN
337.5949  -5.5138    2.3  55.6 -175.8  22.2924   5.1 ------	UNKNOWN
286.2697  20.1329    2.8  41.2  -99.2  16.4374   4.1 ------	UNKNOWN
Plot creation:
Sun May 31 05:29:01 EDT 2015