Special notes of this burst
Image
Pre-slew 15.0-350.0 keV image (Event data)
#   RAcent    DECcent   POSerr    Theta     Phi              Peak Cts       SNR   Name
   20.8011    38.1226   0.0060    31.9507  -179.9777         3.7020476     32.348 TRIG_00335895

Foreground time interval of the image:
 -4.699  62.660 (delta_t =  67.359 [sec])
Background time interval of the image:
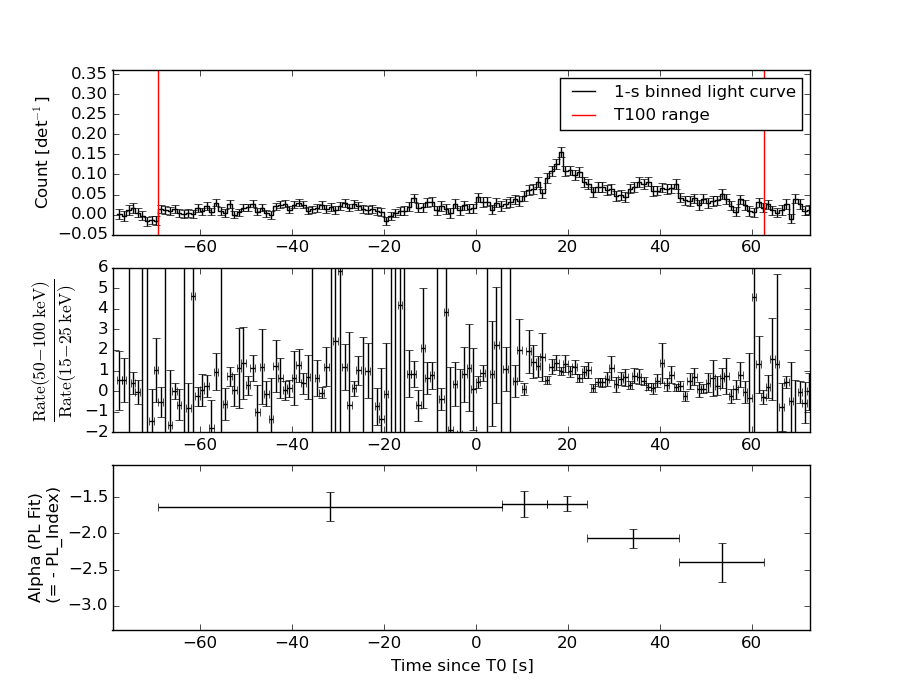
Lightcurves
Notes:
- 1) The mask-weighted light curves are using the flight position.
- 2) Multiple plots of different time binning/intervals are shown to cover all scenarios of short/long GRBs, rate/image triggers, and real/false positives.
- 3) For all the mask-weighted lightcurves, the y-axis units are counts/sec/det where a det is 0.4 x 0.4 = 0.16 sq cm.
- 4) The verticle lines correspond to following: green dotted lines are T50 interval, black dotted lines are T90 interval, blue solid line(s) is a spacecraft slew start time, and orange solid line(s) is a spacecraft slew end time.
- 5) Time of each bin is in the middle of the bin.
1 s binning
From T0-310 s to T0+310 s
From T100_start - 20 s to T100_end + 30 s
Full time interval
64 ms binning
Full time interval
From T100_start to T100_end
From T0-5 sec to T0+5 sec

16 ms binning
From T100_start-5 s to T100_start+5 s
Blue+Cyan dotted lines: Time interval of the scaled map
From 0.000000 to 88.000000
8 ms binning
From T100_start-3 s to T100_start+3 s
Blue+Cyan dotted lines: Time interval of the scaled map
From 0.000000 to 88.000000
2 ms binning
From T100_start-1 s to T100_start+1 s
Blue+Cyan dotted lines: Time interval of the scaled map
From 0.000000 to 88.000000
SN=5 or 10 sec. binning (whichever binning is satisfied first)
SN=5 or 10 sec. binning (T < 200 sec)
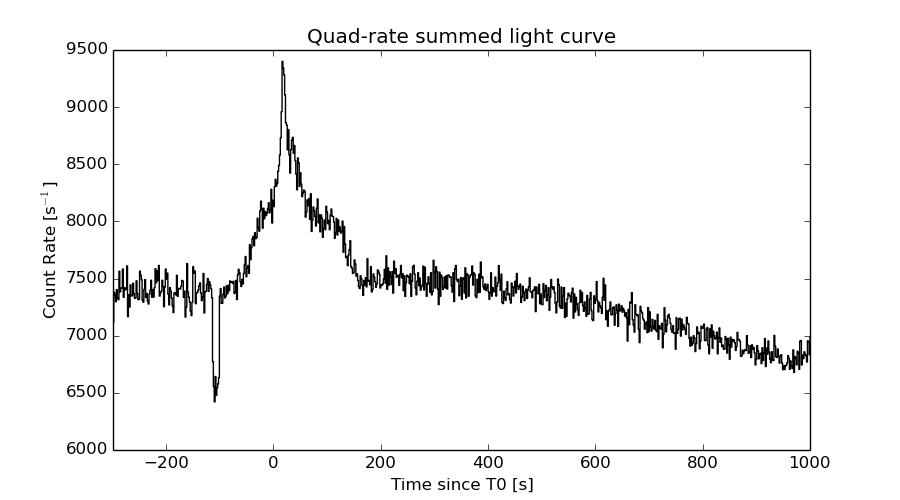
Quad-rate summed light curves (from T0-300s to T0+1000s)
Spectral Evolution
Spectra
Notes:
- 1) The fitting includes the systematic errors.
- 2) When the burst includes telescope slew time periods, the fitting uses an average response file made from multiple 5-s response files through out the slew time plus single time preiod for the non-slew times, and weighted by the total counts in the corresponding time period using addrmf. An average response file is needed becuase a spectral fit using the pre-slew DRM will introduce some errors in both a spectral shape and a normalization if the PHA file contains a lot of the slew/post-slew time interval.
- 3) For fits to more complicated models (e.g. a power-law over a cutoff power-law), the BAT team has decided to require a chi-square improvement of more than 6 for each extra dof.
Time averaged spectrum fit using the average DRM
Power-law model

Time interval is from  -68.980 sec. to   62.660 sec.

Spectral model in power-law:
------------------------------------------------------------
Parameters  : value       lower 90%   higher 90%
Photon index: 1.87892     ( -0.0858404   0.0871586 )
Norm@50keV  : 2.10925E-03    ( -0.000113307   0.000112545 )
------------------------------------------------------------
#Fit statistic : Chi-Squared =          69.73 using 59 PHA bins.
# Reduced chi-squared =          1.223 for     57 degrees of freedom
# Null hypothesis probability =   1.200132e-01

Photon flux (15-150 keV)    in 131.6 sec: 0.300028 ( -0.0146553  0.0146729 ) ph/cm2/s
Energy fluence (15-150 keV)             : 2.55176e-06 ( -1.36224e-07  1.37088e-07 ) ergs/cm2
Cutoff power-law model

Time interval is from  -68.980 sec. to   62.660 sec.
Spectral model in the cutoff power-law:
------------------------------------------------------------
Parameters  : value       lower 90%   higher 90%
Photon index: 0.939746     ( -0.443983   0.401037 )
Epeak [keV] : 49.8558      ( -5.35506 8.06493 )
Norm@50keV  : 6.91096E-03    ( -0.00271486   0.00516203 )
------------------------------------------------------------
#Fit statistic : Chi-Squared =          51.62 using 59 PHA bins.
# Reduced chi-squared =         0.9218 for     56 degrees of freedom
# Null hypothesis probability =   6.411172e-01

Photon flux (15-150 keV)    in 131.6 sec: 0.286245 ( -0.015617  0.015642 ) ph/cm2/s
Energy fluence (15-150 keV)             : 2.33685e-06 ( -1.55564e-07  1.59091e-07 ) ergs/cm2
Band function
Time interval is from  -68.980 sec. to   62.660 sec.

Spectral model in the Band function:
------------------------------------------------------------
Parameters  : value       lower 90%   higher 90%
alpha       : -0.939698   ( -0.296094   0.356326 )
beta        : -10.00000    ( 10   20 )
Epeak [keV] : 49.8466      ( -5.33905 6.34354 )
Norm@50keV   : 6.91098E-03    ( -0.00199058   0.00516765 )
------------------------------------------------------------
#Fit statistic : Chi-Squared =          51.62 using 59 PHA bins.
# Reduced chi-squared =         0.9386 for     55 degrees of freedom
# Null hypothesis probability =   6.044785e-01

Photon flux (15-150 keV)    in 131.6 sec:  (    ) ph/cm2/s
Energy fluence (15-150 keV)             : 2.40442e-06 ( -2.4035e-06  -1.4909e-07 ) ergs/cm2
Single BB

Spectral model blackbody:
------------------------------------------------------------
Parameters  : value    Lower 90%  Upper 90%
kT [keV]    : 11.2850  (-0.612319  0.649213)
R^2/D10^2   : 8.86868E-02  (-0.0170861   0.0210813)
(R is the radius in km and D10 is the distance to the source in units of 10 kpc)
------------------------------------------------------------
#Fit statistic : Chi-Squared =         107.68 using 59 PHA bins.
# Reduced chi-squared =         1.8891 for     57 degrees of freedom
# Null hypothesis probability =   5.755061e-05

Energy  Fluence     90% Error
[keV]   [erg/cm2]   [erg/cm2]
15- 25  3.120e-07   2.652e-08
25- 50  9.113e-07   4.461e-08
50-150  6.683e-07   7.297e-08
15-150  1.892e-06   1.092e-07
Thermal bremsstrahlung (OTTB)

Spectral model: thermal bremsstrahlung
------------------------------------------------------------
Parameters  : value         Lower 90%    Upper 90%
kT [keV]    : 82.7889       (-12.2866      15.9668)
Norm        : 1.39221       (-0.102009     0.111967)
------------------------------------------------------------
#Fit statistic : Chi-Squared =          53.66 using 59 PHA bins.
# Reduced chi-squared =         0.9414 for     57 degrees of freedom
# Null hypothesis probability =   6.011179e-01

Energy  Fluence     90% Error
[keV]   [erg/cm2]   [erg/cm2]
15- 25  4.764e-07   3.158e-08
25- 50  7.906e-07   3.987e-08
50-150  1.142e-06   1.341e-07
15-150  2.409e-06   1.494e-07
Double BB
Spectral model: bbodyrad<1> + bbodyrad<2>
------------------------------------------------------------
Parameters  : value         Lower 90%    Upper 90%
kT1 [keV]   : 6.72292        (-1.17532      1.25221)
R1^2/D10^2  : 0.393776        (-0.149431      0.304204)
kT2 [keV]   : 19.3248        (-3.34932      5.78651)
R2^2/D10^2  : 7.64064E-03    (-0.0047286   0.00909196)
------------------------------------------------------------
#Fit statistic : Chi-Squared =          49.68 using 59 PHA bins.
# Reduced chi-squared =         0.9033 for     55 degrees of freedom
# Null hypothesis probability =   6.773187e-01

Energy  Fluence     90% Error
[keV]   [erg/cm2]   [erg/cm2]
15- 25  4.335e-07   1.197e-07
25- 50  8.125e-07   1.720e-07
50-150  1.048e-06   4.776e-07
15-150  2.294e-06   6.193e-07
Peak spectrum fit
Power-law model
Time interval is from   17.596 sec. to   18.596 sec.

Spectral model in power-law:
------------------------------------------------------------
Parameters  : value       lower 90%   higher 90%
Photon index: 1.52253     ( -0.22706   0.230223 )
Norm@50keV  : 1.01785E-02    ( -0.00137304   0.00135987 )
------------------------------------------------------------
#Fit statistic : Chi-Squared =          58.20 using 59 PHA bins.
# Reduced chi-squared =          1.021 for     57 degrees of freedom
# Null hypothesis probability =   4.308826e-01

Photon flux (15-150 keV)    in 1 sec: 1.27853 ( -0.16874  0.169051 ) ph/cm2/s
Energy fluence (15-150 keV)             : 9.62134e-08 ( -1.40881e-08  1.4248e-08 ) ergs/cm2
Cutoff power-law model

Time interval is from   17.596 sec. to   18.596 sec.
Spectral model in the cutoff power-law:
------------------------------------------------------------
Parameters  : value       lower 90%   higher 90%
Photon index: 1.46687     ( -0.962227   1.24824 )
Epeak [keV] : 476.502      ( -476.714 -476.714 )
Norm@50keV  : 1.08724E-02    ( -0.00854378   0.0222831 )
------------------------------------------------------------
#Fit statistic : Chi-Squared =          58.19 using 59 PHA bins.
# Reduced chi-squared =          1.039 for     56 degrees of freedom
# Null hypothesis probability =   3.947177e-01

Photon flux (15-150 keV)    in 1 sec: 1.27571 ( -0.17345  0.17092 ) ph/cm2/s
Energy fluence (15-150 keV)             : 9.58702e-08 ( -1.53138e-08  1.45168e-08 ) ergs/cm2
Band function
Time interval is from   17.596 sec. to   18.596 sec.

Spectral model in the Band function:
------------------------------------------------------------
Parameters  : value       lower 90%   higher 90%
alpha       : -1.32622   ( 1.23169   5.9311 )
beta        : -1.60518    ( 1.55177   0.255878 )
Epeak [keV] : 159.077      ( -89.1646 -89.1646 )
Norm@50keV   : 1.29370E-02    ( -0.00409094   0 )
------------------------------------------------------------
#Fit statistic : Chi-Squared =          58.14 using 59 PHA bins.
# Reduced chi-squared =          1.057 for     55 degrees of freedom
# Null hypothesis probability =   3.603869e-01

Photon flux (15-150 keV)    in 1 sec:  (    ) ph/cm2/s
Energy fluence (15-150 keV)             : 0 ( 0  0 ) ergs/cm2
Single BB
Spectral model blackbody:
------------------------------------------------------------
Parameters  : value    Lower 90%  Upper 90%
kT [keV]    : 14.4339  (-2.324  2.9147)
R^2/D10^2   : 0.163440  (-0.0779875   0.1419)
(R is the radius in km and D10 is the distance to the source in units of 10 kpc)
------------------------------------------------------------
#Fit statistic : Chi-Squared =          73.94 using 59 PHA bins.
# Reduced chi-squared =          1.297 for     57 degrees of freedom
# Null hypothesis probability =   6.514960e-02

Energy  Fluence     90% Error
[keV]   [erg/cm2]   [erg/cm2]
15- 25  7.169e-09   1.771e-09
25- 50  2.747e-08   5.565e-09
50-150  3.826e-08   1.070e-08
15-150  7.290e-08   1.468e-08
Thermal bremsstrahlung (OTTB)
Spectral model: thermal bremsstrahlung
------------------------------------------------------------
Parameters  : value         Lower 90%    Upper 90%
kT [keV]    : 199.363       (-84.8516      -199.363)
Norm        : 5.22450       (-0.67543     0.676279)
------------------------------------------------------------
#Fit statistic : Chi-Squared =          58.46 using 59 PHA bins.
# Reduced chi-squared =          1.026 for     57 degrees of freedom
# Null hypothesis probability =   4.215691e-01

Energy  Fluence     90% Error
[keV]   [erg/cm2]   [erg/cm2]
15- 25  1.301e-08   7.300e-09
25- 50  2.503e-08   1.392e-08
50-150  5.489e-08   3.014e-08
15-150  9.292e-08   5.125e-08
Double BB
Spectral model: bbodyrad<1> + bbodyrad<2>
------------------------------------------------------------
Parameters  : value         Lower 90%    Upper 90%
kT1 [keV]   : 6.75715        (-3.25525      4.9334)
R1^2/D10^2  : 1.51126        (-1.18053      17.4074)
kT2 [keV]   : 26.0460        (-9.17105      -26.319)
R2^2/D10^2  : 1.65090E-02    (-0.0156714   0.0637243)
------------------------------------------------------------
#Fit statistic : Chi-Squared =          59.94 using 59 PHA bins.
# Reduced chi-squared =          1.090 for     55 degrees of freedom
# Null hypothesis probability =   3.013134e-01

Energy  Fluence     90% Error
[keV]   [erg/cm2]   [erg/cm2]
15- 25  1.257e-08   7.130e-09
25- 50  2.465e-08   1.293e-08
50-150  5.703e-08   3.239e-08
15-150  9.425e-08   5.055e-08
Pre-slew spectrum (Pre-slew PHA with pre-slew DRM)
Power-law model

Spectral model in power-law:
------------------------------------------------------------
Parameters  : value       lower 90%   higher 90%
Photon index: 1.92300     ( -0.0849418   0.0863739 )
Norm@50keV  : 3.24546E-03    ( -0.000173524   0.000172349 )
------------------------------------------------------------
#Fit statistic : Chi-Squared =          70.91 using 59 PHA bins.
# Reduced chi-squared =          1.244 for     57 degrees of freedom
# Null hypothesis probability =   1.018471e-01

Photon flux (15-150 keV)    in 67.36 sec: 0.470372 ( -0.0228231  0.0228548 ) ph/cm2/s
Energy fluence (15-150 keV)             : 2.01049e-06 ( -1.05319e-07  1.0595e-07 ) ergs/cm2
Cutoff power-law model

Spectral model in the cutoff power-law:
------------------------------------------------------------
Parameters  : value       lower 90%   higher 90%
Photon index: 0.857823     ( -0.455368   0.411501 )
Epeak [keV] : 47.5560      ( -4.61761 6.06521 )
Norm@50keV  : 1.23841E-02    ( -0.00494844   0.00949796 )
------------------------------------------------------------
#Fit statistic : Chi-Squared =          48.28 using 59 PHA bins.
# Reduced chi-squared =         0.8621 for     56 degrees of freedom
# Null hypothesis probability =   7.588772e-01

Photon flux (15-150 keV)    in 67.36 sec: 0.445654 ( -0.024394  0.024441 ) ph/cm2/s
Energy fluence (15-150 keV)             : 1.83191e-06 ( -1.18237e-07  1.21093e-07 ) ergs/cm2
Band function

Spectral model in the Band function:
------------------------------------------------------------
Parameters  : value       lower 90%   higher 90%
alpha       : -0.798644   ( -0.441078   1.45595 )
beta        : -3.05320    ( 3.05337   0.839563 )
Epeak [keV] : 46.8105      ( -11.1351 6.27669 )
Norm@50keV   : 1.34600E-02    ( -0.00576226   0.114011 )
------------------------------------------------------------
#Fit statistic : Chi-Squared =          47.91 using 59 PHA bins.
# Reduced chi-squared =         0.8712 for     55 degrees of freedom
# Null hypothesis probability =   7.398094e-01

Photon flux (15-150 keV)    in 67.36 sec:  (    ) ph/cm2/s
Energy fluence (15-150 keV)             : 1.83984e-06 ( -1.83937e-06  -1.20904e-07 ) ergs/cm2
S(25-50 keV) vs. S(50-100 keV) plot

S(25-50 keV)  = 7.39e-07
S(50-100 keV) = 8.04e-07
T90 vs. Hardness ratio plot
T90                                   = 102.315999984741 sec.
Hardness ratio (energy fluence ratio) = 1.08796
Color vs. Color plot
Count Ratio  (25-50 keV) / (15-25 keV) = 1.2518
Count Ratio (50-100 keV) / (15-25 keV) = 0.697659
Mask shadow pattern

IMX = -6.236743208708314E-01, IMY = 2.432135093438287E-04
TIME vs. PHA plot around the trigger time
Blue+Cyan dotted lines: Time interval of the scaled map
From 0.000000 to 88.000000
TIME vs. DetID plot around the trigger time
Blue+Cyan dotted lines: Time interval of the scaled map
From 0.000000 to 88.000000
100 us light curve (15-350 keV)

Blue+Cyan dotted lines: Time interval of the scaled map
From 0.000000 to 88.000000
Spacecraft aspect plot

Bright source in the pre-burst/pre-slew/post-slew images
Pre-burst image of 15-350 keV band
Time interval of the image:
Pre-slew background subtracted image of 15-350 keV band
Time interval of the image:
-4.699400 62.660000

# RAcent  DECcent POSerr Theta    Phi  PeakCts   SNR AngSep     Name
#  [deg]    [deg]    ['] [deg]  [deg]                   [']
 83.6358  22.0018    0.4  23.7   -2.7   2.7939  29.3    0.8	Crab
359.4898  30.4090    2.6  50.6  173.2   1.1856   4.4 ------	UNKNOWN
 94.4180   9.8346    2.5  39.2    4.9   0.6306   4.6 ------	UNKNOWN
 20.8011  38.1226    0.4  32.0 -180.0   3.7022  32.3 ------	UNKNOWN
 41.9482  61.6059    2.3  31.6 -127.6   0.5893   4.9 ------	UNKNOWN
 86.6948  70.2221    3.1  41.0  -98.2   1.6340   3.7 ------	UNKNOWN
Post-slew image of 15-350 keV band
Time interval of the image:
184.500600 958.400610

# RAcent  DECcent POSerr Theta    Phi  PeakCts   SNR AngSep     Name
#  [deg]    [deg]    ['] [deg]  [deg]                   [']
 68.7617  43.7887    2.6  36.2   54.8   3.6799   4.4 ------	UNKNOWN
 18.2083 -14.0697    2.0  52.3  172.5   8.1536   5.7 ------	UNKNOWN
 29.5799  30.1600    2.6  10.8  124.5   1.5897   4.5 ------	UNKNOWN
313.0949  57.7400    3.4  47.0  -53.1   8.8916   3.4 ------	UNKNOWN
330.3390  32.7161    3.4  40.9  -92.4   8.6043   3.4 ------	UNKNOWN
337.7811  12.8726    3.1  45.7 -122.4   8.8050   3.8 ------	UNKNOWN
Plot creation:
Sun May 31 05:25:05 EDT 2015