Special notes of this burst
Image
Pre-slew 15.0-350.0 keV image (Event data)
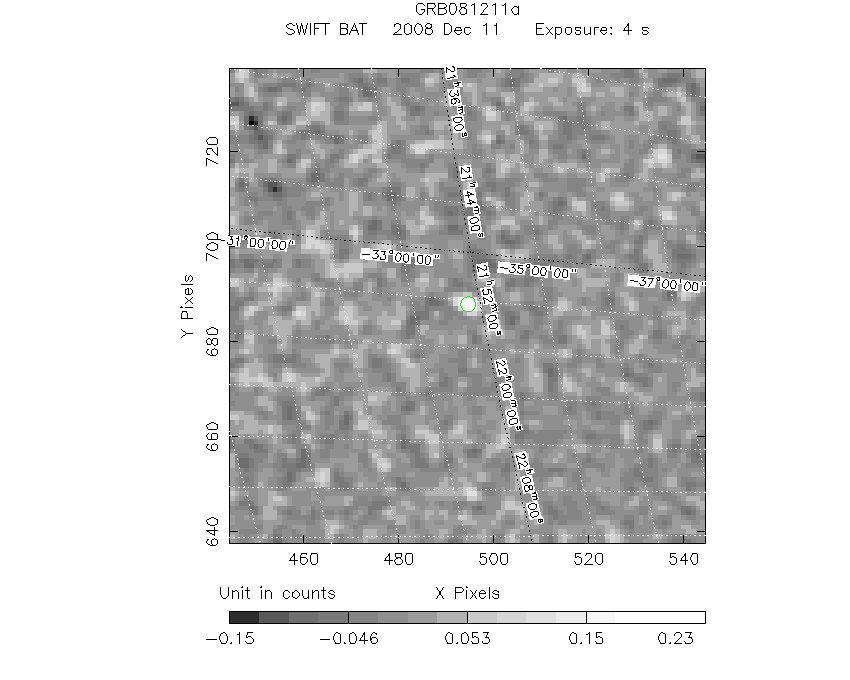
#   RAcent    DECcent   POSerr    Theta     Phi              Peak Cts       SNR   Name
  328.0799   -33.8179   0.0206    42.6960   -28.7501         0.2867987      9.296 TRIG_00337115

Foreground time interval of the image:
 -1.080   2.752 (delta_t =   3.832 [sec])
Background time interval of the image:
-207.915  -1.080 (delta_t = 206.835 [sec])
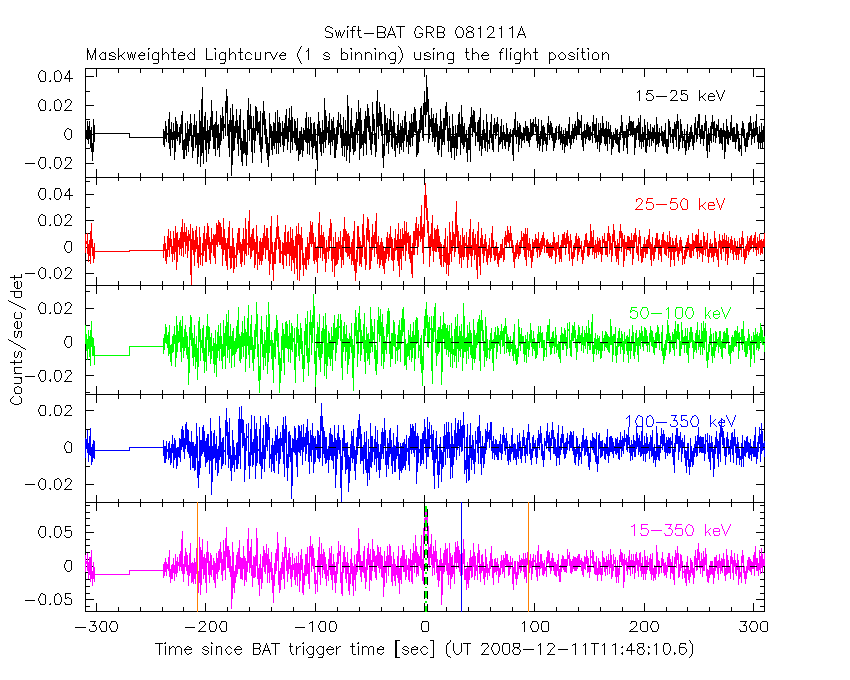
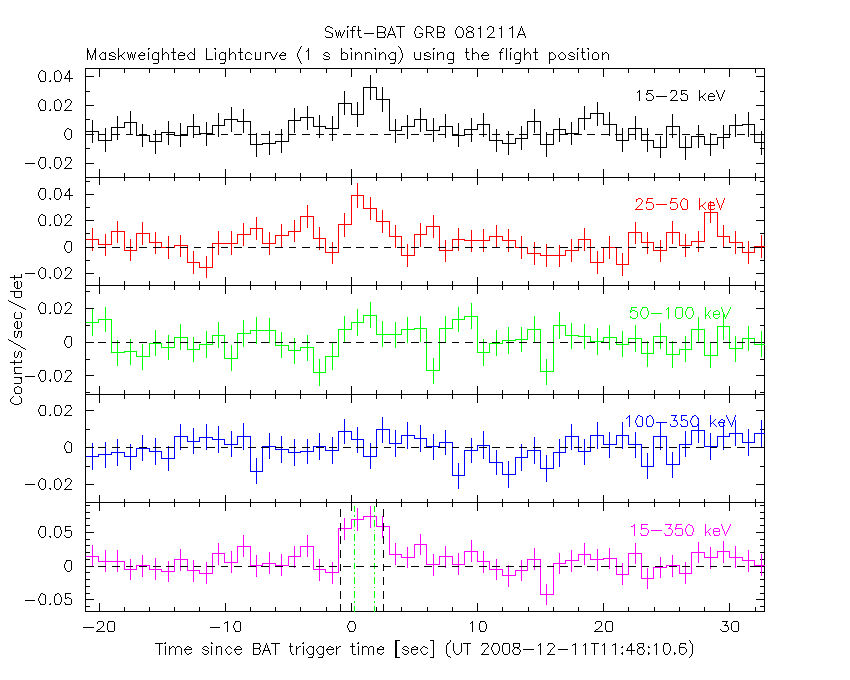
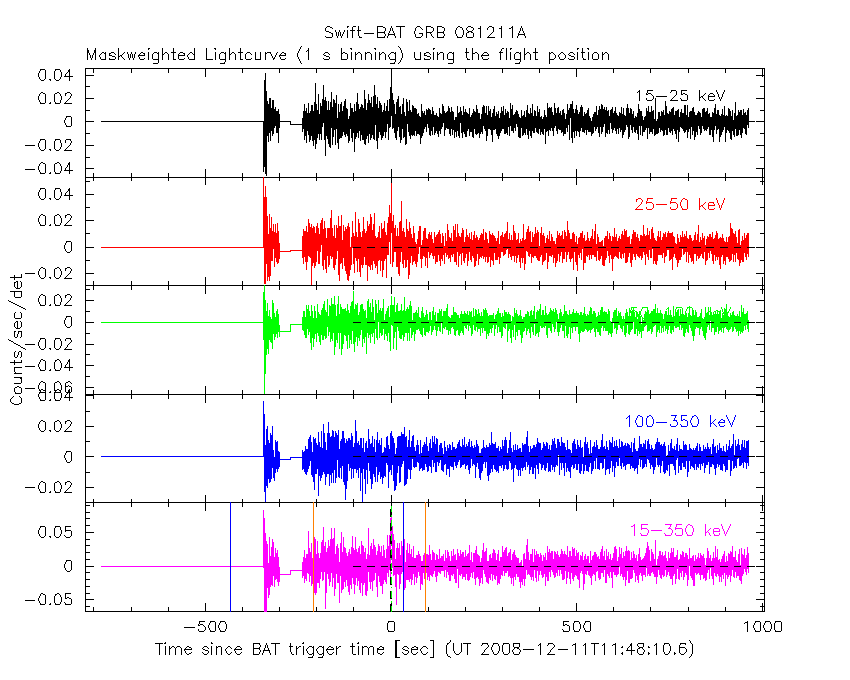
Lightcurves
Notes:
- 1) The mask-weighted light curves are using the flight position.
- 2) Multiple plots of different time binning/intervals are shown to cover all scenarios of short/long GRBs, rate/image triggers, and real/false positives.
- 3) For all the mask-weighted lightcurves, the y-axis units are counts/sec/det where a det is 0.4 x 0.4 = 0.16 sq cm.
- 4) The verticle lines correspond to following: green dotted lines are T50 interval, black dotted lines are T90 interval, blue solid line(s) is a spacecraft slew start time, and orange solid line(s) is a spacecraft slew end time.
- 5) Time of each bin is in the middle of the bin.
1 s binning
From T0-310 s to T0+310 s
From T100_start - 20 s to T100_end + 30 s
Full time interval
64 ms binning
Full time interval
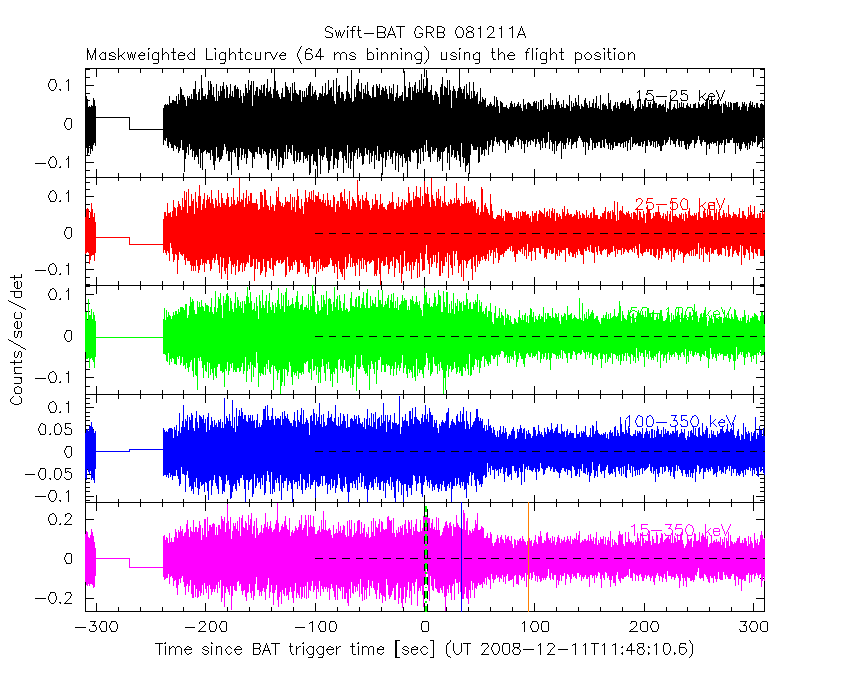
From T100_start to T100_end
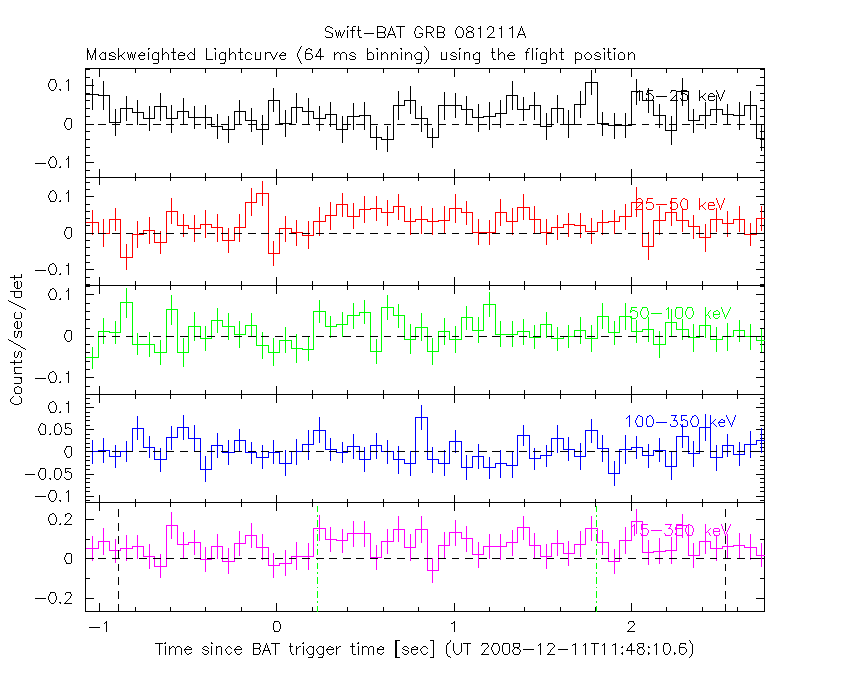
From T0-5 sec to T0+5 sec

16 ms binning
From T100_start-5 s to T100_start+5 s
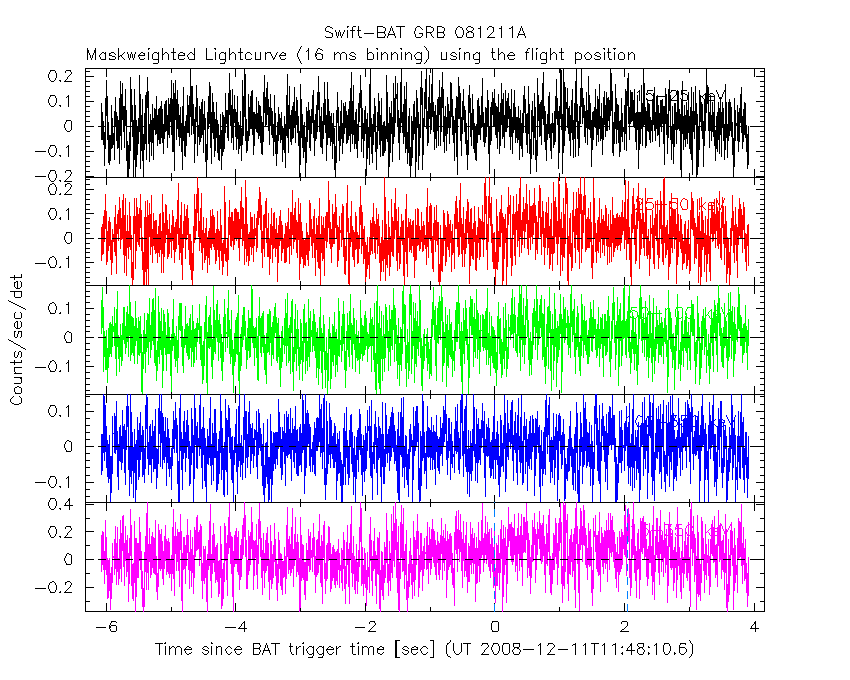
Blue+Cyan dotted lines: Time interval of the scaled map
From 0.000000 to 2.048000
8 ms binning
From T100_start-3 s to T100_start+3 s
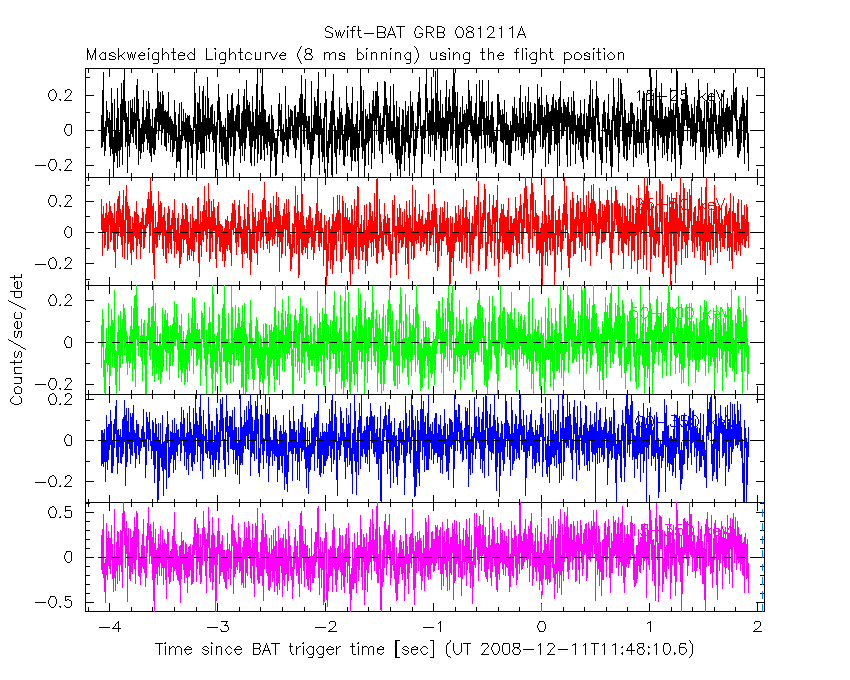
Blue+Cyan dotted lines: Time interval of the scaled map
From 0.000000 to 2.048000
2 ms binning
From T100_start-1 s to T100_start+1 s
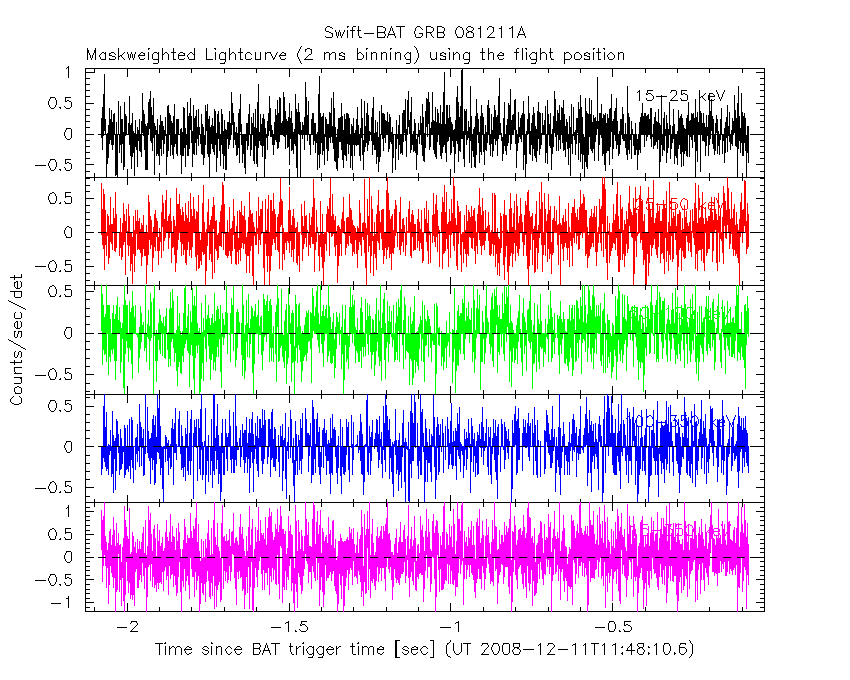
Blue+Cyan dotted lines: Time interval of the scaled map
From 0.000000 to 2.048000
SN=5 or 10 sec. binning (whichever binning is satisfied first)
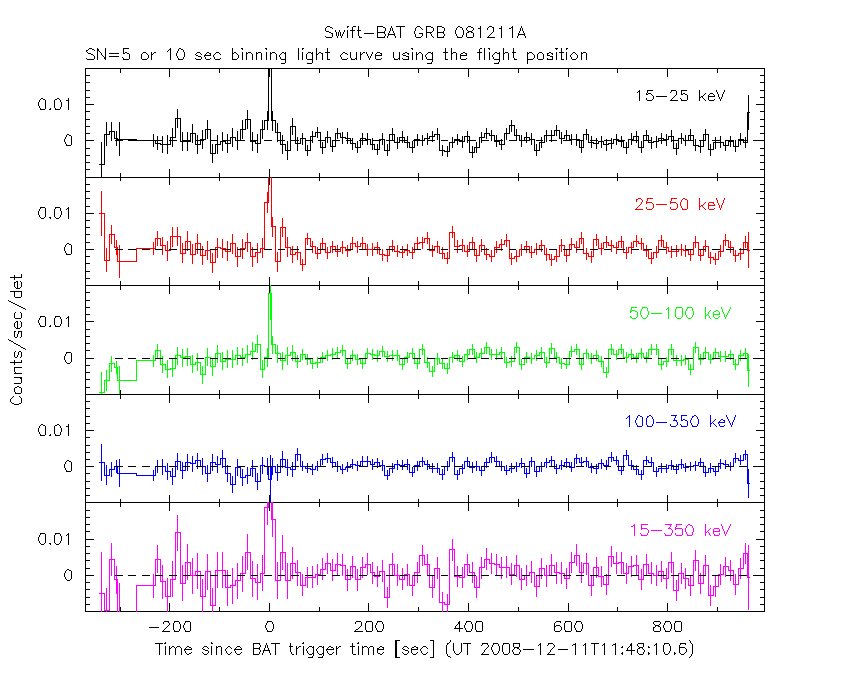
SN=5 or 10 sec. binning (T < 200 sec)

Quad-rate summed light curves (from T0-300s to T0+1000s)

Spectral Evolution
Spectra
Notes:
- 1) The fitting includes the systematic errors.
- 2) When the burst includes telescope slew time periods, the fitting uses an average response file made from multiple 5-s response files through out the slew time plus single time preiod for the non-slew times, and weighted by the total counts in the corresponding time period using addrmf. An average response file is needed becuase a spectral fit using the pre-slew DRM will introduce some errors in both a spectral shape and a normalization if the PHA file contains a lot of the slew/post-slew time interval.
- 3) For fits to more complicated models (e.g. a power-law over a cutoff power-law), the BAT team has decided to require a chi-square improvement of more than 6 for each extra dof.
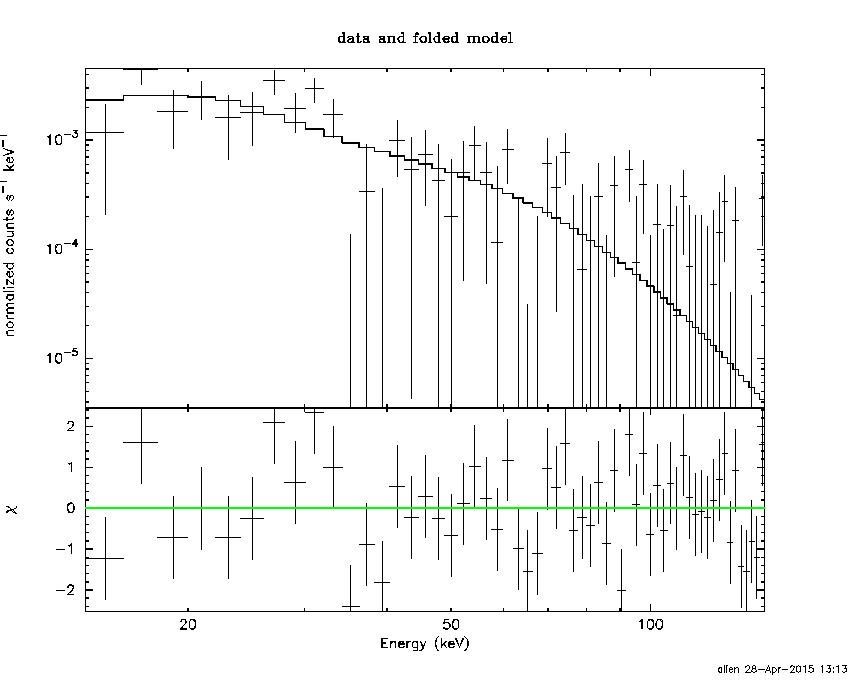
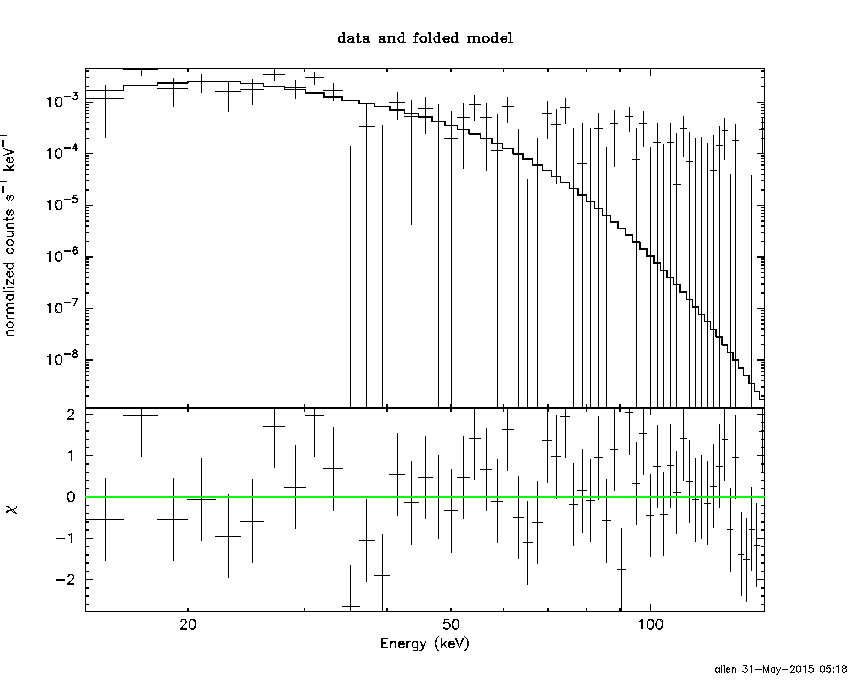
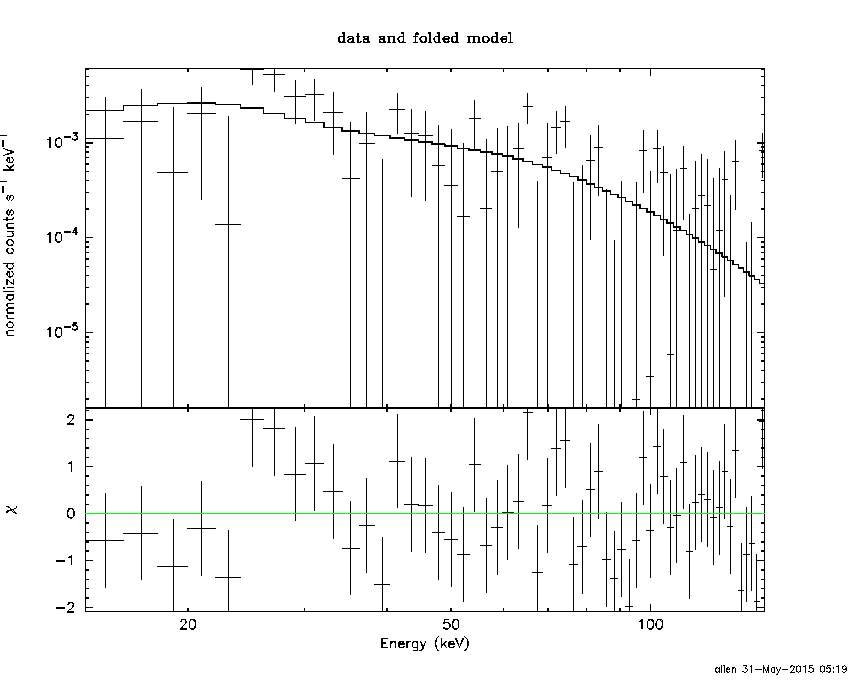
Time averaged spectrum fit using the average DRM
Power-law model

Time interval is from   -1.080 sec. to    2.752 sec.

Spectral model in power-law:
------------------------------------------------------------
Parameters  : value       lower 90%   higher 90%
Photon index: 2.23137     ( -0.364514   0.416454 )
Norm@50keV  : 3.59724E-03    ( -0.00103818   0.00100439 )
------------------------------------------------------------
#Fit statistic : Chi-Squared =          66.42 using 59 PHA bins.
# Reduced chi-squared =          1.165 for     57 degrees of freedom
# Null hypothesis probability =   1.841192e-01

Photon flux (15-150 keV)    in 3.832 sec: 0.605531 ( -0.119341  0.119341 ) ph/cm2/s
Energy fluence (15-150 keV)             : 1.30206e-07 ( -3.10873e-08  3.26e-08 ) ergs/cm2
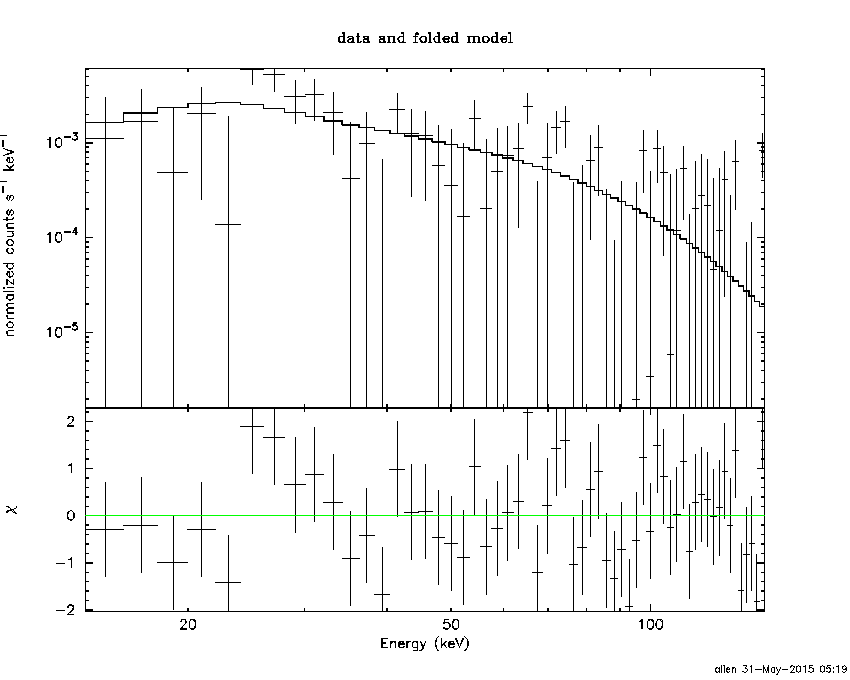
Cutoff power-law model
Time interval is from   -1.080 sec. to    2.752 sec.
Spectral model in the cutoff power-law:
------------------------------------------------------------
Parameters  : value       lower 90%   higher 90%
Photon index: 1.51356     ( -3.52692   0.573629 )
Epeak [keV] : 24.7289      (   )
Norm@50keV  : 1.02110E-02    (     )
------------------------------------------------------------
#Fit statistic : Chi-Squared =          65.85 using 59 PHA bins.
# Reduced chi-squared =          1.176 for     56 degrees of freedom
# Null hypothesis probability =   1.726654e-01

Photon flux (15-150 keV)    in 3.832 sec: 0.594482 ( -0.122134  0.121853 ) ph/cm2/s
Energy fluence (15-150 keV)             : 1.20024e-07 ( -3.60396e-08  3.91481e-08 ) ergs/cm2
Band function

Time interval is from   -1.080 sec. to    2.752 sec.

Spectral model in the Band function:
------------------------------------------------------------
Parameters  : value       lower 90%   higher 90%
alpha       : 2.54426   ( -1.82824   1.81364 )
beta        : -2.82501    ( 9.3715   19.3715 )
Epeak [keV] : 26.4208      ( -11.373 34.5605 )
Norm@50keV   : 9.15386    ( -9.12541   252.138 )
------------------------------------------------------------
#Fit statistic : Chi-Squared =          64.10 using 59 PHA bins.
# Reduced chi-squared =          1.165 for     55 degrees of freedom
# Null hypothesis probability =   1.876040e-01

Photon flux (15-150 keV)    in 3.832 sec:  (    ) ph/cm2/s
Energy fluence (15-150 keV)             : 1.19403e-07 ( 0  0 ) ergs/cm2
Single BB
Spectral model blackbody:
------------------------------------------------------------
Parameters  : value    Lower 90%  Upper 90%
kT [keV]    : 7.46897  (-1.4717  1.91892)
R^2/D10^2   : 0.889286  (-0.538692   1.30039)
(R is the radius in km and D10 is the distance to the source in units of 10 kpc)
------------------------------------------------------------
#Fit statistic : Chi-Squared =          68.36 using 59 PHA bins.
# Reduced chi-squared =          1.199 for     57 degrees of freedom
# Null hypothesis probability =   1.440809e-01

Energy  Fluence     90% Error
[keV]   [erg/cm2]   [erg/cm2]
15- 25  3.251e-08   1.239e-08
25- 50  5.032e-08   2.014e-08
50-150  1.048e-08   6.483e-09
15-150  9.331e-08   3.510e-08
Thermal bremsstrahlung (OTTB)
Spectral model: thermal bremsstrahlung
------------------------------------------------------------
Parameters  : value         Lower 90%    Upper 90%
kT [keV]    : 42.4140       (-17.2474      37.7523)
Norm        : 3.80208       (-1.20768     1.99046)
------------------------------------------------------------
#Fit statistic : Chi-Squared =          65.85 using 59 PHA bins.
# Reduced chi-squared =          1.155 for     57 degrees of freedom
# Null hypothesis probability =   1.973512e-01

Energy  Fluence     90% Error
[keV]   [erg/cm2]   [erg/cm2]
15- 25  3.409e-08   9.105e-09
25- 50  4.598e-08   1.381e-08
50-150  3.788e-08   2.004e-08
15-150  1.179e-07   3.499e-08
Double BB

Spectral model: bbodyrad<1> + bbodyrad<2>
------------------------------------------------------------
Parameters  : value         Lower 90%    Upper 90%
kT1 [keV]   : 6.17504        (-1.87686      1.94138)
R1^2/D10^2  : 1.67362        (-0.838229      4.4491)
kT2 [keV]   : 26.1389        (-15.5271      -26.0496)
R2^2/D10^2  : 3.52056E-03    (-0.0035517   0.138298)
------------------------------------------------------------
#Fit statistic : Chi-Squared =          63.79 using 59 PHA bins.
# Reduced chi-squared =          1.160 for     55 degrees of freedom
# Null hypothesis probability =   1.949268e-01

Energy  Fluence     90% Error
[keV]   [erg/cm2]   [erg/cm2]
15- 25  3.539e-08   2.077e-08
25- 50  4.495e-08   2.516e-08
50-150  4.927e-08   2.943e-08
15-150  1.296e-07   6.750e-08
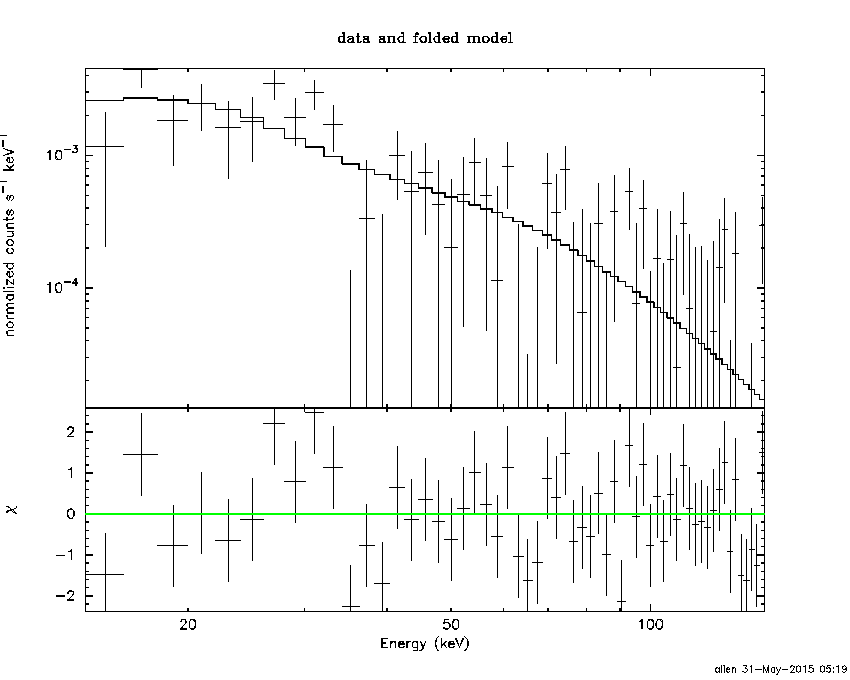
Peak spectrum fit
Power-law model
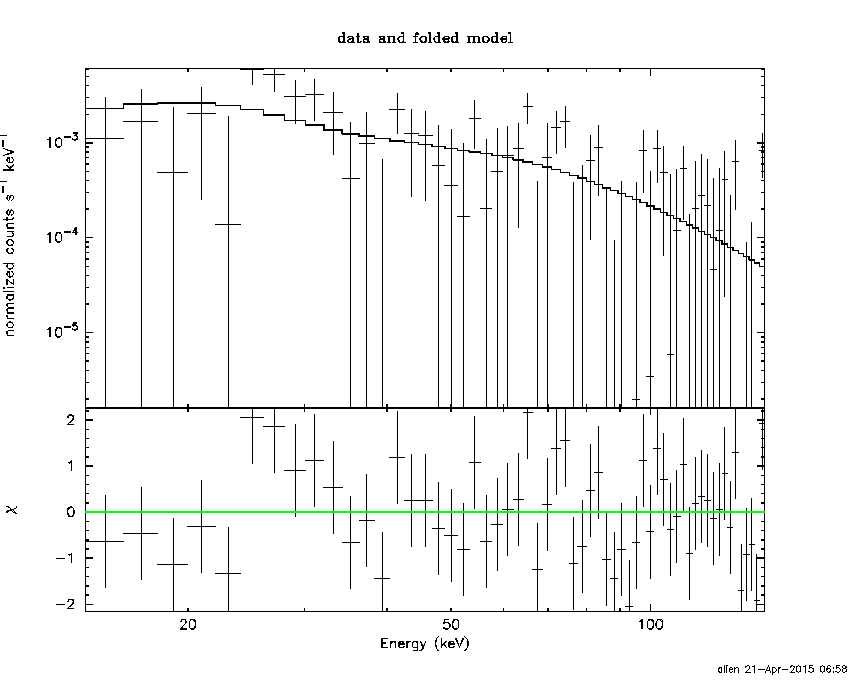
Time interval is from    0.192 sec. to    1.192 sec.

Spectral model in power-law:
------------------------------------------------------------
Parameters  : value       lower 90%   higher 90%
Photon index: 1.63426     ( -0.433065   0.445715 )
Norm@50keV  : 6.27894E-03    ( -0.00179067   0.00176506 )
------------------------------------------------------------
#Fit statistic : Chi-Squared =          62.55 using 59 PHA bins.
# Reduced chi-squared =          1.097 for     57 degrees of freedom
# Null hypothesis probability =   2.858066e-01

Photon flux (15-150 keV)    in 1 sec: 0.815664 ( -0.225873  0.226818 ) ph/cm2/s
Energy fluence (15-150 keV)             : 5.8494e-08 ( -1.7214e-08  1.76068e-08 ) ergs/cm2
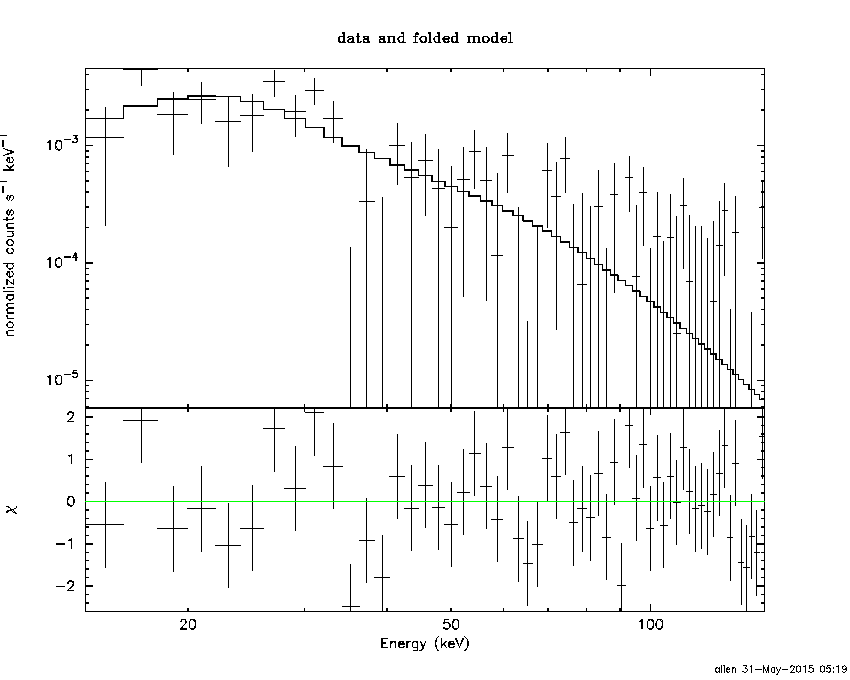
Cutoff power-law model
Time interval is from    0.192 sec. to    1.192 sec.
Spectral model in the cutoff power-law:
------------------------------------------------------------
Parameters  : value       lower 90%   higher 90%
Photon index: 0.217606     ( -3.00769   1.86981 )
Epeak [keV] : 56.9169      ( -13.4544 -56.917 )
Norm@50keV  : 3.74553E-02    ( -0.0374413   2.06413 )
------------------------------------------------------------
#Fit statistic : Chi-Squared =          60.93 using 59 PHA bins.
# Reduced chi-squared =          1.088 for     56 degrees of freedom
# Null hypothesis probability =   3.030331e-01

Photon flux (15-150 keV)    in 1 sec: 0.787046 ( -0.226772  0.229584 ) ph/cm2/s
Energy fluence (15-150 keV)             : 5.2811e-08 ( -1.75929e-08  1.92389e-08 ) ergs/cm2
Band function

Time interval is from    0.192 sec. to    1.192 sec.

Spectral model in the Band function:
------------------------------------------------------------
Parameters  : value       lower 90%   higher 90%
alpha       : 4.98292   ( -14.5085   -4.98292 )
beta        : -2.19566    ( -1.12387   0.65639 )
Epeak [keV] : 32.1192      ( -12.3167 8.14559 )
Norm@50keV   : 181.102    ( -46.7564   977.919 )
------------------------------------------------------------
#Fit statistic : Chi-Squared =          58.70 using 59 PHA bins.
# Reduced chi-squared =          1.067 for     55 degrees of freedom
# Null hypothesis probability =   3.413524e-01

Photon flux (15-150 keV)    in 1 sec:  (    ) ph/cm2/s
Energy fluence (15-150 keV)             : 5.55811e-08 ( -5.55741e-08  -1.68738e-08 ) ergs/cm2
Single BB

Spectral model blackbody:
------------------------------------------------------------
Parameters  : value    Lower 90%  Upper 90%
kT [keV]    : 12.6162  (-3.40672  4.78863)
R^2/D10^2   : 0.177419  (-0.124522   0.387372)
(R is the radius in km and D10 is the distance to the source in units of 10 kpc)
------------------------------------------------------------
#Fit statistic : Chi-Squared =          62.24 using 59 PHA bins.
# Reduced chi-squared =          1.092 for     57 degrees of freedom
# Null hypothesis probability =   2.950122e-01

Energy  Fluence     90% Error
[keV]   [erg/cm2]   [erg/cm2]
15- 25  5.989e-09   3.611e-09
25- 50  1.996e-08   1.150e-08
50-150  1.972e-08   1.248e-08
15-150  4.567e-08   2.526e-08
Thermal bremsstrahlung (OTTB)
Spectral model: thermal bremsstrahlung
------------------------------------------------------------
Parameters  : value         Lower 90%    Upper 90%
kT [keV]    : 145.906       (-87.9619      -142.116)
Norm        : 3.41169       (-0.992918     1.52504)
------------------------------------------------------------
#Fit statistic : Chi-Squared =          61.72 using 59 PHA bins.
# Reduced chi-squared =          1.083 for     57 degrees of freedom
# Null hypothesis probability =   3.112394e-01

Energy  Fluence     90% Error
[keV]   [erg/cm2]   [erg/cm2]
15- 25  8.782e-09   5.180e-09
25- 50  1.621e-08   9.345e-09
50-150  3.163e-08   2.018e-08
15-150  5.663e-08   3.322e-08
Double BB
Spectral model: bbodyrad<1> + bbodyrad<2>
------------------------------------------------------------
Parameters  : value         Lower 90%    Upper 90%
kT1 [keV]   : 8.03184        (-8.16358      6.94636)
R1^2/D10^2  : 0.604433        (-0.594608      -0.594608)
kT2 [keV]   : 23.2413        (-23.9132      -23.9132)
R2^2/D10^2  : 1.16343E-02    (-0.0104699   0.304201)
------------------------------------------------------------
#Fit statistic : Chi-Squared =          60.20 using 59 PHA bins.
# Reduced chi-squared =          1.095 for     55 degrees of freedom
# Null hypothesis probability =   2.931581e-01

Energy  Fluence     90% Error
[keV]   [erg/cm2]   [erg/cm2]
15- 25  8.205e-09   5.160e-09
25- 50  1.865e-08   1.111e-08
50-150  2.825e-08   1.642e-08
15-150  5.511e-08   2.941e-08
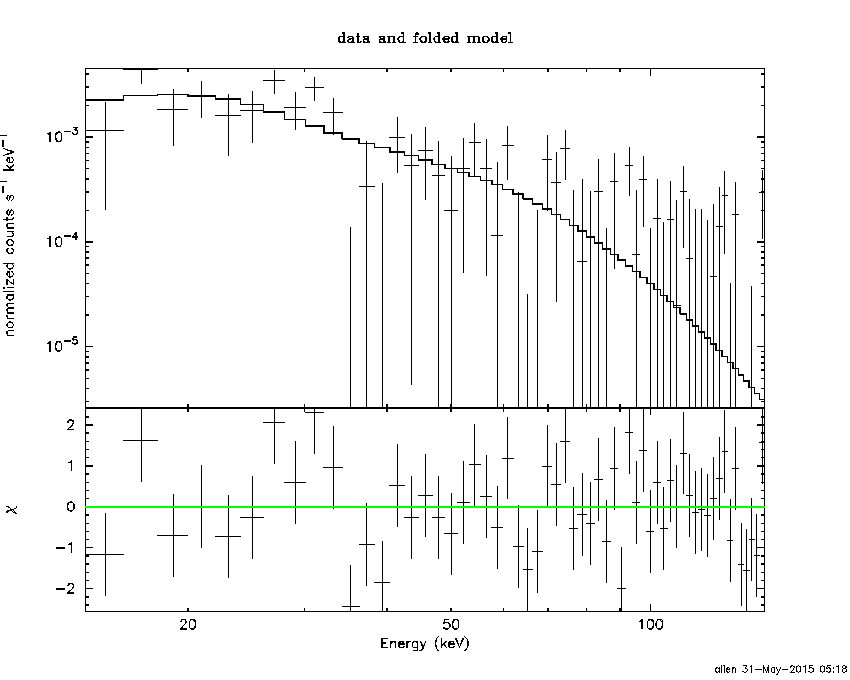
Pre-slew spectrum (Pre-slew PHA with pre-slew DRM)
Power-law model
Spectral model in power-law:
------------------------------------------------------------
Parameters  : value       lower 90%   higher 90%
Photon index: 2.23137     ( -0.364514   0.416454 )
Norm@50keV  : 3.59724E-03    ( -0.00103818   0.00100439 )
------------------------------------------------------------
#Fit statistic : Chi-Squared =          66.42 using 59 PHA bins.
# Reduced chi-squared =          1.165 for     57 degrees of freedom
# Null hypothesis probability =   1.841192e-01

Photon flux (15-150 keV)    in 3.832 sec: 0.605531 ( -0.119341  0.119341 ) ph/cm2/s
Energy fluence (15-150 keV)             : 1.30206e-07 ( -3.10873e-08  3.26e-08 ) ergs/cm2
Cutoff power-law model

Spectral model in the cutoff power-law:
------------------------------------------------------------
Parameters  : value       lower 90%   higher 90%
Photon index: 1.51356     ( -3.52692   0.573629 )
Epeak [keV] : 24.7289      (   )
Norm@50keV  : 1.02110E-02    (     )
------------------------------------------------------------
#Fit statistic : Chi-Squared =          65.85 using 59 PHA bins.
# Reduced chi-squared =          1.176 for     56 degrees of freedom
# Null hypothesis probability =   1.726654e-01

Photon flux (15-150 keV)    in 3.832 sec: 0.594482 ( -0.122134  0.121853 ) ph/cm2/s
Energy fluence (15-150 keV)             : 1.20024e-07 ( -3.60396e-08  3.91481e-08 ) ergs/cm2
Band function
Spectral model in the Band function:
------------------------------------------------------------
Parameters  : value       lower 90%   higher 90%
alpha       : 2.54426   ( -1.82824   1.81364 )
beta        : -2.82501    ( 9.3715   19.3715 )
Epeak [keV] : 26.4208      ( -11.373 34.5605 )
Norm@50keV   : 9.15386    ( -9.12542   252.153 )
------------------------------------------------------------
#Fit statistic : Chi-Squared =          64.10 using 59 PHA bins.
# Reduced chi-squared =          1.165 for     55 degrees of freedom
# Null hypothesis probability =   1.876040e-01

Photon flux (15-150 keV)    in 3.832 sec:  (    ) ph/cm2/s
Energy fluence (15-150 keV)             : 1.19403e-07 ( 0  0 ) ergs/cm2
S(25-50 keV) vs. S(50-100 keV) plot
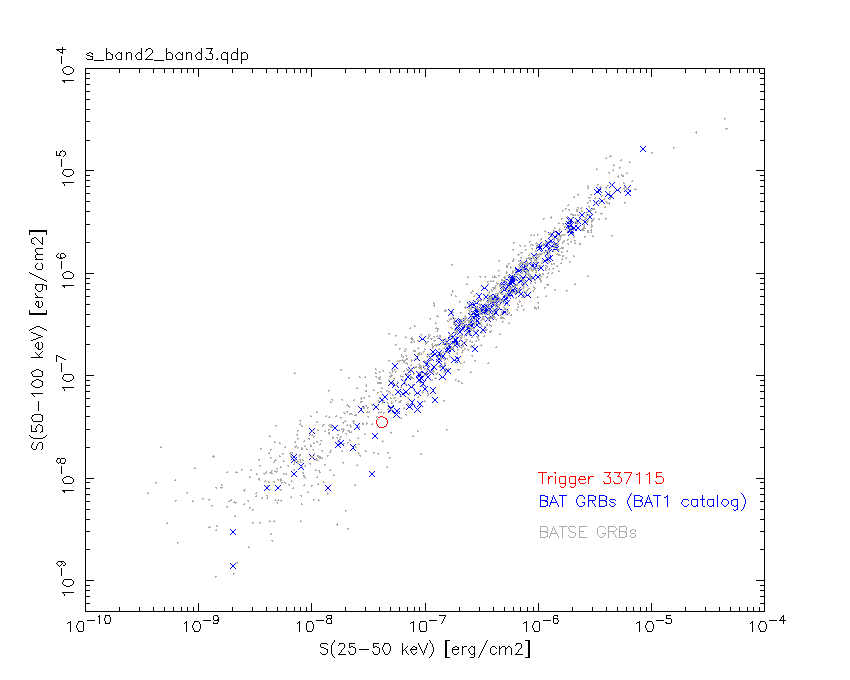
S(25-50 keV)  = 4.15e-08
S(50-100 keV) = 3.54e-08
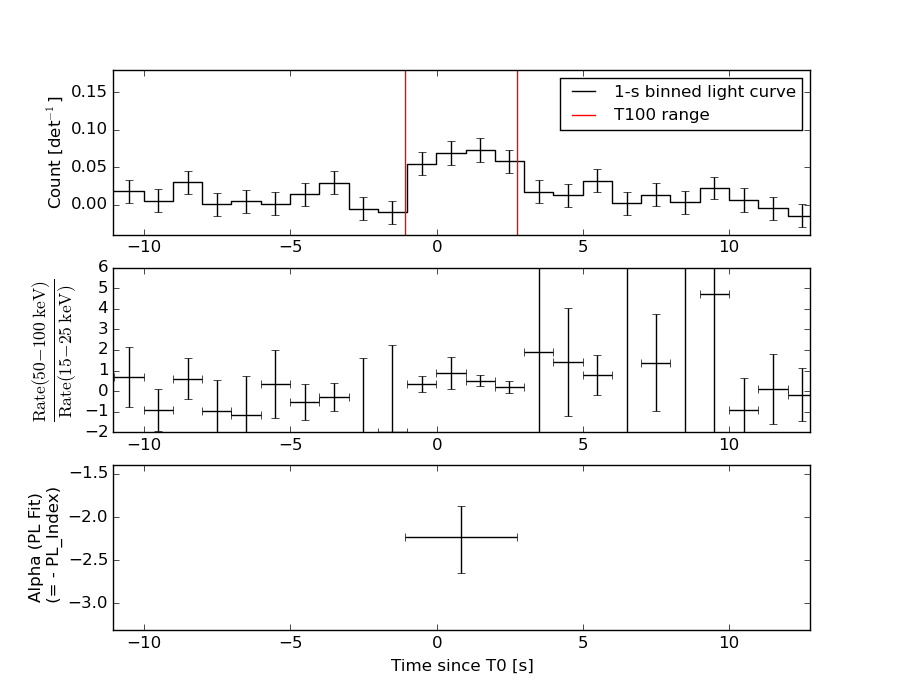
T90 vs. Hardness ratio plot
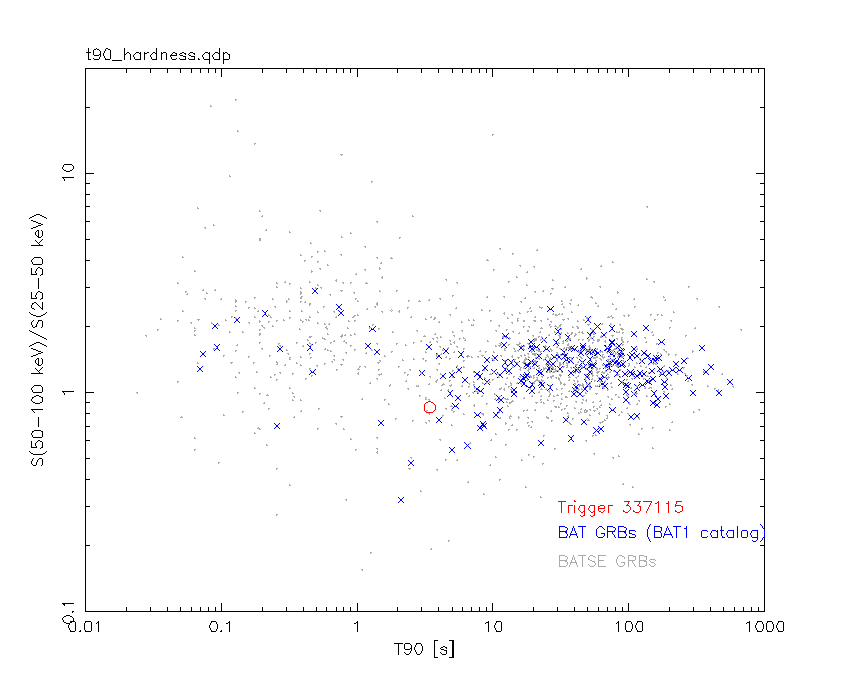
T90                                   = 3.42399999499321 sec.
Hardness ratio (energy fluence ratio) = 0.853012
Color vs. Color plot

Count Ratio  (25-50 keV) / (15-25 keV) = 1.10051
Count Ratio (50-100 keV) / (15-25 keV) = 0.418926
Mask shadow pattern

IMX = 8.089071085815778E-01, IMY = 4.437827325362833E-01
TIME vs. PHA plot around the trigger time
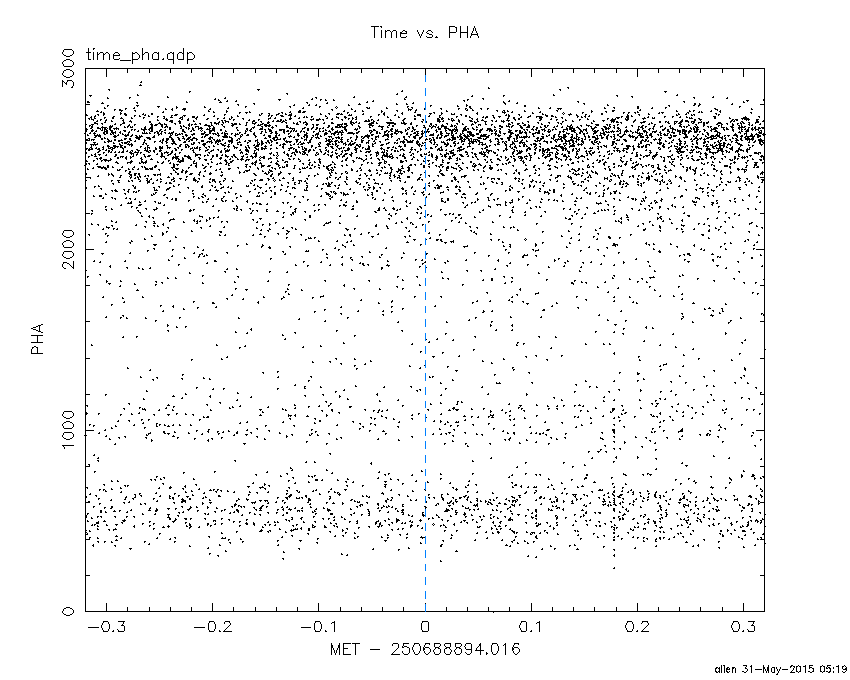
Blue+Cyan dotted lines: Time interval of the scaled map
From 0.000000 to 2.048000
TIME vs. DetID plot around the trigger time
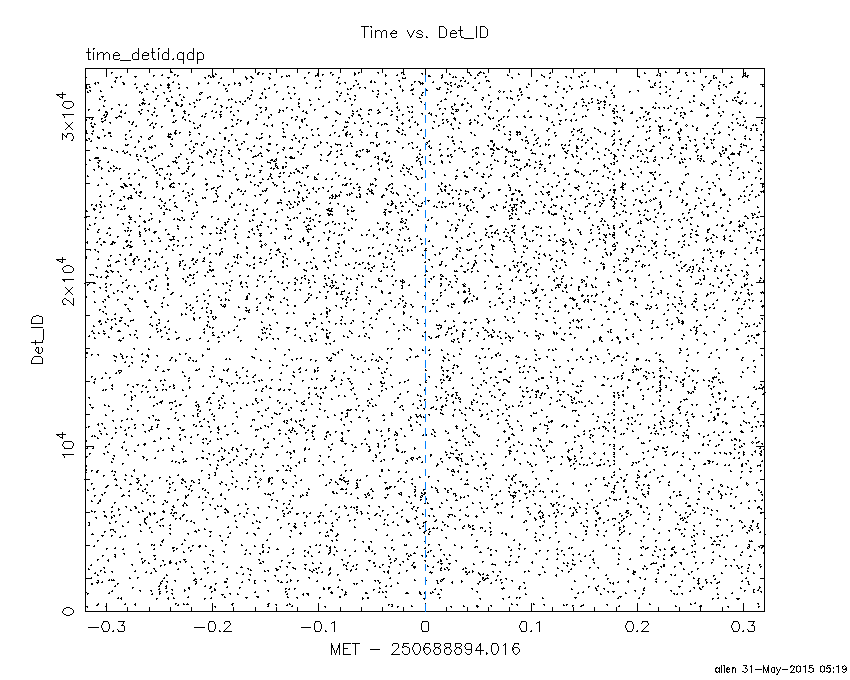
Blue+Cyan dotted lines: Time interval of the scaled map
From 0.000000 to 2.048000
100 us light curve (15-350 keV)
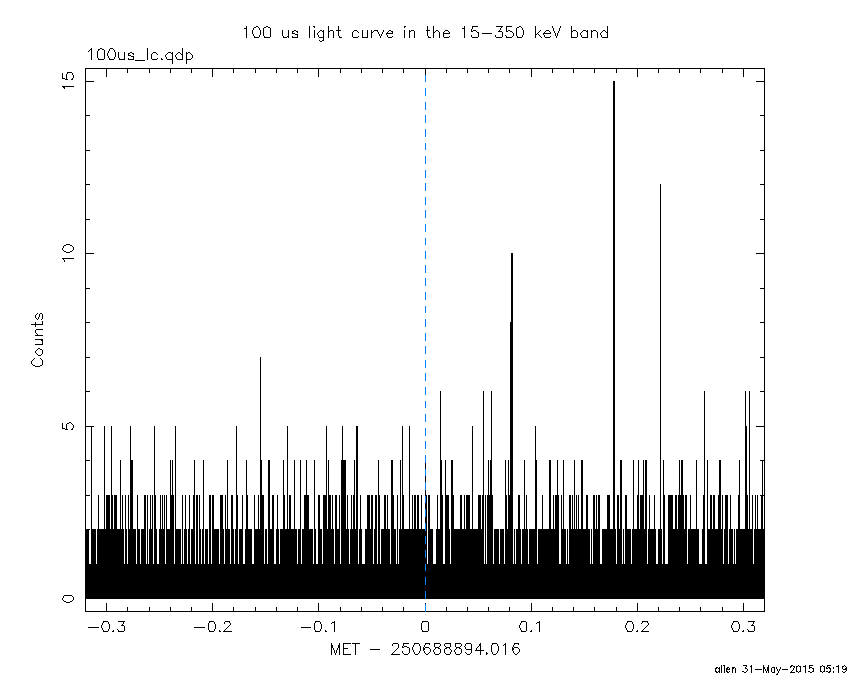
Blue+Cyan dotted lines: Time interval of the scaled map
From 0.000000 to 2.048000
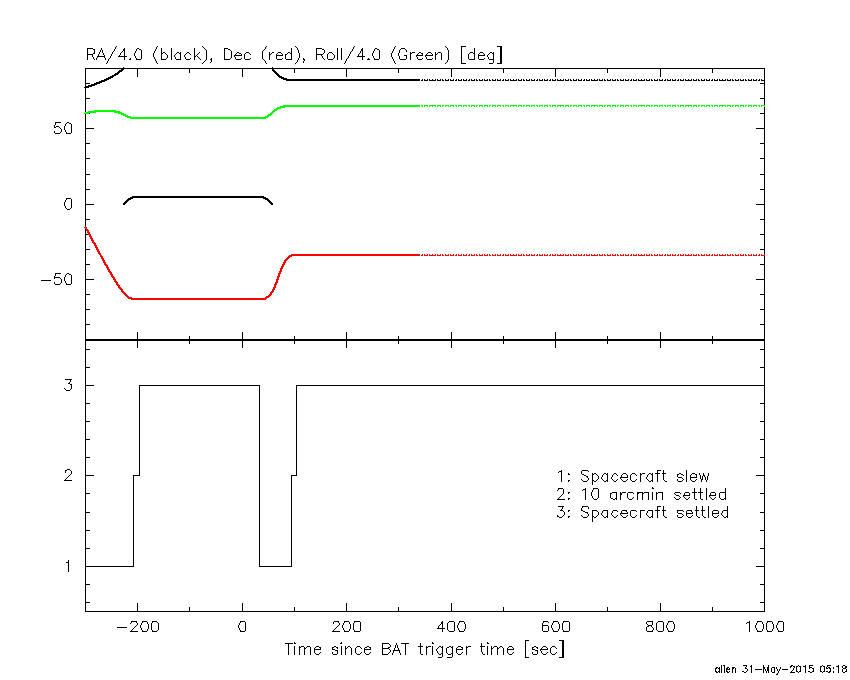
Spacecraft aspect plot
Bright source in the pre-burst/pre-slew/post-slew images
Pre-burst image of 15-350 keV band
Time interval of the image:
-207.915410 -1.080000

# RAcent  DECcent POSerr Theta    Phi  PeakCts   SNR AngSep     Name
#  [deg]    [deg]    ['] [deg]  [deg]                   [']
170.2665 -60.7030    5.2  54.5 -153.9   1.3379   2.2    5.0	Cen X-3
186.7855 -62.8118   17.4  54.0 -143.9  -0.7134  -0.7    4.3	GX 301-2
121.6991 -46.4414    2.9  54.9  167.6   4.0356   4.0 ------	UNKNOWN
102.8268 -62.7381    2.3  35.6  171.3   1.1561   5.0 ------	UNKNOWN
349.3619 -35.8150    3.0  32.6   -5.0   0.7821   3.9 ------	UNKNOWN
150.0431 -55.0045    2.7  56.2 -168.5   2.7525   4.2 ------	UNKNOWN
329.9760 -14.7294    2.2  58.9  -15.4   5.3074   5.3 ------	UNKNOWN
309.1712 -67.7933    2.4  27.9  -87.9   1.0906   4.8 ------	UNKNOWN
314.5843 -37.8408    2.9  45.4  -45.1   1.8732   4.0 ------	UNKNOWN
273.9069 -64.5990    3.6  41.1  -98.1   2.7938   3.3 ------	UNKNOWN
Pre-slew background subtracted image of 15-350 keV band
Time interval of the image:
-1.080000 2.752000

# RAcent  DECcent POSerr Theta    Phi  PeakCts   SNR AngSep     Name
#  [deg]    [deg]    ['] [deg]  [deg]                   [']
170.0522 -60.5535   19.3  54.6 -154.0   0.0422   0.6    8.8	Cen X-3
186.7452 -62.6494    8.1  54.1 -144.0   0.1435   1.4    7.7	GX 301-2
344.7737 -24.6910    2.6  44.4   -3.9   0.1389   4.4 ------	UNKNOWN
328.0799 -33.8179    1.2  42.7  -28.8   0.2869   9.3 ------	UNKNOWN
Post-slew image of 15-350 keV band
Time interval of the image:
94.084600 963.018400

# RAcent  DECcent POSerr Theta    Phi  PeakCts   SNR AngSep     Name
#  [deg]    [deg]    ['] [deg]  [deg]                   [']
285.0459 -25.0428    8.6  38.2  -78.8   2.0096   1.3    7.4	HT1900.1-2455
 13.5442 -76.4738    3.5  47.4  176.5   2.9818   3.3 ------	UNKNOWN
304.5569  11.6312    2.9  50.7  -20.7   3.7619   3.9 ------	UNKNOWN
294.6272   6.2284    4.8  51.0  -35.2   3.8606   2.4 ------	UNKNOWN
Plot creation:
Sun May 31 05:19:54 EDT 2015