Special notes of this burst
Image
Pre-slew 15.0-350.0 keV image (Event data)

#   RAcent    DECcent   POSerr    Theta     Phi              Peak Cts       SNR   Name
  120.4830   -69.0160   0.0186    47.2667  -159.1419         0.1620785     10.351 TRIG_00338177

Foreground time interval of the image:
 -0.052   0.452 (delta_t =   0.504 [sec])
Background time interval of the image:
-239.736  -0.052 (delta_t = 239.684 [sec])
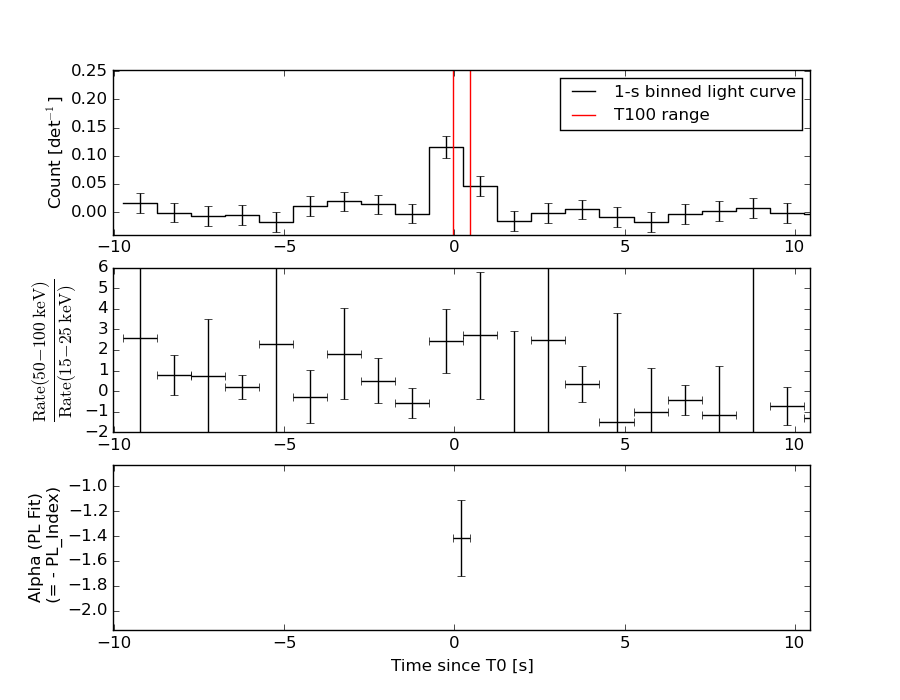
Lightcurves
Notes:
- 1) The mask-weighted light curves are using the flight position.
- 2) Multiple plots of different time binning/intervals are shown to cover all scenarios of short/long GRBs, rate/image triggers, and real/false positives.
- 3) For all the mask-weighted lightcurves, the y-axis units are counts/sec/det where a det is 0.4 x 0.4 = 0.16 sq cm.
- 4) The verticle lines correspond to following: green dotted lines are T50 interval, black dotted lines are T90 interval, blue solid line(s) is a spacecraft slew start time, and orange solid line(s) is a spacecraft slew end time.
- 5) Time of each bin is in the middle of the bin.
1 s binning
From T0-310 s to T0+310 s

From T100_start - 20 s to T100_end + 30 s

Full time interval

64 ms binning
Full time interval

From T100_start to T100_end

From T0-5 sec to T0+5 sec
16 ms binning
From T100_start-5 s to T100_start+5 s

Blue+Cyan dotted lines: Time interval of the scaled map
From 0.000000 to 0.256000
8 ms binning
From T100_start-3 s to T100_start+3 s

Blue+Cyan dotted lines: Time interval of the scaled map
From 0.000000 to 0.256000
2 ms binning
From T100_start-1 s to T100_start+1 s
Blue+Cyan dotted lines: Time interval of the scaled map
From 0.000000 to 0.256000
SN=5 or 10 sec. binning (whichever binning is satisfied first)

SN=5 or 10 sec. binning (T < 200 sec)

Quad-rate summed light curves (from T0-300s to T0+1000s)

Spectral Evolution
Spectra
Notes:
- 1) The fitting includes the systematic errors.
- 2) When the burst includes telescope slew time periods, the fitting uses an average response file made from multiple 5-s response files through out the slew time plus single time preiod for the non-slew times, and weighted by the total counts in the corresponding time period using addrmf. An average response file is needed becuase a spectral fit using the pre-slew DRM will introduce some errors in both a spectral shape and a normalization if the PHA file contains a lot of the slew/post-slew time interval.
- 3) For fits to more complicated models (e.g. a power-law over a cutoff power-law), the BAT team has decided to require a chi-square improvement of more than 6 for each extra dof.
Time averaged spectrum fit using the average DRM
Power-law model

Time interval is from   -0.052 sec. to    0.452 sec.

Spectral model in power-law:
------------------------------------------------------------
Parameters  : value       lower 90%   higher 90%
Photon index: 1.41444     ( -0.306767   0.309796 )
Norm@50keV  : 1.87511E-02    ( -0.00337048   0.00335884 )
------------------------------------------------------------
#Fit statistic : Chi-Squared =          69.98 using 59 PHA bins.
# Reduced chi-squared =          1.228 for     57 degrees of freedom
# Null hypothesis probability =   1.159956e-01

Photon flux (15-150 keV)    in 0.504 sec: 2.29113 ( -0.420906  0.422587 ) ph/cm2/s
Energy fluence (15-150 keV)             : 9.10521e-08 ( -1.77885e-08  1.79547e-08 ) ergs/cm2
Cutoff power-law model
Time interval is from   -0.052 sec. to    0.452 sec.
Spectral model in the cutoff power-law:
------------------------------------------------------------
Parameters  : value       lower 90%   higher 90%
Photon index: 1.21272     ( -1.27575   1.6056 )
Epeak [keV] : 210.118      ( -209.658 -209.658 )
Norm@50keV  : 2.34457E-02    ( -0.00793699   0.068098 )
------------------------------------------------------------
#Fit statistic : Chi-Squared =          69.87 using 59 PHA bins.
# Reduced chi-squared =          1.248 for     56 degrees of freedom
# Null hypothesis probability =   1.006747e-01

Photon flux (15-150 keV)    in 0.504 sec: 2.27416 ( -0.43059  0.21552 ) ph/cm2/s
Energy fluence (15-150 keV)             : 9.03057e-08 ( -1.85679e-08  1.84005e-08 ) ergs/cm2
Band function

Time interval is from   -0.052 sec. to    0.452 sec.

Spectral model in the Band function:
------------------------------------------------------------
Parameters  : value       lower 90%   higher 90%
alpha       : -1.21579   ( 1.19632   0.683977 )
beta        : -8.58603    ( 9.25431   19.2543 )
Epeak [keV] : 208.141      ( -132.921 -209.703 )
Norm@50keV   : 2.34685E-02    ( -0.00416022   0.0417673 )
------------------------------------------------------------
#Fit statistic : Chi-Squared =          69.87 using 59 PHA bins.
# Reduced chi-squared =          1.270 for     55 degrees of freedom
# Null hypothesis probability =   8.542390e-02

Photon flux (15-150 keV)    in 0.504 sec: 2.25876 (    ) ph/cm2/s
Energy fluence (15-150 keV)             : 0 ( 0  0 ) ergs/cm2
Single BB

Spectral model blackbody:
------------------------------------------------------------
Parameters  : value    Lower 90%  Upper 90%
kT [keV]    : 17.1182  (-3.82154  5.17817)
R^2/D10^2   : 0.167780  (-0.0995058   0.23204)
(R is the radius in km and D10 is the distance to the source in units of 10 kpc)
------------------------------------------------------------
#Fit statistic : Chi-Squared =          78.29 using 59 PHA bins.
# Reduced chi-squared =          1.374 for     57 degrees of freedom
# Null hypothesis probability =   3.217660e-02

Energy  Fluence     90% Error
[keV]   [erg/cm2]   [erg/cm2]
15- 25  5.037e-09   1.991e-09
25- 50  2.241e-08   6.388e-09
50-150  4.699e-08   1.678e-08
15-150  7.444e-08   2.236e-08
Thermal bremsstrahlung (OTTB)

Spectral model: thermal bremsstrahlung
------------------------------------------------------------
Parameters  : value         Lower 90%    Upper 90%
kT [keV]    : 199.361       (-83.9944      -199.363)
Norm        : 9.49402       (-1.6928     1.69705)
------------------------------------------------------------
#Fit statistic : Chi-Squared =          70.61 using 59 PHA bins.
# Reduced chi-squared =          1.239 for     57 degrees of freedom
# Null hypothesis probability =   1.062123e-01

Energy  Fluence     90% Error
[keV]   [erg/cm2]   [erg/cm2]
15- 25  1.192e-08   6.943e-09
25- 50  2.292e-08   1.345e-08
50-150  5.027e-08   2.961e-08
15-150  8.511e-08   4.896e-08
Double BB

Spectral model: bbodyrad<1> + bbodyrad<2>
------------------------------------------------------------
Parameters  : value         Lower 90%    Upper 90%
kT1 [keV]   : 6.27375        (-2.85312      5.15642)
R1^2/D10^2  : 3.32808        (-2.85357      36.8286)
kT2 [keV]   : 27.0417        (-8.70245      33.9719)
R2^2/D10^2  : 3.00132E-02    (-0.027703   0.0894156)
------------------------------------------------------------
#Fit statistic : Chi-Squared =          69.53 using 59 PHA bins.
# Reduced chi-squared =          1.264 for     55 degrees of freedom
# Null hypothesis probability =   8.990651e-02

Energy  Fluence     90% Error
[keV]   [erg/cm2]   [erg/cm2]
15- 25  1.117e-08   6.476e-09
25- 50  2.108e-08   1.158e-08
50-150  5.905e-08   3.495e-08
15-150  9.129e-08   4.791e-08
Peak spectrum fit
Power-law model

Time interval is from   -0.300 sec. to    0.700 sec.

Spectral model in power-law:
------------------------------------------------------------
Parameters  : value       lower 90%   higher 90%
Photon index: 1.02822     ( -0.457233   0.407785 )
Norm@50keV  : 9.35324E-03    ( -0.00232546   0.00224096 )
------------------------------------------------------------
#Fit statistic : Chi-Squared =          67.44 using 59 PHA bins.
# Reduced chi-squared =          1.183 for     57 degrees of freedom
# Null hypothesis probability =   1.623204e-01

Photon flux (15-150 keV)    in 1 sec: 1.07871 ( -0.270659  0.274672 ) ph/cm2/s
Energy fluence (15-150 keV)             : 1.00144e-07 ( -2.34046e-08  2.35209e-08 ) ergs/cm2
Cutoff power-law model

Time interval is from   -0.300 sec. to    0.700 sec.
Spectral model in the cutoff power-law:
------------------------------------------------------------
Parameters  : value       lower 90%   higher 90%
Photon index: 1.02199     (     )
Epeak [keV] : 9995.19      (   )
Norm@50keV  : 9.40907E-03    (     )
------------------------------------------------------------
#Fit statistic : Chi-Squared =          67.44 using 59 PHA bins.
# Reduced chi-squared =          1.204 for     56 degrees of freedom
# Null hypothesis probability =   1.407744e-01

Photon flux (15-150 keV)    in 1 sec: 1.08017 ( -0.275772  0.27185 ) ph/cm2/s
Energy fluence (15-150 keV)             : 1.0019e-07 ( -2.38229e-08  2.3416e-08 ) ergs/cm2
Band function

Time interval is from   -0.300 sec. to    0.700 sec.

Spectral model in the Band function:
------------------------------------------------------------
Parameters  : value       lower 90%   higher 90%
alpha       : 4.90757   ( -4.90757   -4.90757 )
beta        : -1.11676    ( -0.524622   0.498117 )
Epeak [keV] : 31.2880      ( -31.288 44.8392 )
Norm@50keV   : 154.773    ( -34.9662   3.07717e+06 )
------------------------------------------------------------
#Fit statistic : Chi-Squared =          67.08 using 59 PHA bins.
# Reduced chi-squared =          1.220 for     55 degrees of freedom
# Null hypothesis probability =   1.273245e-01

Photon flux (15-150 keV)    in 1 sec:  (    ) ph/cm2/s
Energy fluence (15-150 keV)             : 0 ( 0  0 ) ergs/cm2
Single BB

Spectral model blackbody:
------------------------------------------------------------
Parameters  : value    Lower 90%  Upper 90%
kT [keV]    : 23.1736  (-6.46429  11.8938)
R^2/D10^2   : 3.18896E-02  (-0.0229517   0.0616586)
(R is the radius in km and D10 is the distance to the source in units of 10 kpc)
------------------------------------------------------------
#Fit statistic : Chi-Squared =          71.49 using 59 PHA bins.
# Reduced chi-squared =          1.254 for     57 degrees of freedom
# Null hypothesis probability =   9.374879e-02

Energy  Fluence     90% Error
[keV]   [erg/cm2]   [erg/cm2]
15- 25  3.092e-09   1.639e-09
25- 50  1.685e-08   8.699e-09
50-150  6.756e-08   3.884e-08
15-150  8.750e-08   4.597e-08
Thermal bremsstrahlung (OTTB)

Spectral model: thermal bremsstrahlung
------------------------------------------------------------
Parameters  : value         Lower 90%    Upper 90%
kT [keV]    : 200.000       (      )
Norm        : 4.67138       (-1.11296     1.11269)
------------------------------------------------------------
#Fit statistic : Chi-Squared =          72.32 using 59 PHA bins.
# Reduced chi-squared =          1.269 for     57 degrees of freedom
# Null hypothesis probability =   8.313498e-02

Energy  Fluence     90% Error
[keV]   [erg/cm2]   [erg/cm2]
15- 25  1.163e-08   7.000e-09
25- 50  2.238e-08   1.328e-08
50-150  4.908e-08   2.885e-08
15-150  8.309e-08   4.995e-08
Double BB

------------------------------------------------------------
Parameters  : value         Lower 90%    Upper 90%
kT1 [keV]   : 12.1908        (-8.18736      9.46092)
R1^2/D10^2  : 0.177520        (      )
kT2 [keV]   : 84.2610        (-86.7046      -86.7047)
R2^2/D10^2  : 7.83601E-04    (-0.000643783   0.0344358)
------------------------------------------------------------
#Fit statistic : Chi-Squared =          67.36 using 59 PHA bins.
#Fit statistic : Chi-Squared =          67.33 using 59 PHA bins.
# Reduced chi-squared =          1.225 for     55 degrees of freedom
# Reduced chi-squared =          1.224 for     55 degrees of freedom
# Null hypothesis probability =   1.225453e-01
# Null hypothesis probability =   1.229578e-01

Energy  Fluence     90% Error
[keV]   [erg/cm2]   [erg/cm2]
15- 25  6.225e-09   3.736e-09
25- 50  2.092e-08   1.155e-08
50-150  7.299e-08   3.551e-08
15-150  1.001e-07   4.893e-08
Pre-slew spectrum (Pre-slew PHA with pre-slew DRM)
Power-law model
Spectral model in power-law:
------------------------------------------------------------
Parameters  : value       lower 90%   higher 90%
Photon index: 1.41444     ( -0.306767   0.309796 )
Norm@50keV  : 1.87511E-02    ( -0.00337048   0.00335884 )
------------------------------------------------------------
#Fit statistic : Chi-Squared =          69.98 using 59 PHA bins.
# Reduced chi-squared =          1.228 for     57 degrees of freedom
# Null hypothesis probability =   1.159956e-01

Photon flux (15-150 keV)    in 0.504 sec: 2.29113 ( -0.420906  0.422587 ) ph/cm2/s
Energy fluence (15-150 keV)             : 9.10521e-08 ( -1.77885e-08  1.79547e-08 ) ergs/cm2
Cutoff power-law model

Spectral model in the cutoff power-law:
------------------------------------------------------------
Parameters  : value       lower 90%   higher 90%
Photon index: 1.21272     ( -1.27575   1.6056 )
Epeak [keV] : 210.118      ( -209.658 -209.658 )
Norm@50keV  : 2.34457E-02    ( -0.00793699   0.068098 )
------------------------------------------------------------
#Fit statistic : Chi-Squared =          69.87 using 59 PHA bins.
# Reduced chi-squared =          1.248 for     56 degrees of freedom
# Null hypothesis probability =   1.006747e-01

Photon flux (15-150 keV)    in 0.504 sec: 2.27416 ( -0.43059  0.21552 ) ph/cm2/s
Energy fluence (15-150 keV)             : 9.03057e-08 ( -1.85679e-08  1.84005e-08 ) ergs/cm2
Band function

Spectral model in the Band function:
------------------------------------------------------------
Parameters  : value       lower 90%   higher 90%
alpha       : -1.21579   ( 1.19632   0.683977 )
beta        : -8.58603    ( 9.25431   19.2543 )
Epeak [keV] : 208.141      ( -132.921 -209.703 )
Norm@50keV   : 2.34685E-02    ( -0.00416022   0.0417673 )
------------------------------------------------------------
#Fit statistic : Chi-Squared =          69.87 using 59 PHA bins.
# Reduced chi-squared =          1.270 for     55 degrees of freedom
# Null hypothesis probability =   8.542390e-02

Photon flux (15-150 keV)    in 0.504 sec: 2.25876 (    ) ph/cm2/s
Energy fluence (15-150 keV)             : 0 ( 0  0 ) ergs/cm2
S(25-50 keV) vs. S(50-100 keV) plot

S(25-50 keV)  = 2.16e-08
S(50-100 keV) = 3.24e-08
T90 vs. Hardness ratio plot

T90                                   = 0.435999989509583 sec.
Hardness ratio (energy fluence ratio) = 1.5
Color vs. Color plot

Count Ratio  (25-50 keV) / (15-25 keV) = 1.29352
Count Ratio (50-100 keV) / (15-25 keV) = 1.65237
Mask shadow pattern

IMX = -1.011490977071833E+00, IMY = 3.854032440361417E-01
TIME vs. PHA plot around the trigger time

Blue+Cyan dotted lines: Time interval of the scaled map
From 0.000000 to 0.256000
TIME vs. DetID plot around the trigger time

Blue+Cyan dotted lines: Time interval of the scaled map
From 0.000000 to 0.256000
100 us light curve (15-350 keV)

Blue+Cyan dotted lines: Time interval of the scaled map
From 0.000000 to 0.256000
Spacecraft aspect plot

Bright source in the pre-burst/pre-slew/post-slew images
Pre-burst image of 15-350 keV band
Time interval of the image:
-239.736000 -0.052000

# RAcent  DECcent POSerr Theta    Phi  PeakCts   SNR AngSep     Name
#  [deg]    [deg]    ['] [deg]  [deg]                   [']
 28.1340   3.2928    2.0  47.0   11.8   2.0538   5.6 ------	UNKNOWN
Pre-slew background subtracted image of 15-350 keV band
Time interval of the image:
-0.052000 0.452000

# RAcent  DECcent POSerr Theta    Phi  PeakCts   SNR AngSep     Name
#  [deg]    [deg]    ['] [deg]  [deg]                   [']
 54.4277   7.6104    2.2  45.0   48.8   0.1575   5.2 ------	UNKNOWN
 79.4774 -10.6437    2.5  35.5   95.3   0.0793   4.6 ------	UNKNOWN
 19.3620   8.2995    2.4  55.8    5.3   0.1898   4.8 ------	UNKNOWN
136.0873 -51.1004    2.1  57.5  179.9   0.2425   5.6 ------	UNKNOWN
120.4831 -69.0160    1.1  47.3 -159.1   0.1621  10.4 ------	UNKNOWN
147.9854 -70.2264    2.2  56.6 -156.3   0.1851   5.2 ------	UNKNOWN
Post-slew image of 15-350 keV band
Time interval of the image:
78.564620 962.431200

# RAcent  DECcent POSerr Theta    Phi  PeakCts   SNR AngSep     Name
#  [deg]    [deg]    ['] [deg]  [deg]                   [']
135.5506 -40.5616    1.4  29.6  137.1   5.2786   8.5    1.1	Vela X-1
170.2718 -60.6197    1.4  22.0 -154.0   3.6421   8.3    1.3	Cen X-3
186.6506 -62.8194    2.1  26.3 -137.2   2.6621   5.5    3.0	GX 301-2
184.6763 -66.6179    3.3  23.2 -131.4   1.4652   3.6 ------	UNKNOWN
223.6233 -70.6724    2.8  31.3 -104.8   2.5338   4.2 ------	UNKNOWN
228.7143 -57.4100    2.7  43.4 -114.6   8.9487   4.2 ------	UNKNOWN
Plot creation:
Sun May 31 05:14:01 EDT 2015