Special notes of this burst
Image
Pre-slew 15.0-350.0 keV image (Event data)
#   RAcent    DECcent   POSerr    Theta     Phi              Peak Cts       SNR   Name
   39.4759    30.8348   0.0208    25.9023     4.7075         0.1629767      9.243 TRIG_00338338

Foreground time interval of the image:
 -0.128   2.872 (delta_t =   3.000 [sec])
Background time interval of the image:
-266.827  -0.128 (delta_t = 266.699 [sec])
Lightcurves
Notes:
- 1) The mask-weighted light curves are using the flight position.
- 2) Multiple plots of different time binning/intervals are shown to cover all scenarios of short/long GRBs, rate/image triggers, and real/false positives.
- 3) For all the mask-weighted lightcurves, the y-axis units are counts/sec/det where a det is 0.4 x 0.4 = 0.16 sq cm.
- 4) The verticle lines correspond to following: green dotted lines are T50 interval, black dotted lines are T90 interval, blue solid line(s) is a spacecraft slew start time, and orange solid line(s) is a spacecraft slew end time.
- 5) Time of each bin is in the middle of the bin.
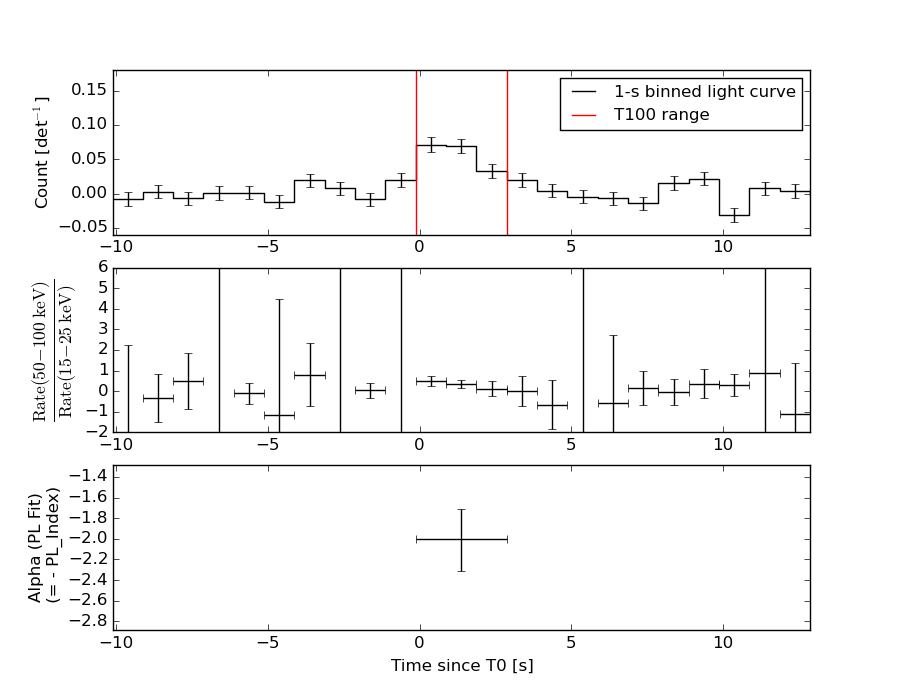
1 s binning
From T0-310 s to T0+310 s

From T100_start - 20 s to T100_end + 30 s
Full time interval
64 ms binning
Full time interval
From T100_start to T100_end
From T0-5 sec to T0+5 sec
16 ms binning
From T100_start-5 s to T100_start+5 s
Blue+Cyan dotted lines: Time interval of the scaled map
From 0.000000 to 1.024000
8 ms binning
From T100_start-3 s to T100_start+3 s
Blue+Cyan dotted lines: Time interval of the scaled map
From 0.000000 to 1.024000
2 ms binning
From T100_start-1 s to T100_start+1 s
Blue+Cyan dotted lines: Time interval of the scaled map
From 0.000000 to 1.024000
SN=5 or 10 sec. binning (whichever binning is satisfied first)
SN=5 or 10 sec. binning (T < 200 sec)

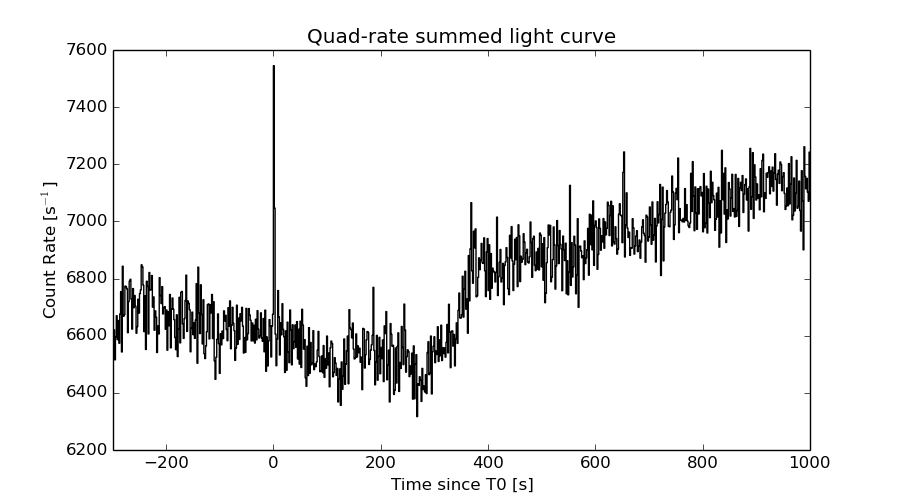
Quad-rate summed light curves (from T0-300s to T0+1000s)
Spectral Evolution
Spectra
Notes:
- 1) The fitting includes the systematic errors.
- 2) When the burst includes telescope slew time periods, the fitting uses an average response file made from multiple 5-s response files through out the slew time plus single time preiod for the non-slew times, and weighted by the total counts in the corresponding time period using addrmf. An average response file is needed becuase a spectral fit using the pre-slew DRM will introduce some errors in both a spectral shape and a normalization if the PHA file contains a lot of the slew/post-slew time interval.
- 3) For fits to more complicated models (e.g. a power-law over a cutoff power-law), the BAT team has decided to require a chi-square improvement of more than 6 for each extra dof.
Time averaged spectrum fit using the average DRM
Power-law model

Time interval is from   -0.128 sec. to    2.872 sec.

Spectral model in power-law:
------------------------------------------------------------
Parameters  : value       lower 90%   higher 90%
Photon index: 1.99891     ( -0.283642   0.309248 )
Norm@50keV  : 3.35209E-03    ( -0.000709289   0.0006864 )
------------------------------------------------------------
#Fit statistic : Chi-Squared =          56.29 using 59 PHA bins.
# Reduced chi-squared =         0.9875 for     57 degrees of freedom
# Null hypothesis probability =   5.018691e-01

Photon flux (15-150 keV)    in 3 sec: 0.502562 ( -0.0789864  0.078987 ) ph/cm2/s
Energy fluence (15-150 keV)             : 9.27354e-08 ( -1.80191e-08  1.87e-08 ) ergs/cm2
Cutoff power-law model
Time interval is from   -0.128 sec. to    2.872 sec.
Spectral model in the cutoff power-law:
------------------------------------------------------------
Parameters  : value       lower 90%   higher 90%
Photon index: 1.01158     ( -2.66291   1.12754 )
Epeak [keV] : 37.4211      (   )
Norm@50keV  : 1.37421E-02    (     )
------------------------------------------------------------
#Fit statistic : Chi-Squared =          55.42 using 59 PHA bins.
# Reduced chi-squared =         0.9897 for     56 degrees of freedom
# Null hypothesis probability =   4.966093e-01

Photon flux (15-150 keV)    in 3 sec: 0.486694 ( -0.083213  0.042924 ) ph/cm2/s
Energy fluence (15-150 keV)             : 8.17965e-08 ( -2.02722e-08  1.31781e-08 ) ergs/cm2
Band function

Time interval is from   -0.128 sec. to    2.872 sec.

Spectral model in the Band function:
------------------------------------------------------------
Parameters  : value       lower 90%   higher 90%
alpha       : -0.375390   ( 0.346994   0.346994 )
beta        : -2.55463    ( 2.55973   0.695919 )
Epeak [keV] : 34.1432      ( -33.995 19.5949 )
Norm@50keV   : 3.74545E-02    ( -0.0438478   213.115 )
------------------------------------------------------------
#Fit statistic : Chi-Squared =          54.15 using 59 PHA bins.
# Reduced chi-squared =         0.9846 for     55 degrees of freedom
# Null hypothesis probability =   5.069449e-01

Photon flux (15-150 keV)    in 3 sec:  (    ) ph/cm2/s
Energy fluence (15-150 keV)             : 8.55228e-08 ( 0  0 ) ergs/cm2
Single BB

Spectral model blackbody:
------------------------------------------------------------
Parameters  : value    Lower 90%  Upper 90%
kT [keV]    : 8.97943  (-1.35022  1.60935)
R^2/D10^2   : 0.365430  (-0.173758   0.320899)
(R is the radius in km and D10 is the distance to the source in units of 10 kpc)
------------------------------------------------------------
#Fit statistic : Chi-Squared =          58.07 using 59 PHA bins.
# Reduced chi-squared =          1.019 for     57 degrees of freedom
# Null hypothesis probability =   4.357442e-01

Energy  Fluence     90% Error
[keV]   [erg/cm2]   [erg/cm2]
15- 25  1.719e-08   4.987e-09
25- 50  3.641e-08   8.476e-09
50-150  1.379e-08   6.002e-09
15-150  6.739e-08   1.718e-08
Thermal bremsstrahlung (OTTB)
Spectral model: thermal bremsstrahlung
------------------------------------------------------------
Parameters  : value         Lower 90%    Upper 90%
kT [keV]    : 59.3977       (-22.1435      47.8607)
Norm        : 2.66447       (-0.631212     0.84043)
------------------------------------------------------------
#Fit statistic : Chi-Squared =          55.46 using 59 PHA bins.
# Reduced chi-squared =         0.9729 for     57 degrees of freedom
# Null hypothesis probability =   5.331510e-01

Energy  Fluence     90% Error
[keV]   [erg/cm2]   [erg/cm2]
15- 25  2.006e-08   3.972e-09
25- 50  3.043e-08   7.488e-09
50-150  3.433e-08   1.592e-08
15-150  8.482e-08   2.075e-08
Double BB
------------------------------------------------------------
Parameters  : value         Lower 90%    Upper 90%
kT1 [keV]   : 8.14364        (-1.67487      1.41497)
R1^2/D10^2  : 0.500791        (-0.181916      0.425995)
kT2 [keV]   : 195.694        (      )
R2^2/D10^2  : 4.19599E-05    (-2.57968e-05   0.005289)
------------------------------------------------------------
#Fit statistic : Chi-Squared =          52.04 using 59 PHA bins.
#Fit statistic : Chi-Squared =          51.80 using 59 PHA bins.
# Reduced chi-squared =         0.9462 for     55 degrees of freedom
# Reduced chi-squared =         0.9417 for     55 degrees of freedom
# Null hypothesis probability =   5.883758e-01
# Null hypothesis probability =   5.978450e-01

Energy  Fluence     90% Error
[keV]   [erg/cm2]   [erg/cm2]
15- 25  1.846e-08   6.819e-09
25- 50  3.413e-08   1.231e-08
50-150  4.259e-08   2.652e-08
15-150  9.519e-08   3.661e-08
Peak spectrum fit
Power-law model
Time interval is from   -0.128 sec. to    0.872 sec.

Spectral model in power-law:
------------------------------------------------------------
Parameters  : value       lower 90%   higher 90%
Photon index: 1.81610     ( -0.365052   0.399346 )
Norm@50keV  : 4.49016E-03    ( -0.00119946   0.0011587 )
------------------------------------------------------------
#Fit statistic : Chi-Squared =          54.07 using 59 PHA bins.
# Reduced chi-squared =         0.9485 for     57 degrees of freedom
# Null hypothesis probability =   5.858775e-01

Photon flux (15-150 keV)    in 1 sec: 0.622638 ( -0.136608  0.136611 ) ph/cm2/s
Energy fluence (15-150 keV)             : 4.13163e-08 ( -1.07912e-08  1.12659e-08 ) ergs/cm2
Cutoff power-law model
Time interval is from   -0.128 sec. to    0.872 sec.
Spectral model in the cutoff power-law:
------------------------------------------------------------
Parameters  : value       lower 90%   higher 90%
Photon index: -0.509188     ( -4.95001   2.45749 )
Epeak [keV] : 41.9020      ( -8.97183 203.879 )
Norm@50keV  : 0.111464    ( -0.162209   137.373 )
------------------------------------------------------------
#Fit statistic : Chi-Squared =          51.25 using 59 PHA bins.
# Reduced chi-squared =         0.9151 for     56 degrees of freedom
# Null hypothesis probability =   6.550533e-01

Photon flux (15-150 keV)    in 1 sec: 0.578758 ( -0.138713  0.141933 ) ph/cm2/s
Energy fluence (15-150 keV)             : 3.26911e-08 ( -9.0363e-09  1.32821e-08 ) ergs/cm2
Band function
Time interval is from   -0.128 sec. to    0.872 sec.

Spectral model in the Band function:
------------------------------------------------------------
Parameters  : value       lower 90%   higher 90%
alpha       : 1.31931   ( -2.8913   -1.36121 )
beta        : -2.83737    ( 2.84391   1.0275 )
Epeak [keV] : 38.3111      ( -12.065 13.5843 )
Norm@50keV   : 0.393040    ( -0.491542   53.1021 )
------------------------------------------------------------
#Fit statistic : Chi-Squared =          50.55 using 59 PHA bins.
# Reduced chi-squared =         0.9192 for     55 degrees of freedom
# Null hypothesis probability =   6.450178e-01

Photon flux (15-150 keV)    in 1 sec:  (    ) ph/cm2/s
Energy fluence (15-150 keV)             : 3.62836e-08 ( 0  0 ) ergs/cm2
Single BB
Spectral model blackbody:
------------------------------------------------------------
Parameters  : value    Lower 90%  Upper 90%
kT [keV]    : 10.3117  (-1.92198  2.47271)
R^2/D10^2   : 0.281468  (-0.158019   0.328165)
(R is the radius in km and D10 is the distance to the source in units of 10 kpc)
------------------------------------------------------------
#Fit statistic : Chi-Squared =          51.34 using 59 PHA bins.
# Reduced chi-squared =         0.9007 for     57 degrees of freedom
# Null hypothesis probability =   6.864017e-01

Energy  Fluence     90% Error
[keV]   [erg/cm2]   [erg/cm2]
15- 25  6.155e-09   2.535e-09
25- 50  1.597e-08   6.027e-09
50-150  9.104e-09   5.019e-09
15-150  3.123e-08   1.155e-08
Thermal bremsstrahlung (OTTB)
Spectral model: thermal bremsstrahlung
------------------------------------------------------------
Parameters  : value         Lower 90%    Upper 90%
kT [keV]    : 81.6754       (-39.5049      -81.6754)
Norm        : 2.95327       (-0.750367     1.13135)
------------------------------------------------------------
#Fit statistic : Chi-Squared =          52.80 using 59 PHA bins.
# Reduced chi-squared =         0.9264 for     57 degrees of freedom
# Null hypothesis probability =   6.331558e-01

Energy  Fluence     90% Error
[keV]   [erg/cm2]   [erg/cm2]
15- 25  7.673e-09   2.766e-09
25- 50  1.269e-08   6.401e-09
50-150  1.817e-08   1.453e-08
15-150  3.854e-08   1.904e-08
Double BB

------------------------------------------------------------
Parameters  : value         Lower 90%    Upper 90%
kT1 [keV]   : 9.63122        (      )
R1^2/D10^2  : 0.343974        (-0.1901      4.04979)
kT2 [keV]   : 199.363        (-199.363      -199.363)
R2^2/D10^2  : 2.98581E-05    (-3.7282e-05   0.453044)
------------------------------------------------------------
#Fit statistic : Chi-Squared =          50.39 using 59 PHA bins.
#Fit statistic : Chi-Squared =          49.76 using 59 PHA bins.
# Reduced chi-squared =         0.9162 for     55 degrees of freedom
# Reduced chi-squared =         0.9047 for     55 degrees of freedom
# Null hypothesis probability =   6.510261e-01
# Null hypothesis probability =   6.744318e-01

Energy  Fluence     90% Error
[keV]   [erg/cm2]   [erg/cm2]
15- 25  6.358e-09   2.905e-09
25- 50  1.545e-08   8.462e-09
50-150  9.769e-09   6.275e-09
15-150  3.158e-08   1.649e-08
Pre-slew spectrum (Pre-slew PHA with pre-slew DRM)
Power-law model

Spectral model in power-law:
------------------------------------------------------------
Parameters  : value       lower 90%   higher 90%
Photon index: 1.99891     ( -0.283642   0.309248 )
Norm@50keV  : 3.35209E-03    ( -0.000709289   0.0006864 )
------------------------------------------------------------
#Fit statistic : Chi-Squared =          56.29 using 59 PHA bins.
# Reduced chi-squared =         0.9875 for     57 degrees of freedom
# Null hypothesis probability =   5.018691e-01

Photon flux (15-150 keV)    in 3 sec: 0.502562 ( -0.0789864  0.078987 ) ph/cm2/s
Energy fluence (15-150 keV)             : 9.27354e-08 ( -1.80191e-08  1.87e-08 ) ergs/cm2
Cutoff power-law model

Spectral model in the cutoff power-law:
------------------------------------------------------------
Parameters  : value       lower 90%   higher 90%
Photon index: 1.01158     ( -2.66291   1.11875 )
Epeak [keV] : 37.4211      (   )
Norm@50keV  : 1.37421E-02    (     )
------------------------------------------------------------
#Fit statistic : Chi-Squared =          55.42 using 59 PHA bins.
# Reduced chi-squared =         0.9897 for     56 degrees of freedom
# Null hypothesis probability =   4.966093e-01

Photon flux (15-150 keV)    in 3 sec: 0.486694 ( -0.083213  0.042924 ) ph/cm2/s
Energy fluence (15-150 keV)             : 8.17965e-08 ( -2.02722e-08  1.31781e-08 ) ergs/cm2
Band function
Spectral model in the Band function:
------------------------------------------------------------
Parameters  : value       lower 90%   higher 90%
alpha       : -0.375390   ( 0.346994   0.346994 )
beta        : -2.55463    ( 2.55973   0.695919 )
Epeak [keV] : 34.1432      ( -33.995 19.5949 )
Norm@50keV   : 3.74545E-02    ( -0.0438478   213.132 )
------------------------------------------------------------
#Fit statistic : Chi-Squared =          54.15 using 59 PHA bins.
# Reduced chi-squared =         0.9846 for     55 degrees of freedom
# Null hypothesis probability =   5.069449e-01

Photon flux (15-150 keV)    in 3 sec:  (    ) ph/cm2/s
Energy fluence (15-150 keV)             : 8.55228e-08 ( 0  0 ) ergs/cm2
S(25-50 keV) vs. S(50-100 keV) plot
S(25-50 keV)  = 2.79e-08
S(50-100 keV) = 2.79e-08
T90 vs. Hardness ratio plot

T90                                   = 3 sec.
Hardness ratio (energy fluence ratio) = 1
Color vs. Color plot
Count Ratio  (25-50 keV) / (15-25 keV) = 1.3343
Count Ratio (50-100 keV) / (15-25 keV) = 0.346791
Mask shadow pattern
IMX = 4.839855197255994E-01, IMY = -3.985472905366623E-02
TIME vs. PHA plot around the trigger time
Blue+Cyan dotted lines: Time interval of the scaled map
From 0.000000 to 1.024000
TIME vs. DetID plot around the trigger time
Blue+Cyan dotted lines: Time interval of the scaled map
From 0.000000 to 1.024000
100 us light curve (15-350 keV)
Blue+Cyan dotted lines: Time interval of the scaled map
From 0.000000 to 1.024000
Spacecraft aspect plot

Bright source in the pre-burst/pre-slew/post-slew images
Pre-burst image of 15-350 keV band
Time interval of the image:
-266.827400 -0.128000

# RAcent  DECcent POSerr Theta    Phi  PeakCts   SNR AngSep     Name
#  [deg]    [deg]    ['] [deg]  [deg]                   [']
 83.6482  21.9887    0.8  39.4   80.5  10.6897  14.4    1.8	Crab
 58.5796 -17.1100    2.2  25.8  171.1   1.0297   5.2 ------	UNKNOWN
 23.5281  54.1909    2.1  51.8    1.7   2.9489   5.6 ------	UNKNOWN
 16.5506   0.6626    2.8  30.3  -80.1   1.1146   4.0 ------	UNKNOWN
Pre-slew background subtracted image of 15-350 keV band
Time interval of the image:
-0.128000 2.872000

# RAcent  DECcent POSerr Theta    Phi  PeakCts   SNR AngSep     Name
#  [deg]    [deg]    ['] [deg]  [deg]                   [']
 83.6424  22.0237  164.7  39.4   80.5   0.0049   0.1    0.8	Crab
 76.8603  -1.7759    2.5  31.3  121.6   0.1338   4.6 ------	UNKNOWN
 39.4759  30.8349    1.2  25.9    4.7   0.1630   9.2 ------	UNKNOWN
 42.8218 -29.8312    2.4  35.8 -156.0   0.1007   4.9 ------	UNKNOWN
Post-slew image of 15-350 keV band
Time interval of the image:
61.972590 119.572590

# RAcent  DECcent POSerr Theta    Phi  PeakCts   SNR AngSep     Name
#  [deg]    [deg]    ['] [deg]  [deg]                   [']
 53.5882 -19.3789    2.1  52.0  169.7   1.4407   5.5 ------	UNKNOWN
343.6584  63.4051    2.4  47.6  -23.4   0.6928   4.8 ------	UNKNOWN
 10.8435  -7.4790    3.2  47.1 -132.9   0.9329   3.6 ------	UNKNOWN
Plot creation:
Sun May 31 05:12:13 EDT 2015