Click here for the BAT GCN circular template
Image
Pre-slew 15.0-350.0 keV image (Event data)

#   RAcent    DECcent   POSerr    Theta     Phi              Peak Cts       SNR   Name
   37.3288   -25.1448   0.0103    18.4624   -14.1208         1.6045877     18.534 TRIG_00338633

Foreground time interval of the image:
-14.432  62.428 (delta_t =  76.860 [sec])
Background time interval of the image:
-263.899 -14.432 (delta_t = 249.467 [sec])
Lightcurves
Notes:
- 1) The mask-weighted light curves are using the flight position.
- 2) Multiple plots of different time binning/intervals are shown to cover all scenarios of short/long GRBs, rate/image triggers, and real/false positives.
- 3) For all the mask-weighted lightcurves, the y-axis units are counts/sec/det where a det is 0.4 x 0.4 = 0.16 sq cm.
- 4) The verticle lines correspond to following: green dotted lines are T50 interval, black dotted lines are T90 interval, blue solid line(s) is a spacecraft slew start time, and orange solid line(s) is a spacecraft slew end time.
- 5) Time of each bin is in the middle of the bin.
1 s binning
From T0-310 s to T0+310 s

From T100_start - 20 s to T100_end + 30 s

Full time interval

64 ms binning
Full time interval

From T100_start to T100_end

From T0-5 sec to T0+5 sec

16 ms binning
From T100_start-5 s to T100_start+5 s

8 ms binning
From T100_start-3 s to T100_start+3 s

2 ms binning
From T100_start-1 s to T100_start+1 s

SN=5 or 10 sec. binning (whichever binning is satisfied first)

SN=5 or 10 sec. binning (T < 200 sec)

Quad-rate summed light curves (from T0-300s to T0+1000s)

Spectral Evolution

Spectra
Notes:
- 1) The fitting includes the systematic errors.
- 2) When the burst includes telescope slew time periods, the fitting uses an average response file made from multiple 5-s response files through out the slew time plus single time preiod for the non-slew times, and weighted by the total counts in the corresponding time period using addrmf. An average response file is needed becuase a spectral fit using the pre-slew DRM will introduce some errors in both a spectral shape and a normalization if the PHA file contains a lot of the slew/post-slew time interval.
- 3) For fits to more complicated models (e.g. a power-law over a cutoff power-law), the BAT team has decided to require a chi-square improvement of more than 6 for each extra dof.
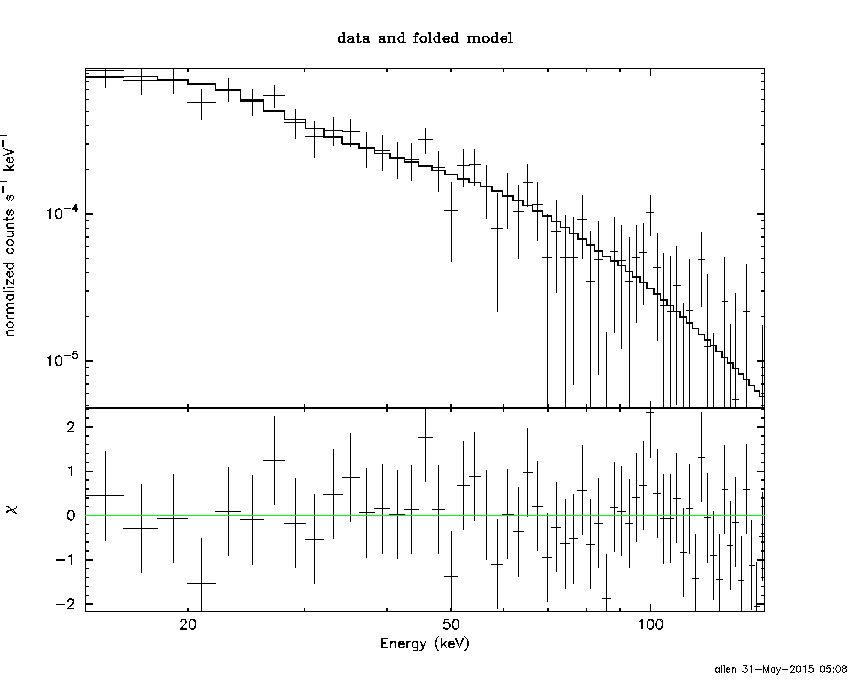
Time averaged spectrum fit using the average DRM
Power-law model

Time interval is from  -14.432 sec. to   62.428 sec.

Spectral model in power-law:
------------------------------------------------------------
Parameters  : value       lower 90%   higher 90%
Photon index: 1.91432     ( -0.152891   0.159018 )
Norm@50keV  : 1.21458E-03    ( -0.000120747   0.000118532 )
------------------------------------------------------------
#Fit statistic : Chi-Squared =          43.10 using 59 PHA bins.
# Reduced chi-squared =         0.7562 for     57 degrees of freedom
# Null hypothesis probability =   9.133322e-01

Photon flux (15-150 keV)    in 76.86 sec: 0.175374 ( -0.0140814  0.0140875 ) ph/cm2/s
Energy fluence (15-150 keV)             : 8.58411e-07 ( -8.25961e-08  8.40549e-08 ) ergs/cm2
Cutoff power-law model

Time interval is from  -14.432 sec. to   62.428 sec.
Spectral model in the cutoff power-law:
------------------------------------------------------------
Parameters  : value       lower 90%   higher 90%
Photon index: 1.48688     ( -0.689562   0.588988 )
Epeak [keV] : 52.1641      ( -47.5681 -52.1641 )
Norm@50keV  : 2.10617E-03    ( -0.00109238   0.00299553 )
------------------------------------------------------------
#Fit statistic : Chi-Squared =          41.59 using 59 PHA bins.
# Reduced chi-squared =         0.7427 for     56 degrees of freedom
# Null hypothesis probability =   9.243762e-01

Photon flux (15-150 keV)    in 76.86 sec: 0.171744 ( -0.014916  0.014903 ) ph/cm2/s
Energy fluence (15-150 keV)             : 8.20788e-07 ( -9.57291e-08  9.82348e-08 ) ergs/cm2
Band function

Time interval is from  -14.432 sec. to   62.428 sec.

Spectral model in the Band function:
------------------------------------------------------------
Parameters  : value       lower 90%   higher 90%
alpha       : -1.48665   ( 1.58667   0.637846 )
beta        : -10.0000    ( 10   3.55271e-15 )
Epeak [keV] : 52.1356      ( -29.1887 -52.1356 )
Norm@50keV   : 2.10666E-03    ( -0.00101142   0.00299017 )
------------------------------------------------------------
#Fit statistic : Chi-Squared =          41.59 using 59 PHA bins.
# Reduced chi-squared =         0.7562 for     55 degrees of freedom
# Null hypothesis probability =   9.090881e-01

Photon flux (15-150 keV)    in 76.86 sec: 0.171350 ( 6.82865  -0.01366 ) ph/cm2/s
Energy fluence (15-150 keV)             : 8.245e-07 ( 0  0 ) ergs/cm2
Single BB

Spectral model blackbody:
------------------------------------------------------------
Parameters  : value    Lower 90%  Upper 90%
kT [keV]    : 10.5344  (-0.998376  1.12291)
R^2/D10^2   : 6.60982E-02  (-0.0210116   0.0303727)
(R is the radius in km and D10 is the distance to the source in units of 10 kpc)
------------------------------------------------------------
#Fit statistic : Chi-Squared =          71.12 using 59 PHA bins.
# Reduced chi-squared =          1.248 for     57 degrees of freedom
# Null hypothesis probability =   9.880182e-02

Energy  Fluence     90% Error
[keV]   [erg/cm2]   [erg/cm2]
15- 25  1.166e-07   1.710e-08
25- 50  3.116e-07   2.682e-08
50-150  1.887e-07   3.758e-08
15-150  6.169e-07   6.076e-08
Thermal bremsstrahlung (OTTB)

Spectral model: thermal bremsstrahlung
------------------------------------------------------------
Parameters  : value         Lower 90%    Upper 90%
kT [keV]    : 78.7484       (-19.1896      30.3231)
Norm        : 0.822225       (-0.0991588     0.118278)
------------------------------------------------------------
#Fit statistic : Chi-Squared =          41.83 using 59 PHA bins.
# Reduced chi-squared =         0.7339 for     57 degrees of freedom
# Null hypothesis probability =   9.340881e-01

Energy  Fluence     90% Error
[keV]   [erg/cm2]   [erg/cm2]
15- 25  1.638e-07   1.910e-08
25- 50  2.686e-07   2.340e-08
50-150  3.752e-07   8.566e-08
15-150  8.076e-07   1.062e-07
Double BB

Spectral model: bbodyrad<1> + bbodyrad<2>
------------------------------------------------------------
Parameters  : value         Lower 90%    Upper 90%
kT1 [keV]   : 5.94272        (-2.16774      1.92065)
R1^2/D10^2  : 0.383976        (-0.229005      1.81226)
kT2 [keV]   : 19.6270        (-5.64944      11.1968)
R2^2/D10^2  : 4.56540E-03    (-0.0037081   0.00535737)
------------------------------------------------------------
#Fit statistic : Chi-Squared =          44.08 using 59 PHA bins.
# Reduced chi-squared =         0.8015 for     55 degrees of freedom
# Null hypothesis probability =   8.541647e-01

Energy  Fluence     90% Error
[keV]   [erg/cm2]   [erg/cm2]
15- 25  1.628e-07   6.900e-08
25- 50  2.625e-07   8.439e-08
50-150  3.794e-07   2.037e-07
15-150  8.047e-07   3.186e-07
Peak spectrum fit
Power-law model

Time interval is from   46.628 sec. to   47.628 sec.

Spectral model in power-law:
------------------------------------------------------------
Parameters  : value       lower 90%   higher 90%
Photon index: 1.43109     ( -0.288864   0.290112 )
Norm@50keV  : 5.76227E-03    ( -0.00099621   0.000986198 )
------------------------------------------------------------
#Fit statistic : Chi-Squared =          56.84 using 59 PHA bins.
# Reduced chi-squared =         0.9972 for     57 degrees of freedom
# Null hypothesis probability =   4.810769e-01

Photon flux (15-150 keV)    in 1 sec: 0.706860 ( -0.119136  0.119229 ) ph/cm2/s
Energy fluence (15-150 keV)             : 5.53369e-08 ( -1.05536e-08  1.07419e-08 ) ergs/cm2
Cutoff power-law model

Time interval is from   46.628 sec. to   47.628 sec.
Spectral model in the cutoff power-law:
------------------------------------------------------------
Parameters  : value       lower 90%   higher 90%
Photon index: 1.26525     (     )
Epeak [keV] : 213.932      (   )
Norm@50keV  : 7.04955E-03    (     )
------------------------------------------------------------
#Fit statistic : Chi-Squared =          56.77 using 59 PHA bins.
# Reduced chi-squared =          1.014 for     56 degrees of freedom
# Null hypothesis probability =   4.460756e-01

Photon flux (15-150 keV)    in 1 sec: 0.702895 ( -0.122113  0.121531 ) ph/cm2/s
Energy fluence (15-150 keV)             : 5.45651e-08 ( -1.18763e-08  1.13931e-08 ) ergs/cm2
Band function

Time interval is from   46.628 sec. to   47.628 sec.

Spectral model in the Band function:
------------------------------------------------------------
Parameters  : value       lower 90%   higher 90%
alpha       : 4.96436   ( -4.96436   -4.96436 )
beta        : -1.54520    ( -0.432045   0.331187 )
Epeak [keV] : 25.0862      ( -25.0862 8.21554 )
Norm@50keV   : 547.847    ( -90.7182   2.88396e+06 )
------------------------------------------------------------
#Fit statistic : Chi-Squared =          55.71 using 59 PHA bins.
# Reduced chi-squared =          1.013 for     55 degrees of freedom
# Null hypothesis probability =   4.477866e-01

Photon flux (15-150 keV)    in 1 sec:  (    ) ph/cm2/s
Energy fluence (15-150 keV)             : 0 ( 0  0 ) ergs/cm2
Single BB

Spectral model blackbody:
------------------------------------------------------------
Parameters  : value    Lower 90%  Upper 90%
kT [keV]    : 14.9517  (-3.01028  3.92353)
R^2/D10^2   : 8.21993E-02  (-0.045409   0.0975795)
(R is the radius in km and D10 is the distance to the source in units of 10 kpc)
------------------------------------------------------------
#Fit statistic : Chi-Squared =          65.54 using 59 PHA bins.
# Reduced chi-squared =          1.150 for     57 degrees of freedom
# Null hypothesis probability =   2.047507e-01

Energy  Fluence     90% Error
[keV]   [erg/cm2]   [erg/cm2]
15- 25  3.849e-09   1.384e-09
25- 50  1.525e-08   4.630e-09
50-150  2.317e-08   8.315e-09
15-150  4.227e-08   1.211e-08
Thermal bremsstrahlung (OTTB)

Spectral model: thermal bremsstrahlung
------------------------------------------------------------
Parameters  : value         Lower 90%    Upper 90%
kT [keV]    : 199.363       (-89.45      -199.363)
Norm        : 2.90577       (-0.484809     0.484809)
------------------------------------------------------------
#Fit statistic : Chi-Squared =          57.19 using 59 PHA bins.
# Reduced chi-squared =          1.003 for     57 degrees of freedom
# Null hypothesis probability =   4.680412e-01

Energy  Fluence     90% Error
[keV]   [erg/cm2]   [erg/cm2]
15- 25  7.236e-09   4.199e-09
25- 50  1.392e-08   7.815e-09
50-150  3.053e-08   1.723e-08
15-150  5.168e-08   2.890e-08
Double BB

Spectral model: bbodyrad<1> + bbodyrad<2>
------------------------------------------------------------
Parameters  : value         Lower 90%    Upper 90%
kT1 [keV]   : 6.46738        (-2.61162      5.62967)
R1^2/D10^2  : 0.951794        (-0.801081      5.41855)
kT2 [keV]   : 25.8149        (-9.08511      -25.8805)
R2^2/D10^2  : 1.00614E-02    (-0.00990527   0.0380211)
------------------------------------------------------------
#Fit statistic : Chi-Squared =          56.52 using 59 PHA bins.
# Reduced chi-squared =          1.028 for     55 degrees of freedom
# Null hypothesis probability =   4.179752e-01

Energy  Fluence     90% Error
[keV]   [erg/cm2]   [erg/cm2]
15- 25  6.991e-09   3.991e-09
25- 50  1.343e-08   7.370e-09
50-150  3.329e-08   1.923e-08
15-150  5.371e-08   2.774e-08
Pre-slew spectrum (Pre-slew PHA with pre-slew DRM)
Power-law model
Spectral model in power-law:
------------------------------------------------------------
Parameters  : value       lower 90%   higher 90%
Photon index: 1.91432     ( -0.152891   0.159018 )
Norm@50keV  : 1.21458E-03    ( -0.000120747   0.000118532 )
------------------------------------------------------------
#Fit statistic : Chi-Squared =          43.10 using 59 PHA bins.
# Reduced chi-squared =         0.7562 for     57 degrees of freedom
# Null hypothesis probability =   9.133322e-01

Photon flux (15-150 keV)    in 76.86 sec: 0.175374 ( -0.0140814  0.0140875 ) ph/cm2/s
Energy fluence (15-150 keV)             : 8.58411e-07 ( -8.25961e-08  8.40549e-08 ) ergs/cm2
Cutoff power-law model

Spectral model in the cutoff power-law:
------------------------------------------------------------
Parameters  : value       lower 90%   higher 90%
Photon index: 1.48688     ( -0.689562   0.588988 )
Epeak [keV] : 52.1641      ( -34.2968 -52.1641 )
Norm@50keV  : 2.10617E-03    ( -0.00109238   0.00299553 )
------------------------------------------------------------
#Fit statistic : Chi-Squared =          41.59 using 59 PHA bins.
# Reduced chi-squared =         0.7427 for     56 degrees of freedom
# Null hypothesis probability =   9.243762e-01

Photon flux (15-150 keV)    in 76.86 sec: 0.171744 ( -0.014916  0.014903 ) ph/cm2/s
Energy fluence (15-150 keV)             : 8.20788e-07 ( -9.57291e-08  9.82348e-08 ) ergs/cm2
Band function

Spectral model in the Band function:
------------------------------------------------------------
Parameters  : value       lower 90%   higher 90%
alpha       : -1.48665   ( 1.58667   0.637846 )
beta        : -10.0000    ( 10   1.06581e-14 )
Epeak [keV] : 52.1356      ( -30.5034 -52.1356 )
Norm@50keV   : 2.10666E-03    ( -0.00101142   0.00299017 )
------------------------------------------------------------
#Fit statistic : Chi-Squared =          41.59 using 59 PHA bins.
# Reduced chi-squared =         0.7562 for     55 degrees of freedom
# Null hypothesis probability =   9.090881e-01

Photon flux (15-150 keV)    in 76.86 sec: 0.171350 ( 6.82865  -0.01366 ) ph/cm2/s
Energy fluence (15-150 keV)             : 8.245e-07 ( 0  0 ) ergs/cm2
S(25-50 keV) vs. S(50-100 keV) plot

S(25-50 keV)  = 2.52e-07
S(50-100 keV) = 2.67e-07
T90 vs. Hardness ratio plot

T90                                   = 60.6920000314713 sec.
Hardness ratio (energy fluence ratio) = 1.05952
Color vs. Color plot

Count Ratio  (25-50 keV) / (15-25 keV) = 1.11811
Count Ratio (50-100 keV) / (15-25 keV) = 0.579673
Mask shadow pattern

IMX = 3.237772217447339E-01, IMY = 8.145229681387896E-02
TIME vs. PHA plot around the trigger time

TIME vs. DetID plot around the trigger time

100 us light curve (15-350 keV)

Spacecraft aspect plot

Bright source in the pre-burst/pre-slew/post-slew images
Pre-burst image of 15-350 keV band
Time interval of the image:
-263.899410 -14.432000

# RAcent  DECcent POSerr Theta    Phi  PeakCts   SNR AngSep     Name
#  [deg]    [deg]    ['] [deg]  [deg]                   [']
126.8207 -44.5284    2.4  53.9  161.1   4.9071   4.7 ------	UNKNOWN
 21.8153   0.5255    2.3  47.9   -6.3   1.6255   5.0 ------	UNKNOWN
Pre-slew background subtracted image of 15-350 keV band
Time interval of the image:
-14.432000 62.428000

# RAcent  DECcent POSerr Theta    Phi  PeakCts   SNR AngSep     Name
#  [deg]    [deg]    ['] [deg]  [deg]                   [']
136.7863 -60.2387    2.1  55.0 -178.2   1.9253   5.4 ------	UNKNOWN
 37.3288 -25.1449    0.6  18.5  -14.1   1.6051  18.5 ------	UNKNOWN
Post-slew image of 15-350 keV band
Time interval of the image:
113.300600 789.700590

# RAcent  DECcent POSerr Theta    Phi  PeakCts   SNR AngSep     Name
#  [deg]    [deg]    ['] [deg]  [deg]                   [']
 45.8204   8.6484    2.4  34.8   48.0   2.7793   4.7 ------	UNKNOWN
 30.2910  24.4842    3.2  50.1   24.8   4.8447   3.7 ------	UNKNOWN
Plot creation:
Sun May 31 05:09:44 EDT 2015