Click here for the BAT GCN circular template
Image
Pre-slew 15.0-350.0 keV image (Event data)
#   RAcent    DECcent   POSerr    Theta     Phi              Peak Cts       SNR   Name
  302.4081     4.7471   0.0220    22.4968   -63.6512         0.3837651      8.742 TRIG_00339295

Foreground time interval of the image:
  0.304  12.896 (delta_t =  12.592 [sec])
Background time interval of the image:
-239.704   0.304 (delta_t = 240.008 [sec])
Lightcurves
Notes:
- 1) The mask-weighted light curves are using the flight position.
- 2) Multiple plots of different time binning/intervals are shown to cover all scenarios of short/long GRBs, rate/image triggers, and real/false positives.
- 3) For all the mask-weighted lightcurves, the y-axis units are counts/sec/det where a det is 0.4 x 0.4 = 0.16 sq cm.
- 4) The verticle lines correspond to following: green dotted lines are T50 interval, black dotted lines are T90 interval, blue solid line(s) is a spacecraft slew start time, and orange solid line(s) is a spacecraft slew end time.
- 5) Time of each bin is in the middle of the bin.
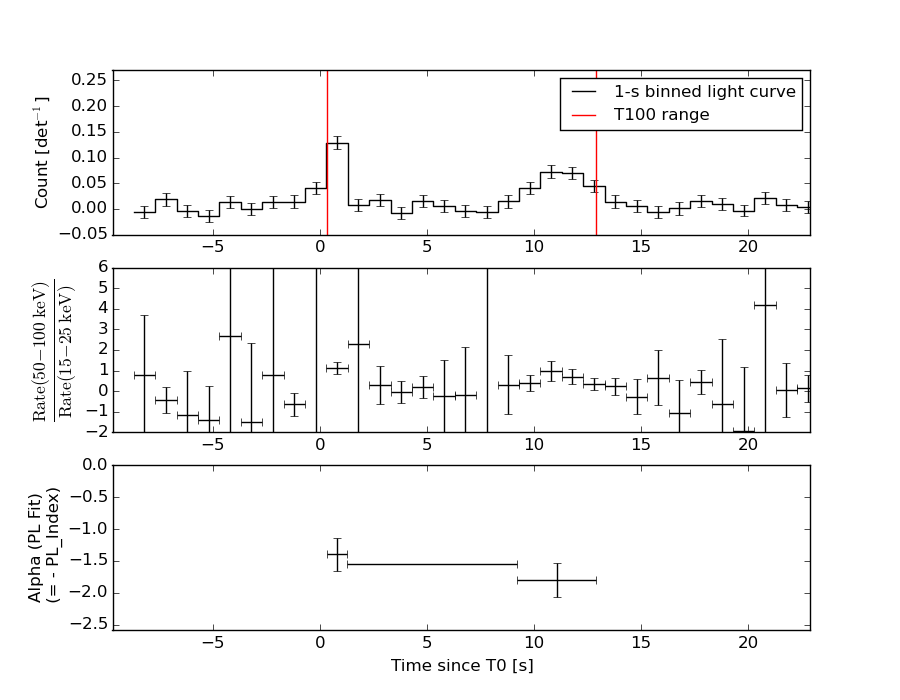
1 s binning
From T0-310 s to T0+310 s
From T100_start - 20 s to T100_end + 30 s
Full time interval
64 ms binning
Full time interval
From T100_start to T100_end
From T0-5 sec to T0+5 sec
16 ms binning
From T100_start-5 s to T100_start+5 s
Blue+Cyan dotted lines: Time interval of the scaled map
From 0.000000 to 1.024000
8 ms binning
From T100_start-3 s to T100_start+3 s
Blue+Cyan dotted lines: Time interval of the scaled map
From 0.000000 to 1.024000
2 ms binning
From T100_start-1 s to T100_start+1 s
Blue+Cyan dotted lines: Time interval of the scaled map
From 0.000000 to 1.024000
SN=5 or 10 sec. binning (whichever binning is satisfied first)
SN=5 or 10 sec. binning (T < 200 sec)
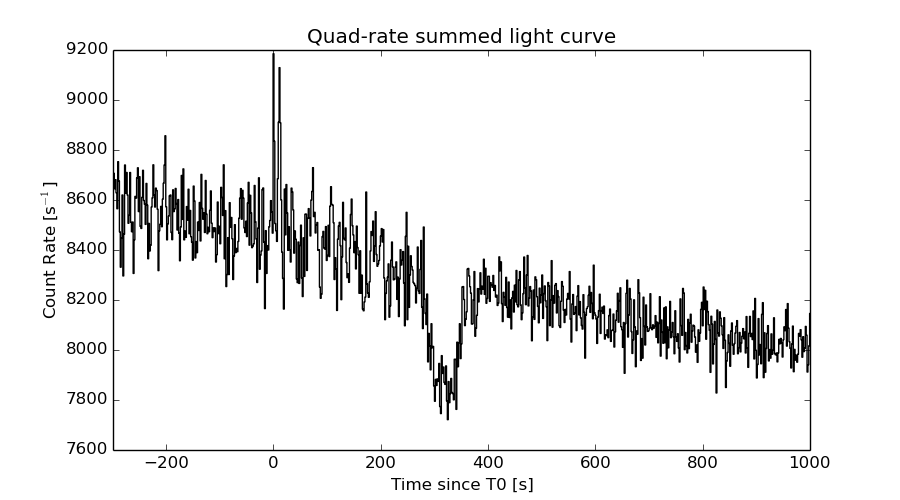
Quad-rate summed light curves (from T0-300s to T0+1000s)
Spectral Evolution
Spectra
Notes:
- 1) The fitting includes the systematic errors.
- 2) When the burst includes telescope slew time periods, the fitting uses an average response file made from multiple 5-s response files through out the slew time plus single time preiod for the non-slew times, and weighted by the total counts in the corresponding time period using addrmf. An average response file is needed becuase a spectral fit using the pre-slew DRM will introduce some errors in both a spectral shape and a normalization if the PHA file contains a lot of the slew/post-slew time interval.
- 3) For fits to more complicated models (e.g. a power-law over a cutoff power-law), the BAT team has decided to require a chi-square improvement of more than 6 for each extra dof.
Time averaged spectrum fit using the average DRM
Power-law model

Time interval is from    0.304 sec. to   12.896 sec.

Spectral model in power-law:
------------------------------------------------------------
Parameters  : value       lower 90%   higher 90%
Photon index: 1.63677     ( -0.266597   0.27627 )
Norm@50keV  : 1.96367E-03    ( -0.000363724   0.00035791 )
------------------------------------------------------------
#Fit statistic : Chi-Squared =          69.12 using 59 PHA bins.
# Reduced chi-squared =          1.213 for     57 degrees of freedom
# Null hypothesis probability =   1.302737e-01

Photon flux (15-150 keV)    in 12.59 sec: 0.255299 ( -0.0421889  0.0421968 ) ph/cm2/s
Energy fluence (15-150 keV)             : 2.30245e-07 ( -4.46701e-08  4.61644e-08 ) ergs/cm2
Cutoff power-law model

Time interval is from    0.304 sec. to   12.896 sec.
Spectral model in the cutoff power-law:
------------------------------------------------------------
Parameters  : value       lower 90%   higher 90%
Photon index: -0.302921     ( -2.44872   1.44802 )
Epeak [keV] : 48.6623      ( -10.3133 29.8929 )
Norm@50keV  : 2.63700E-02    ( -0.026671   0.84567 )
------------------------------------------------------------
#Fit statistic : Chi-Squared =          63.23 using 59 PHA bins.
# Reduced chi-squared =          1.129 for     56 degrees of freedom
# Null hypothesis probability =   2.363154e-01

Photon flux (15-150 keV)    in 12.59 sec: 0.240540 ( -0.042586  0.043049 ) ph/cm2/s
Energy fluence (15-150 keV)             : 1.89127e-07 ( -4.45787e-08  5.20382e-08 ) ergs/cm2
Band function

Time interval is from    0.304 sec. to   12.896 sec.

Spectral model in the Band function:
------------------------------------------------------------
Parameters  : value       lower 90%   higher 90%
alpha       : 0.255160   ( -0.688411   1.42017 )
beta        : -10.00000    ( 10   20 )
Epeak [keV] : 49.0508      ( -9.82527 29.5986 )
Norm@50keV   : 2.46118E-02    ( -0.00394882   0.849555 )
------------------------------------------------------------
#Fit statistic : Chi-Squared =          63.23 using 59 PHA bins.
# Reduced chi-squared =          1.150 for     55 degrees of freedom
# Null hypothesis probability =   2.084574e-01

Photon flux (15-150 keV)    in 12.59 sec:  (    ) ph/cm2/s
Energy fluence (15-150 keV)             : 2.03004e-07 ( 0  0 ) ergs/cm2
Single BB
Spectral model blackbody:
------------------------------------------------------------
Parameters  : value    Lower 90%  Upper 90%
kT [keV]    : 11.2989  (-1.80239  2.28646)
R^2/D10^2   : 8.25213E-02  (-0.0407344   0.0737912)
(R is the radius in km and D10 is the distance to the source in units of 10 kpc)
------------------------------------------------------------
#Fit statistic : Chi-Squared =          64.47 using 59 PHA bins.
# Reduced chi-squared =          1.131 for     57 degrees of freedom
# Null hypothesis probability =   2.316991e-01

Energy  Fluence     90% Error
[keV]   [erg/cm2]   [erg/cm2]
15- 25  2.785e-08   8.322e-09
25- 50  8.147e-08   1.934e-08
50-150  5.995e-08   2.602e-08
15-150  1.693e-07   4.053e-08
Thermal bremsstrahlung (OTTB)

Spectral model: thermal bremsstrahlung
------------------------------------------------------------
Parameters  : value         Lower 90%    Upper 90%
kT [keV]    : 124.311       (-56.5207      -122.353)
Norm        : 1.09055       (-0.193187     0.265049)
------------------------------------------------------------
#Fit statistic : Chi-Squared =          66.58 using 59 PHA bins.
# Reduced chi-squared =          1.168 for     57 degrees of freedom
# Null hypothesis probability =   1.805522e-01

Energy  Fluence     90% Error
[keV]   [erg/cm2]   [erg/cm2]
15- 25  3.571e-08   2.028e-08
25- 50  6.427e-08   3.589e-08
50-150  1.167e-07   7.711e-08
15-150  2.166e-07   1.319e-07
Double BB
Spectral model: bbodyrad<1> + bbodyrad<2>
------------------------------------------------------------
Parameters  : value         Lower 90%    Upper 90%
kT1 [keV]   : 8.57263        (-8.71969      3.2103)
R1^2/D10^2  : 0.160483        (-0.155214      0.372816)
kT2 [keV]   : 22.1554        (-18.0595      -24.4439)
R2^2/D10^2  : 3.27419E-03    (-0.00244661   0.0791093)
------------------------------------------------------------
#Fit statistic : Chi-Squared =          61.79 using 59 PHA bins.
# Reduced chi-squared =          1.123 for     55 degrees of freedom
# Null hypothesis probability =   2.465513e-01

Energy  Fluence     90% Error
[keV]   [erg/cm2]   [erg/cm2]
15- 25  3.186e-08   2.094e-08
25- 50  7.514e-08   4.848e-08
50-150  9.084e-08   5.563e-08
15-150  1.978e-07   1.157e-07
Peak spectrum fit
Power-law model

Time interval is from    0.296 sec. to    1.296 sec.

Spectral model in power-law:
------------------------------------------------------------
Parameters  : value       lower 90%   higher 90%
Photon index: 1.40571     ( -0.258618   0.26206 )
Norm@50keV  : 8.59270E-03    ( -0.00136388   0.00135129 )
------------------------------------------------------------
#Fit statistic : Chi-Squared =          47.18 using 59 PHA bins.
# Reduced chi-squared =         0.8277 for     57 degrees of freedom
# Null hypothesis probability =   8.199289e-01

Photon flux (15-150 keV)    in 1 sec: 1.04779 ( -0.160598  0.160698 ) ph/cm2/s
Energy fluence (15-150 keV)             : 8.29325e-08 ( -1.46505e-08  1.49457e-08 ) ergs/cm2
Cutoff power-law model
Time interval is from    0.296 sec. to    1.296 sec.
Spectral model in the cutoff power-law:
------------------------------------------------------------
Parameters  : value       lower 90%   higher 90%
Photon index: 0.809342     ( -1.13833   0.781696 )
Epeak [keV] : 98.4736      (   )
Norm@50keV  : 1.73956E-02    (     )
------------------------------------------------------------
#Fit statistic : Chi-Squared =          45.98 using 59 PHA bins.
# Reduced chi-squared =         0.8211 for     56 degrees of freedom
# Null hypothesis probability =   8.278934e-01

Photon flux (15-150 keV)    in 1 sec: 1.02485 ( -0.164489  0.16448 ) ph/cm2/s
Energy fluence (15-150 keV)             : 7.91777e-08 ( -1.57092e-08  1.6071e-08 ) ergs/cm2
Band function

Time interval is from    0.296 sec. to    1.296 sec.

Spectral model in the Band function:
------------------------------------------------------------
Parameters  : value       lower 90%   higher 90%
alpha       : -0.879350   ( -0.554509   1.17892 )
beta        : -9.36918    ( 9.37146   19.3715 )
Epeak [keV] : 103.918      ( -52.2331 -104.096 )
Norm@50keV   : 1.61302E-02    ( -0.00852537   0.0487727 )
------------------------------------------------------------
#Fit statistic : Chi-Squared =          45.99 using 59 PHA bins.
# Reduced chi-squared =         0.8363 for     55 degrees of freedom
# Null hypothesis probability =   8.012368e-01

Photon flux (15-150 keV)    in 1 sec: 1.02752 ( 5.97248  -0.156177 ) ph/cm2/s
Energy fluence (15-150 keV)             : 7.96408e-08 ( -7.96338e-08  -1.62206e-08 ) ergs/cm2
Single BB
Spectral model blackbody:
------------------------------------------------------------
Parameters  : value    Lower 90%  Upper 90%
kT [keV]    : 15.4690  (-2.98408  3.81566)
R^2/D10^2   : 0.109802  (-0.0579981   0.119992)
(R is the radius in km and D10 is the distance to the source in units of 10 kpc)
------------------------------------------------------------
#Fit statistic : Chi-Squared =          54.43 using 59 PHA bins.
# Reduced chi-squared =         0.9548 for     57 degrees of freedom
# Null hypothesis probability =   5.722417e-01

Energy  Fluence     90% Error
[keV]   [erg/cm2]   [erg/cm2]
15- 25  5.471e-09   1.701e-09
25- 50  2.235e-08   5.815e-09
50-150  3.689e-08   1.219e-08
15-150  6.471e-08   1.651e-08
Thermal bremsstrahlung (OTTB)
Spectral model: thermal bremsstrahlung
------------------------------------------------------------
Parameters  : value         Lower 90%    Upper 90%
kT [keV]    : 199.363       (-79.957      -199.363)
Norm        : 4.30363       (-0.655399     0.655398)
------------------------------------------------------------
#Fit statistic : Chi-Squared =          47.12 using 59 PHA bins.
# Reduced chi-squared =         0.8266 for     57 degrees of freedom
# Null hypothesis probability =   8.216912e-01

Energy  Fluence     90% Error
[keV]   [erg/cm2]   [erg/cm2]
15- 25  1.072e-08   6.185e-09
25- 50  2.061e-08   1.180e-08
50-150  4.521e-08   2.557e-08
15-150  7.654e-08   4.365e-08
Double BB
Spectral model: bbodyrad<1> + bbodyrad<2>
------------------------------------------------------------
Parameters  : value         Lower 90%    Upper 90%
kT1 [keV]   : 6.84019        (-2.66805      3.60419)
R1^2/D10^2  : 1.04947        (-0.759697      5.3422)
kT2 [keV]   : 25.2007        (-7.36365      18.6695)
R2^2/D10^2  : 1.66877E-02    (-0.0143041   0.042937)
------------------------------------------------------------
#Fit statistic : Chi-Squared =          44.68 using 59 PHA bins.
# Reduced chi-squared =         0.8123 for     55 degrees of freedom
# Null hypothesis probability =   8.386706e-01

Energy  Fluence     90% Error
[keV]   [erg/cm2]   [erg/cm2]
15- 25  9.530e-09   5.640e-09
25- 50  2.052e-08   1.076e-08
50-150  5.065e-08   2.882e-08
15-150  8.070e-08   4.260e-08
Pre-slew spectrum (Pre-slew PHA with pre-slew DRM)
Power-law model
Spectral model in power-law:
------------------------------------------------------------
Parameters  : value       lower 90%   higher 90%
Photon index: 1.63677     ( -0.266597   0.27627 )
Norm@50keV  : 1.96367E-03    ( -0.000363724   0.00035791 )
------------------------------------------------------------
#Fit statistic : Chi-Squared =          69.12 using 59 PHA bins.
# Reduced chi-squared =          1.213 for     57 degrees of freedom
# Null hypothesis probability =   1.302737e-01

Photon flux (15-150 keV)    in 12.59 sec: 0.255299 ( -0.0421889  0.0421968 ) ph/cm2/s
Energy fluence (15-150 keV)             : 2.30245e-07 ( -4.46701e-08  4.61644e-08 ) ergs/cm2
Cutoff power-law model
Spectral model in the cutoff power-law:
------------------------------------------------------------
Parameters  : value       lower 90%   higher 90%
Photon index: -0.302921     ( -2.44872   1.44802 )
Epeak [keV] : 48.6623      ( -10.3133 29.8929 )
Norm@50keV  : 2.63700E-02    ( -0.026671   0.84567 )
------------------------------------------------------------
#Fit statistic : Chi-Squared =          63.23 using 59 PHA bins.
# Reduced chi-squared =          1.129 for     56 degrees of freedom
# Null hypothesis probability =   2.363154e-01

Photon flux (15-150 keV)    in 12.59 sec: 0.240540 ( -0.042586  0.043049 ) ph/cm2/s
Energy fluence (15-150 keV)             : 1.89127e-07 ( -4.45787e-08  5.20382e-08 ) ergs/cm2
Band function

Spectral model in the Band function:
------------------------------------------------------------
Parameters  : value       lower 90%   higher 90%
alpha       : 0.255160   ( -0.688411   1.42017 )
beta        : -10.00000    ( 10   3.9968e-11 )
Epeak [keV] : 49.0508      ( -9.82527 29.5986 )
Norm@50keV   : 2.46118E-02    ( -0.00394882   0.849555 )
------------------------------------------------------------
#Fit statistic : Chi-Squared =          63.23 using 59 PHA bins.
# Reduced chi-squared =          1.150 for     55 degrees of freedom
# Null hypothesis probability =   2.084574e-01

Photon flux (15-150 keV)    in 12.59 sec:  (    ) ph/cm2/s
Energy fluence (15-150 keV)             : 2.03004e-07 ( 0  0 ) ergs/cm2
S(25-50 keV) vs. S(50-100 keV) plot
S(25-50 keV)  = 6.07e-08
S(50-100 keV) = 7.81e-08
T90 vs. Hardness ratio plot
T90                                   = 12.0840000212193 sec.
Hardness ratio (energy fluence ratio) = 1.28666
Color vs. Color plot
Count Ratio  (25-50 keV) / (15-25 keV) = 1.39158
Count Ratio (50-100 keV) / (15-25 keV) = 0.747399
Mask shadow pattern
IMX = 1.838131844421850E-01, IMY = 3.711207899623837E-01
TIME vs. PHA plot around the trigger time
Blue+Cyan dotted lines: Time interval of the scaled map
From 0.000000 to 1.024000
TIME vs. DetID plot around the trigger time
Blue+Cyan dotted lines: Time interval of the scaled map
From 0.000000 to 1.024000
100 us light curve (15-350 keV)
Blue+Cyan dotted lines: Time interval of the scaled map
From 0.000000 to 1.024000
Spacecraft aspect plot

Bright source in the pre-burst/pre-slew/post-slew images
Pre-burst image of 15-350 keV band
Time interval of the image:
-239.704000 0.304000

# RAcent  DECcent POSerr Theta    Phi  PeakCts   SNR AngSep     Name
#  [deg]    [deg]    ['] [deg]  [deg]                   [']
288.7764  10.9486    1.2  31.4  -36.8   2.3661   9.2    1.3	GRS 1915+105
299.5834  35.2056    0.4  24.4   19.3   6.7163  30.8    0.4	Cyg X-1
308.0854  40.9848    1.5  24.3   40.9   1.7815   7.8    2.2	Cyg X-3
326.2165  38.2234    5.9  19.9   77.6   0.4670   1.9    6.3	Cyg X-2
291.1140  57.4075    2.9  44.0   41.4   2.4341   4.0 ------	UNKNOWN
 13.4975   3.5339    2.9  54.3  163.3   4.5756   4.0 ------	UNKNOWN
269.2900  29.6840    2.8  47.2   -3.2   1.6774   4.1 ------	UNKNOWN
273.3747  -1.7047    3.0  50.5  -45.4   4.5677   3.9 ------	UNKNOWN
303.9722 -18.5668    3.7  40.9  -92.5   3.4882   3.2 ------	UNKNOWN
Pre-slew background subtracted image of 15-350 keV band
Time interval of the image:
0.304000 12.896000

# RAcent  DECcent POSerr Theta    Phi  PeakCts   SNR AngSep     Name
#  [deg]    [deg]    ['] [deg]  [deg]                   [']
288.7902  10.9942   14.4  31.3  -36.7  -0.0372  -0.8    3.0	GRS 1915+105
299.5548  35.1749    6.3  24.4   19.2   0.0771   1.8    2.4	Cyg X-1
308.1380  40.8330   10.8  24.1   40.8   0.0504   1.1    7.3	Cyg X-3
326.1090  38.5187    0.0  20.1   77.1  -0.1023  -2.1   12.2	Cyg X-2
359.1220  42.7505    2.5  40.4  109.0   0.7263   4.7 ------	UNKNOWN
277.6106  16.2390    2.5  40.6  -23.5   0.2495   4.6 ------	UNKNOWN
302.4081   4.7472    1.3  22.5  -63.7   0.3837   8.7 ------	UNKNOWN
Post-slew image of 15-350 keV band
Time interval of the image:
368.396600 962.416000

# RAcent  DECcent POSerr Theta    Phi  PeakCts   SNR AngSep     Name
#  [deg]    [deg]    ['] [deg]  [deg]                   [']
 83.6355  22.0080    0.2  24.3  122.7  26.1086  48.9    0.4	Crab
122.1008  28.7485    2.5  40.2   59.7   6.3705   4.7 ------	UNKNOWN
 52.1811   2.7798    2.7  47.1  174.1   3.8073   4.2 ------	UNKNOWN
107.0907  56.2953    2.8  22.6   11.3   1.7051   4.0 ------	UNKNOWN
178.7683  64.5774    3.3  55.1   -7.6   5.6271   3.5 ------	UNKNOWN
 32.7373  -0.0620    2.8  58.8 -166.0  12.1613   4.1 ------	UNKNOWN
234.8645  83.2232    4.3  51.1  -35.1   4.4877   2.7 ------	UNKNOWN
 11.5817  53.2742    3.8  40.9  -93.2   7.8230   3.1 ------	UNKNOWN
Plot creation:
Sun May 31 05:05:12 EDT 2015