Click here for the BAT GCN circular template
Image
Pre-slew 15.0-350.0 keV image (Event data)
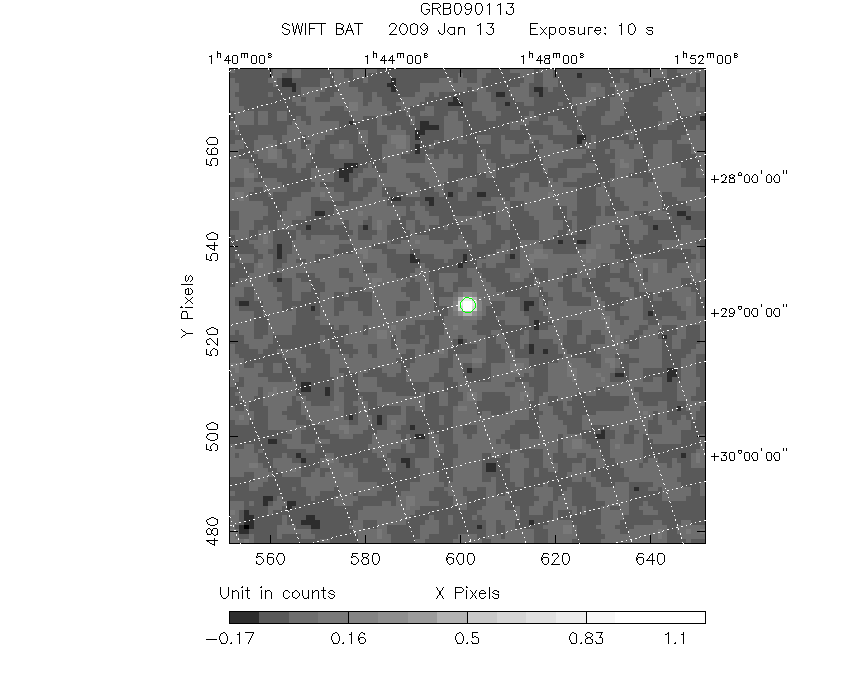
#   RAcent    DECcent   POSerr    Theta     Phi              Peak Cts       SNR   Name
   32.0680    33.4372   0.0060    30.7111   -10.4008         1.2824686     31.864 TRIG_00339852

Foreground time interval of the image:
 -0.920   9.317 (delta_t =  10.237 [sec])
Background time interval of the image:
-62.683  -0.920 (delta_t =  61.763 [sec])
Lightcurves
Notes:
- 1) The mask-weighted light curves are using the flight position.
- 2) Multiple plots of different time binning/intervals are shown to cover all scenarios of short/long GRBs, rate/image triggers, and real/false positives.
- 3) For all the mask-weighted lightcurves, the y-axis units are counts/sec/det where a det is 0.4 x 0.4 = 0.16 sq cm.
- 4) The verticle lines correspond to following: green dotted lines are T50 interval, black dotted lines are T90 interval, blue solid line(s) is a spacecraft slew start time, and orange solid line(s) is a spacecraft slew end time.
- 5) Time of each bin is in the middle of the bin.
1 s binning
From T0-310 s to T0+310 s

From T100_start - 20 s to T100_end + 30 s

Full time interval

64 ms binning
Full time interval

From T100_start to T100_end

From T0-5 sec to T0+5 sec

16 ms binning
From T100_start-5 s to T100_start+5 s

Blue+Cyan dotted lines: Time interval of the scaled map
From 0.000000 to 0.128000
8 ms binning
From T100_start-3 s to T100_start+3 s

Blue+Cyan dotted lines: Time interval of the scaled map
From 0.000000 to 0.128000
2 ms binning
From T100_start-1 s to T100_start+1 s

Blue+Cyan dotted lines: Time interval of the scaled map
From 0.000000 to 0.128000
SN=5 or 10 sec. binning (whichever binning is satisfied first)

SN=5 or 10 sec. binning (T < 200 sec)

Quad-rate summed light curves (from T0-300s to T0+1000s)

Spectral Evolution

Spectra
Notes:
- 1) The fitting includes the systematic errors.
- 2) When the burst includes telescope slew time periods, the fitting uses an average response file made from multiple 5-s response files through out the slew time plus single time preiod for the non-slew times, and weighted by the total counts in the corresponding time period using addrmf. An average response file is needed becuase a spectral fit using the pre-slew DRM will introduce some errors in both a spectral shape and a normalization if the PHA file contains a lot of the slew/post-slew time interval.
- 3) For fits to more complicated models (e.g. a power-law over a cutoff power-law), the BAT team has decided to require a chi-square improvement of more than 6 for each extra dof.
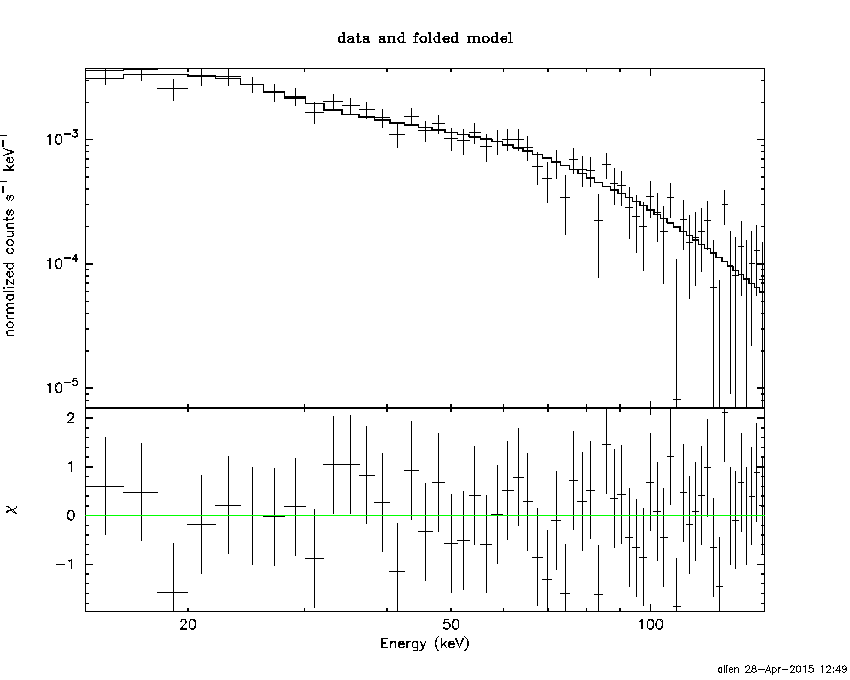
Time averaged spectrum fit using the average DRM
Power-law model

Time interval is from   -0.920 sec. to    9.952 sec.

Spectral model in power-law:
------------------------------------------------------------
Parameters  : value       lower 90%   higher 90%
Photon index: 1.53192     ( -0.0971388   0.0977696 )
Norm@50keV  : 7.54977E-03    ( -0.000403832   0.000402695 )
------------------------------------------------------------
#Fit statistic : Chi-Squared =          39.56 using 59 PHA bins.
# Reduced chi-squared =         0.6941 for     57 degrees of freedom
# Null hypothesis probability =   9.619273e-01

Photon flux (15-150 keV)    in 10.87 sec: 0.950830 ( -0.0515544  0.0516914 ) ph/cm2/s
Energy fluence (15-150 keV)             : 7.74628e-07 ( -4.51614e-08  4.54007e-08 ) ergs/cm2
Cutoff power-law model
Time interval is from   -0.920 sec. to    9.952 sec.
Spectral model in the cutoff power-law:
------------------------------------------------------------
Parameters  : value       lower 90%   higher 90%
Photon index: 1.50774     ( -0.376589   0.120096 )
Epeak [keV] : 995.005      ( -997.432 -997.432 )
Norm@50keV  : 7.76999E-03    ( -0.000597736   0.00403367 )
------------------------------------------------------------
#Fit statistic : Chi-Squared =          39.56 using 59 PHA bins.
# Reduced chi-squared =         0.7064 for     56 degrees of freedom
# Null hypothesis probability =   9.529207e-01

Photon flux (15-150 keV)    in 10.87 sec: 0.947796 ( -0.05321  0.040755 ) ph/cm2/s
Energy fluence (15-150 keV)             : 7.71763e-07 ( -4.87759e-08  4.82889e-08 ) ergs/cm2
Band function

Time interval is from   -0.920 sec. to    9.952 sec.

Spectral model in the Band function:
------------------------------------------------------------
Parameters  : value       lower 90%   higher 90%
alpha       : -1.09371   ( 1.09712   1.09712 )
beta        : -1.58244    ( 1.58217   0.140317 )
Epeak [keV] : 73.4233      ( -74.5536 -74.5536 )
Norm@50keV   : 1.39944E-02    ( -0.00654279   0 )
------------------------------------------------------------
#Fit statistic : Chi-Squared =          39.20 using 59 PHA bins.
# Reduced chi-squared =         0.7126 for     55 degrees of freedom
# Null hypothesis probability =   9.469960e-01

Photon flux (15-150 keV)    in 10.87 sec:  (    ) ph/cm2/s
Energy fluence (15-150 keV)             : 0 ( 0  0 ) ergs/cm2
Single BB

Spectral model blackbody:
------------------------------------------------------------
Parameters  : value    Lower 90%  Upper 90%
kT [keV]    : 14.7308  (  )
R^2/D10^2   : 0.110754  (   )
(R is the radius in km and D10 is the distance to the source in units of 10 kpc)
------------------------------------------------------------
#Fit statistic : Chi-Squared =         129.86 using 59 PHA bins.
# Reduced chi-squared =         2.2782 for     57 degrees of freedom
# Null hypothesis probability =   1.307771e-07

Energy  Fluence     90% Error
[keV]   [erg/cm2]   [erg/cm2]
15- 25  5.485e-08   5.739e-09
25- 50  2.143e-07   1.408e-08
50-150  3.139e-07   3.370e-08
15-150  5.830e-07   3.848e-08
Thermal bremsstrahlung (OTTB)
Spectral model: thermal bremsstrahlung
------------------------------------------------------------
Parameters  : value         Lower 90%    Upper 90%
kT [keV]    : 200.000       (      )
Norm        : 3.85754       (-0.201442     0.201443)
------------------------------------------------------------
#Fit statistic : Chi-Squared =          41.40 using 59 PHA bins.
# Reduced chi-squared =         0.7263 for     57 degrees of freedom
# Null hypothesis probability =   9.402822e-01

Energy  Fluence     90% Error
[keV]   [erg/cm2]   [erg/cm2]
15- 25  1.046e-07   6.506e-09
25- 50  2.013e-07   1.228e-08
50-150  4.414e-07   2.853e-08
15-150  7.473e-07   9.397e-08
Double BB

Spectral model: bbodyrad<1> + bbodyrad<2>
------------------------------------------------------------
Parameters  : value         Lower 90%    Upper 90%
kT1 [keV]   : 7.88297        (-1.35657      1.44337)
R1^2/D10^2  : 0.703688        (-0.287783      0.605428)
kT2 [keV]   : 32.1868        (-7.08653      14.6509)
R2^2/D10^2  : 5.74443E-03    (-0.00388625   0.00789585)
------------------------------------------------------------
#Fit statistic : Chi-Squared =          43.53 using 59 PHA bins.
# Reduced chi-squared =         0.7915 for     55 degrees of freedom
# Null hypothesis probability =   8.676163e-01

Energy  Fluence     90% Error
[keV]   [erg/cm2]   [erg/cm2]
15- 25  9.468e-08   1.633e-08
25- 50  2.064e-07   3.679e-08
50-150  4.720e-07   1.382e-07
15-150  7.731e-07   1.963e-07
Peak spectrum fit
Power-law model

Time interval is from    1.456 sec. to    2.456 sec.

Spectral model in power-law:
------------------------------------------------------------
Parameters  : value       lower 90%   higher 90%
Photon index: 1.09065     ( -0.123483   0.122017 )
Norm@50keV  : 2.13505E-02    ( -0.00150262   0.00150121 )
------------------------------------------------------------
#Fit statistic : Chi-Squared =          55.22 using 59 PHA bins.
# Reduced chi-squared =         0.9688 for     57 degrees of freedom
# Null hypothesis probability =   5.420462e-01

Photon flux (15-150 keV)    in 1 sec: 2.47431 ( -0.17842  0.178651 ) ph/cm2/s
Energy fluence (15-150 keV)             : 2.23894e-07 ( -1.73681e-08  1.74445e-08 ) ergs/cm2
Cutoff power-law model

Time interval is from    1.456 sec. to    2.456 sec.
Spectral model in the cutoff power-law:
------------------------------------------------------------
Parameters  : value       lower 90%   higher 90%
Photon index: 0.881780     ( -0.524361   0.268653 )
Epeak [keV] : 299.749      ( -299.758 -299.758 )
Norm@50keV  : 2.66464E-02    ( -0.00649666   0.0190121 )
------------------------------------------------------------
#Fit statistic : Chi-Squared =          54.66 using 59 PHA bins.
# Reduced chi-squared =         0.9762 for     56 degrees of freedom
# Null hypothesis probability =   5.255264e-01

Photon flux (15-150 keV)    in 1 sec: 2.45501 ( -0.18398  0.18368 ) ph/cm2/s
Energy fluence (15-150 keV)             : 2.21696e-07 ( -1.8487e-08  1.8266e-08 ) ergs/cm2
Band function

Time interval is from    1.456 sec. to    2.456 sec.

Spectral model in the Band function:
------------------------------------------------------------
Parameters  : value       lower 90%   higher 90%
alpha       : 5.00000   ( -4.99999   -4.99999 )
beta        : -1.10817    ( -0.130553   0.128958 )
Epeak [keV] : 22.6002      ( -22.5999 7.04133 )
Norm@50keV   : 2836.47    ( -198.737   4.46218e+06 )
------------------------------------------------------------
#Fit statistic : Chi-Squared =          54.84 using 59 PHA bins.
# Reduced chi-squared =         0.9971 for     55 degrees of freedom
# Null hypothesis probability =   4.806655e-01

Photon flux (15-150 keV)    in 1 sec:  (    ) ph/cm2/s
Energy fluence (15-150 keV)             : 0 ( 0  0 ) ergs/cm2
Single BB

Spectral model blackbody:
------------------------------------------------------------
Parameters  : value    Lower 90%  Upper 90%
kT [keV]    : 19.9702  (-1.84782  2.12898)
R^2/D10^2   : 0.117976  (-0.032849   0.0436542)
(R is the radius in km and D10 is the distance to the source in units of 10 kpc)
------------------------------------------------------------
#Fit statistic : Chi-Squared =          88.00 using 59 PHA bins.
# Reduced chi-squared =          1.544 for     57 degrees of freedom
# Null hypothesis probability =   5.244343e-03

Energy  Fluence     90% Error
[keV]   [erg/cm2]   [erg/cm2]
15- 25  9.075e-09   1.322e-09
25- 50  4.516e-08   4.660e-09
50-150  1.335e-07   1.555e-08
15-150  1.877e-07   1.695e-08
Thermal bremsstrahlung (OTTB)

Spectral model: thermal bremsstrahlung
------------------------------------------------------------
Parameters  : value         Lower 90%    Upper 90%
kT [keV]    : 200.000       (      )
Norm        : 10.1158       (-0.734625     0.734568)
------------------------------------------------------------
#Fit statistic : Chi-Squared =          92.68 using 59 PHA bins.
# Reduced chi-squared =          1.626 for     57 degrees of freedom
# Null hypothesis probability =   1.966476e-03

Energy  Fluence     90% Error
[keV]   [erg/cm2]   [erg/cm2]
15- 25  2.518e-08   2.140e-09
25- 50  4.844e-08   5.755e-09
50-150  1.062e-07   2.894e-08
15-150  1.799e-07   3.780e-08
Double BB

Spectral model: bbodyrad<1> + bbodyrad<2>
------------------------------------------------------------
Parameters  : value         Lower 90%    Upper 90%
kT1 [keV]   : 11.8051        (-3.30101      2.81394)
R1^2/D10^2  : 0.439846        (-0.189962      0.538518)
kT2 [keV]   : 56.2424        (-25.9518      -58.2302)
R2^2/D10^2  : 3.88828E-03    (-0.00254722   0.0171257)
------------------------------------------------------------
#Fit statistic : Chi-Squared =          55.84 using 59 PHA bins.
# Reduced chi-squared =          1.015 for     55 degrees of freedom
# Null hypothesis probability =   4.429511e-01

Energy  Fluence     90% Error
[keV]   [erg/cm2]   [erg/cm2]
15- 25  1.417e-08   3.896e-09
25- 50  4.902e-08   1.600e-08
50-150  1.565e-07   7.459e-08
15-150  2.197e-07   8.589e-08
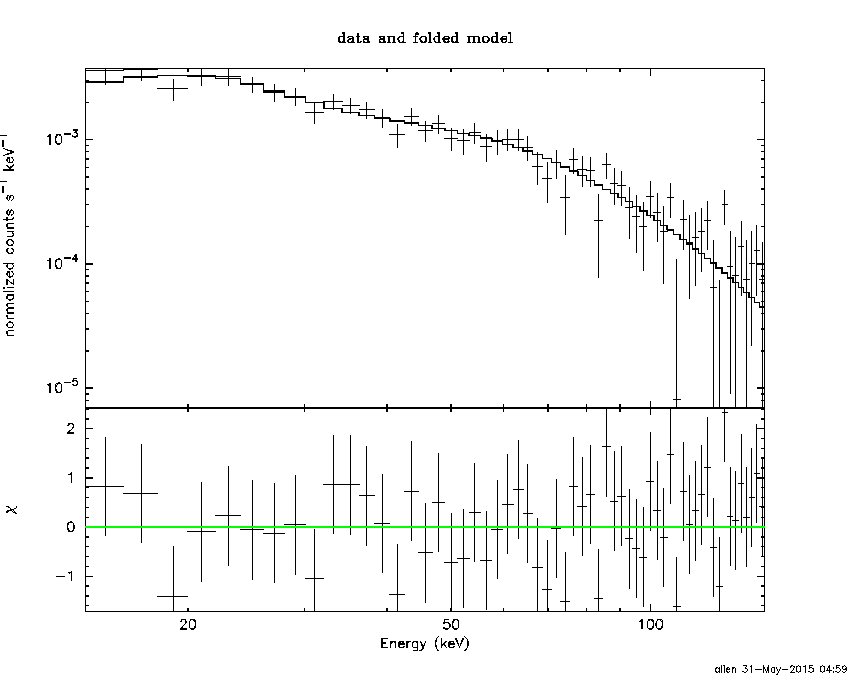
Pre-slew spectrum (Pre-slew PHA with pre-slew DRM)
Power-law model

Spectral model in power-law:
------------------------------------------------------------
Parameters  : value       lower 90%   higher 90%
Photon index: 1.53082     ( -0.0966512   0.097288 )
Norm@50keV  : 7.81842E-03    ( -0.000417795   0.000416628 )
------------------------------------------------------------
#Fit statistic : Chi-Squared =          40.42 using 59 PHA bins.
# Reduced chi-squared =         0.7092 for     57 degrees of freedom
# Null hypothesis probability =   9.526491e-01

Photon flux (15-150 keV)    in 10.24 sec: 0.984357 ( -0.0532661  0.0534043 ) ph/cm2/s
Energy fluence (15-150 keV)             : 7.55825e-07 ( -4.4024e-08  4.42549e-08 ) ergs/cm2
Cutoff power-law model

Spectral model in the cutoff power-law:
------------------------------------------------------------
Parameters  : value       lower 90%   higher 90%
Photon index: 1.47832     ( -0.386003   0.142032 )
Epeak [keV] : 505.839      ( -505.885 -505.885 )
Norm@50keV  : 8.30268E-03    ( -0.000871214   0.00447816 )
------------------------------------------------------------
#Fit statistic : Chi-Squared =          40.36 using 59 PHA bins.
# Reduced chi-squared =         0.7208 for     56 degrees of freedom
# Null hypothesis probability =   9.427531e-01

Photon flux (15-150 keV)    in 10.24 sec: 0.981323 ( -0.05683  0.055697 ) ph/cm2/s
Energy fluence (15-150 keV)             : 7.53e-07 ( -4.95114e-08  4.6761e-08 ) ergs/cm2
Band function

Spectral model in the Band function:
------------------------------------------------------------
Parameters  : value       lower 90%   higher 90%
alpha       : -1.05004   ( 1.05089   5.37712 )
beta        : -1.59157    ( 1.59094   0.144972 )
Epeak [keV] : 71.3628      ( -71.2494 -71.2494 )
Norm@50keV   : 1.52902E-02    ( -0.00781534   0 )
------------------------------------------------------------
#Fit statistic : Chi-Squared =          39.80 using 59 PHA bins.
# Reduced chi-squared =         0.7236 for     55 degrees of freedom
# Null hypothesis probability =   9.387373e-01

Photon flux (15-150 keV)    in 10.24 sec:  (    ) ph/cm2/s
Energy fluence (15-150 keV)             : 0 ( 0  0 ) ergs/cm2
S(25-50 keV) vs. S(50-100 keV) plot

S(25-50 keV)  = 1.95e-07
S(50-100 keV) = 2.69e-07
T90 vs. Hardness ratio plot

T90                                   = 9.0959999859333 sec.
Hardness ratio (energy fluence ratio) = 1.37949
Color vs. Color plot

Count Ratio  (25-50 keV) / (15-25 keV) = 1.35641
Count Ratio (50-100 keV) / (15-25 keV) = 0.982319
Mask shadow pattern

IMX = 5.842578615715518E-01, IMY = 1.072400552650537E-01
TIME vs. PHA plot around the trigger time

Blue+Cyan dotted lines: Time interval of the scaled map
From 0.000000 to 0.128000
TIME vs. DetID plot around the trigger time

Blue+Cyan dotted lines: Time interval of the scaled map
From 0.000000 to 0.128000
100 us light curve (15-350 keV)

Blue+Cyan dotted lines: Time interval of the scaled map
From 0.000000 to 0.128000
Spacecraft aspect plot

Bright source in the pre-burst/pre-slew/post-slew images
Pre-burst image of 15-350 keV band
Time interval of the image:
-62.683400 -0.920000

# RAcent  DECcent POSerr Theta    Phi  PeakCts   SNR AngSep     Name
#  [deg]    [deg]    ['] [deg]  [deg]                   [']
 83.6563  22.0425    1.6  39.4   75.5   2.4565   7.1    2.1	Crab
 63.2262 -43.6368    2.3  51.7  178.1   1.1593   5.0 ------	UNKNOWN
Pre-slew background subtracted image of 15-350 keV band
Time interval of the image:
-0.920000 9.316600

# RAcent  DECcent POSerr Theta    Phi  PeakCts   SNR AngSep     Name
#  [deg]    [deg]    ['] [deg]  [deg]                   [']
 83.7644  21.8968    9.0  39.5   75.7   0.2017   1.3   10.2	Crab
 32.0680  33.4372    0.4  30.7  -10.4   1.2824  31.9 ------	UNKNOWN
 52.4234 -47.8218    2.0  53.9 -171.4   0.5934   5.7 ------	UNKNOWN
Post-slew image of 15-350 keV band
Time interval of the image:
60.116600 550.416600

# RAcent  DECcent POSerr Theta    Phi  PeakCts   SNR AngSep     Name
#  [deg]    [deg]    ['] [deg]  [deg]                   [']
 11.0868  79.0471    3.1  46.4    9.7   2.3473   3.8 ------	UNKNOWN
  1.2801   1.3120    2.4  43.2 -116.5   6.8249   4.8  110.0	UNKNOWN
359.0764   3.2821    3.5  43.1 -112.2   5.4949   3.3  204.6	UNKNOWN
Plot creation:
Sun May 31 05:00:51 EDT 2015