Click here for the BAT GCN circular template
Image
Pre-slew 15-350 keV image (Event data; bkg subtracted)

#   RAcent  DECcent POSerr  Theta    Phi     Peak Cts     SNR  Name
  237.7187 -54.3097 0.0024   35.5 -132.4       7.4150    78.7  TRIG_00341965
------------------------------------------

Foreground time interval of the image:
 -0.084   0.392 (delta_t =   0.476 [sec])
Background time interval of the image:
-219.495  -0.084 (delta_t = 219.411 [sec])
Lightcurves
Notes:
- 1) All plots contain as much data as has been downloaded to date.
- 2) Multiple plots of different time binning/intervals are shown to cover all scenarios of short/long GRBs, rate/image triggers, and real/false positives.
- 3) For all the mask-weighted lightcurves, the y-axis units are counts/sec/det where a det is 0.4 x 0.4 = 0.16 sq cm.
- 4) The verticle lines correspond to following: green dotted lines are T50 interval, black dotted lines are T90 interval, blue solid line(s) is a spacecraft slew start time, and orange solid line(s) is a spacecraft slew end time.
- 5) Time of each bin is in the middle of the bin.
1 s binning
From T0-310 s to T0+310 s

From T100_start - 20 s to T100_end + 30 s

Full time interval

64 ms binning
Full time interval

From T100_start to T100_end

From T0-5 sec to T0+5 sec

16 ms binning
From T100_start-5 s to T100_start+5 s

Blue+Cyan dotted lines: Time interval of the scaled map
From 0.000000 to 0.032000
8 ms binning
From T100_start-3 s to T100_start+3 s

Blue+Cyan dotted lines: Time interval of the scaled map
From 0.000000 to 0.032000
2 ms binning
From T100_start-1 s to T100_start+1 s

Blue+Cyan dotted lines: Time interval of the scaled map
From 0.000000 to 0.032000
SN=5 or 10 sec. binning (whichever binning is satisfied first)

SN=5 or 10 sec. binning (T < 200 sec)

Spectra
Notes:
- 1) The fitting includes the systematic errors.
- 2) For long bursts, a spectral fit of the pre-slew DRM will introduce some errors in both a spectral shape and a normalization if the PHA file contains a lot of the slew/post-slew time interval.
- 3) For fits to more complicated models (e.g. a power-law over a cutoff power-law), the BAT team has decided to require a chi-square improvement of more than 6 for each extra dof.
- 4) For short bursts (T90<1sec), the specrtum is also fit with Blackbody, OTTB, and Double Blackbody.
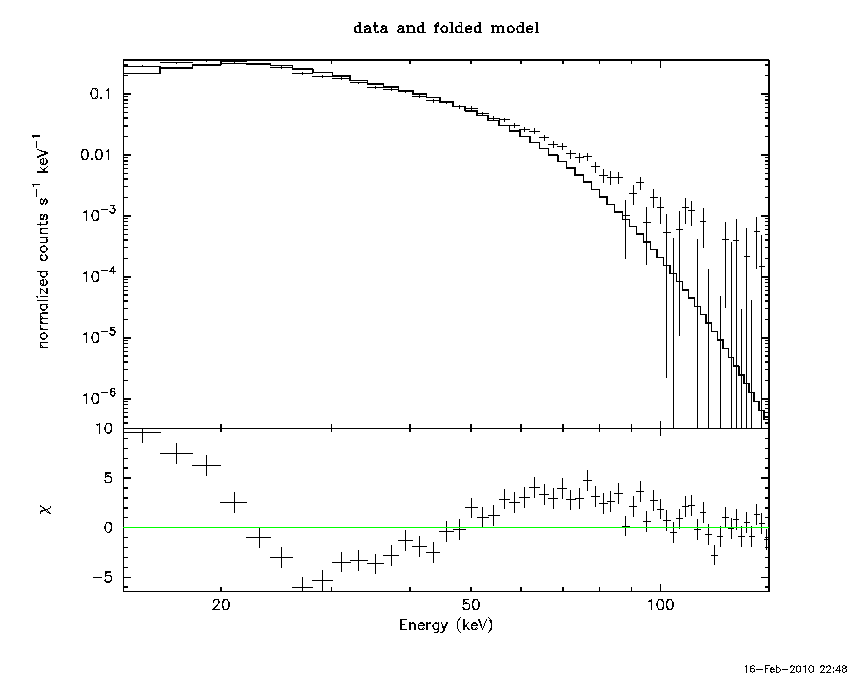
Time averaged spectrum fit using the pre-slew DRM
Power-law model

Time interval is from   -0.084 sec. to    0.392 sec.

Spectral model in power-law:
------------------------------------------------------------
Parameters  : value       lower 90%   higher 90%
Photon index: 3.15763     (     )
Norm@50keV  : 0.591287    (     )
------------------------------------------------------------
# Chi-Squared =         681.18 using 59 PHA bins.
# Reduced chi-squared =         11.950 for     57 degrees of freedom
# Null hypothesis probability =  9.967750e-108

Photon flux (15-150 keV)    in 0.476 sec: 182.765 (    ) ph/cm2/s
Energy fluence (15-150 keV)             : 3.65108e-06 ( 0  0 ) ergs/cm2
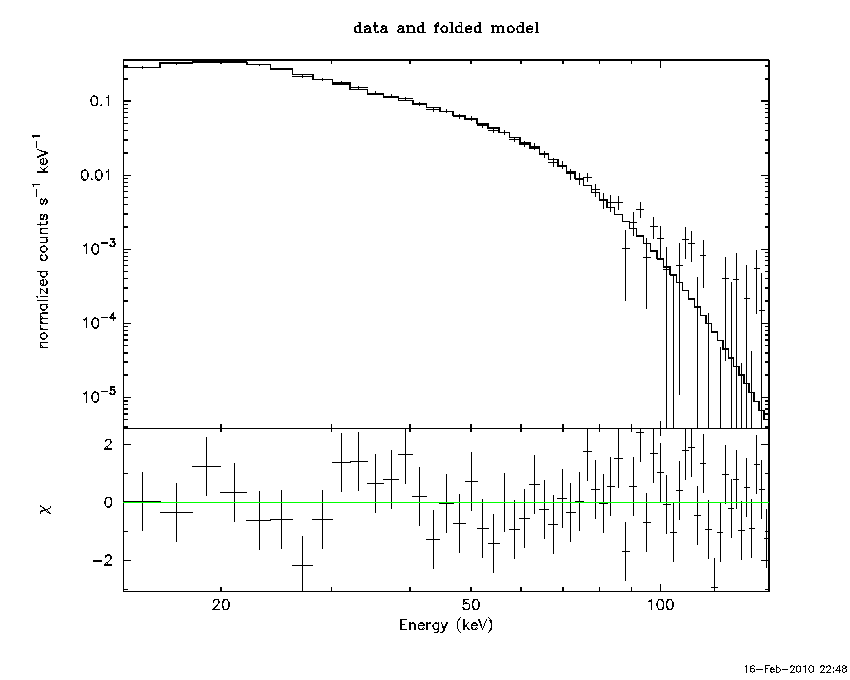
Cutoff power-law model

Time interval is from   -0.084 sec. to    0.392 sec.
Spectral model in the cutoff power-law:
------------------------------------------------------------
Parameters  : value       lower 90%   higher 90%
Photon index: 8.43294E-02     ( -0.275501   0.263092 )
Epeak [keV] : 28.5912      ( -1.64791 1.46185 )
Norm@50keV  : 24.7250    ( -6.71626   9.79173 )
------------------------------------------------------------
# Chi-Squared =          33.27 using 59 PHA bins.
# Reduced chi-squared =         0.5942 for     56 degrees of freedom
# Null hypothesis probability =   9.932381e-01

Photon flux (15-150 keV)    in 0.476 sec: 142.233 ( -5.148  5.227 ) ph/cm2/s
Energy fluence (15-150 keV)             : 3.19179e-06 ( 0  0 ) ergs/cm2
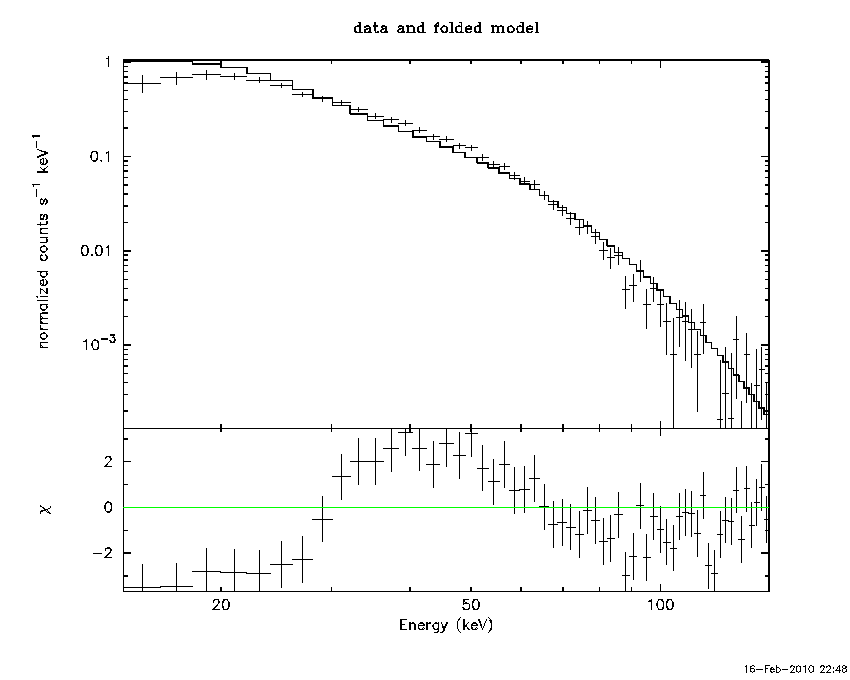
Band function

Time interval is from   -0.084 sec. to    0.392 sec.

Spectral model in the Band function:
------------------------------------------------------------
Parameters  : value       lower 90%   higher 90%
alpha       : -1.81893   (     )
beta        : -9.37167    (     )
Epeak [keV] : 6.06851      (   )
Norm@50keV   : 3.24510    (     )
------------------------------------------------------------
# Chi-Squared =         187.32 using 59 PHA bins.
# Reduced chi-squared =         3.4059 for     55 degrees of freedom
# Null hypothesis probability =   2.468719e-16

Photon flux (15-150 keV)    in 0.476 sec: 141.667 ( -3.98  3.657 ) ph/cm2/s
Energy fluence (15-150 keV)             : 3.18854e-06 ( -7.18298e-08  7.1877e-08 ) ergs/cm2
Single BB

Spectral model blackbody:
------------------------------------------------------------
Parameters  : value    Lower 90%  Upper 90%
kT [keV]    : 8.81034  (  )
R^2/D10^2   : 107.288  (   )
(R is the radius in km and D10 is the distance to the source in units of 10 kpc)
------------------------------------------------------------
# Chi-Squared =         127.12 using 59 PHA bins.
# Reduced chi-squared =         2.2302 for     57 degrees of freedom
# Null hypothesis probability =   2.904728e-07

Energy  Fluence     90% Error
[keV]   [erg/cm2]   [erg/cm2]
15- 25  7.630e-07   2.975e-08
25- 50  1.568e-06   3.808e-08
50-150  5.603e-07   2.309e-08
15-150  2.891e-06   6.521e-08
Thermal bremsstrahlung (OTTB)

Spectral model: thermal bremsstrahlung
------------------------------------------------------------
Parameters  : value         Lower 90%    Upper 90%
kT [keV]    : 26.3645       (-0.697316      0.719161)
Norm        : 1497.30       (-65.9752     68.8511)
------------------------------------------------------------
# Chi-Squared =         110.62 using 59 PHA bins.
# Reduced chi-squared =         1.9408 for     57 degrees of freedom
# Null hypothesis probability =   2.706093e-05

Energy  Fluence     90% Error
[keV]   [erg/cm2]   [erg/cm2]
15- 25  1.350e-06   4.260e-08
25- 50  1.430e-06   3.284e-08
50-150  6.566e-07   2.618e-08
15-150  3.436e-06   7.307e-08
Double BB

Spectral model: bbodyrad<1> + bbodyrad<2>
------------------------------------------------------------
Parameters  : value         Lower 90%    Upper 90%
kT1 [keV]   : 5.72855        (-1.07021      1.03445)
R1^2/D10^2  : 352.921        (-127.253      369.298)
kT2 [keV]   : 10.7420        (-0.786128      1.36711)
R2^2/D10^2  : 28.6780    (-16.972   20.4704)
------------------------------------------------------------
# Chi-Squared =          37.80 using 59 PHA bins.
# Reduced chi-squared =         0.6872 for     55 degrees of freedom
# Null hypothesis probability =   9.629452e-01

Energy  Fluence     90% Error
[keV]   [erg/cm2]   [erg/cm2]
15- 25  1.011e-06   1.209e-07
25- 50  1.513e-06   1.007e-07
50-150  6.208e-07   7.711e-08
15-150  3.144e-06   2.554e-07
Peak spectrum fit
Power-law model

Time interval is from   -0.344 sec. to    0.656 sec.

Spectral model in power-law:
------------------------------------------------------------
Parameters  : value       lower 90%   higher 90%
Photon index: 2.66647     (     )
Norm@50keV  : 0.299519    (     )
------------------------------------------------------------
# Chi-Squared =        1893.36 using 59 PHA bins.
# Reduced chi-squared =        33.2168 for     57 degrees of freedom
# Null hypothesis probability =   0.000000e+00

Photon flux (15-150 keV)    in 1 sec: 181.182 (    ) ph/cm2/s
Energy fluence (15-150 keV)             : 7.60626e-06 ( 0  0 ) ergs/cm2
Cutoff power-law model

Time interval is from   -0.344 sec. to    0.656 sec.
Spectral model in the cutoff power-law:
------------------------------------------------------------
Parameters  : value       lower 90%   higher 90%
Photon index: 0.211503     ( -0.121577   0.1189 )
Epeak [keV] : 27.9138      ( -0.572126 0.543106 )
Norm@50keV  : 10.1630    ( -1.61044   1.96864 )
------------------------------------------------------------
# Chi-Squared =          69.23 using 59 PHA bins.
# Reduced chi-squared =          1.236 for     56 degrees of freedom
# Null hypothesis probability =   1.102000e-01

Photon flux (15-150 keV)    in 1 sec: 69.0034 ( -0.7996  0.7994 ) ph/cm2/s
Energy fluence (15-150 keV)             : 3.24011e-06 ( 0  0 ) ergs/cm2
Band function

Time interval is from   -0.344 sec. to    0.656 sec.

Spectral model in the Band function:
------------------------------------------------------------
Parameters  : value       lower 90%   higher 90%
alpha       : -0.222500   ( -0.0968546   0.148639 )
beta        : -9.99847    ( 2068.76   2078.75 )
Epeak [keV] : 27.8365      ( -0.505711 0.618577 )
Norm@50keV   : 10.0286    ( -1.45903   2.13368 )
------------------------------------------------------------
# Chi-Squared =          69.29 using 59 PHA bins.
# Reduced chi-squared =          1.260 for     55 degrees of freedom
# Null hypothesis probability =   9.304182e-02

Photon flux (15-150 keV)    in 1 sec: 140.570 ( -3.939  3.675 ) ph/cm2/s
Energy fluence (15-150 keV)             : 6.67744e-06 ( 0  0 ) ergs/cm2
Single BB
Spectral model blackbody:
------------------------------------------------------------
Parameters  : value    Lower 90%  Upper 90%
kT [keV]    : 7.91150  (  )
R^2/D10^2   : 87.5266  (   )
(R is the radius in km and D10 is the distance to the source in units of 10 kpc)
------------------------------------------------------------
# Chi-Squared =         540.51 using 59 PHA bins.
# Reduced chi-squared =         9.4826 for     57 degrees of freedom
# Null hypothesis probability =   6.183162e-80

Energy  Fluence     90% Error
[keV]   [erg/cm2]   [erg/cm2]
15- 25  9.824e-07   1.500e-08
25- 50  1.686e-06   2.050e-08
50-150  4.268e-07   1.540e-08
15-150  3.096e-06   3.750e-08
Thermal bremsstrahlung (OTTB)

Spectral model: thermal bremsstrahlung
------------------------------------------------------------
Parameters  : value         Lower 90%    Upper 90%
kT [keV]    : 30.7123       (      )
Norm        : 560.993       (     )
------------------------------------------------------------
# Chi-Squared =         367.23 using 59 PHA bins.
# Reduced chi-squared =         6.4426 for     57 degrees of freedom
# Null hypothesis probability =   6.699578e-47

Energy  Fluence     90% Error
[keV]   [erg/cm2]   [erg/cm2]
15- 25  1.155e-06   1.650e-08
25- 50  1.337e-06   1.450e-08
50-150  7.550e-07   2.415e-08
15-150  3.248e-06   3.850e-08
Double BB
Spectral model: bbodyrad<1> + bbodyrad<2>
------------------------------------------------------------
Parameters  : value         Lower 90%    Upper 90%
kT1 [keV]   : 4.32488        (-0.328703      0.338122)
R1^2/D10^2  : 442.615        (-95.5109      140.153)
kT2 [keV]   : 9.79238        (-0.292122      0.337014)
R2^2/D10^2  : 26.6415    (-4.96279   5.22004)
------------------------------------------------------------
# Chi-Squared =          69.84 using 59 PHA bins.
# Reduced chi-squared =          1.270 for     55 degrees of freedom
# Null hypothesis probability =   8.578105e-02

Energy  Fluence     90% Error
[keV]   [erg/cm2]   [erg/cm2]
15- 25  1.097e-06   3.200e-08
25- 50  1.506e-06   2.900e-08
50-150  6.168e-07   2.480e-08
15-150  3.220e-06   5.800e-08
Pre-slew spectrum (Pre-slew PHA with pre-slew DRM)
Power-law model

Spectral model in power-law:
------------------------------------------------------------
Parameters  : value       lower 90%   higher 90%
Photon index: 3.15763     (     )
Norm@50keV  : 0.591287    (     )
------------------------------------------------------------
# Chi-Squared =         681.18 using 59 PHA bins.
# Reduced chi-squared =         11.950 for     57 degrees of freedom
# Null hypothesis probability =  9.967750e-108

Photon flux (15-150 keV)    in 0.476 sec: 182.765 (    ) ph/cm2/s
Energy fluence (15-150 keV)             : 3.65108e-06 ( 0  0 ) ergs/cm2
Cutoff power-law model

Spectral model in the cutoff power-law:
------------------------------------------------------------
Parameters  : value       lower 90%   higher 90%
Photon index: 8.43294E-02     ( -0.275501   0.263092 )
Epeak [keV] : 28.5912      ( -1.64791 1.46185 )
Norm@50keV  : 24.7250    ( -6.71626   9.79173 )
------------------------------------------------------------
# Chi-Squared =          33.27 using 59 PHA bins.
# Reduced chi-squared =         0.5942 for     56 degrees of freedom
# Null hypothesis probability =   9.932381e-01

Photon flux (15-150 keV)    in 0.476 sec: 142.233 ( -5.148  5.227 ) ph/cm2/s
Energy fluence (15-150 keV)             : 3.19179e-06 ( 0  0 ) ergs/cm2
Band function
Spectral model in the Band function:
------------------------------------------------------------
Parameters  : value       lower 90%   higher 90%
alpha       : -1.81893   (     )
beta        : -9.37167    (     )
Epeak [keV] : 6.06851      (   )
Norm@50keV   : 3.24510    (     )
------------------------------------------------------------
# Chi-Squared =         187.32 using 59 PHA bins.
# Reduced chi-squared =         3.4059 for     55 degrees of freedom
# Null hypothesis probability =   2.468719e-16

Photon flux (15-150 keV)    in 0.476 sec: 141.667 ( -3.98  3.657 ) ph/cm2/s
Energy fluence (15-150 keV)             : 3.18854e-06 ( -7.18298e-08  7.1877e-08 ) ergs/cm2
S(25-50 keV) vs. S(50-100 keV) plot

S(25-50 keV)  = 1.19856e-06
S(50-100 keV) = 5.3727e-07
T90 vs. Hardness ratio plot

T90                                   = 0.183999985456467 sec.
Hardness ratio (energy fluence ratio) = 0.448263
Color vs. Color plot

Count Ratio  (25-50 keV) / (15-25 keV) = 0.993887
Count Ratio (50-100 keV) / (15-25 keV) = 0.228888
Mask shadow pattern

IMX = 0, IMY = 0
TIME vs. PHA plot around the trigger time

Blue+Cyan dotted lines: Time interval of the scaled map
From 0.000000 to 0.032000
TIME vs. DetID plot around the trigger time

Blue+Cyan dotted lines: Time interval of the scaled map
From 0.000000 to 0.032000
100 us light curve (15-350 keV)

Blue+Cyan dotted lines: Time interval of the scaled map
From 0.000000 to 0.032000
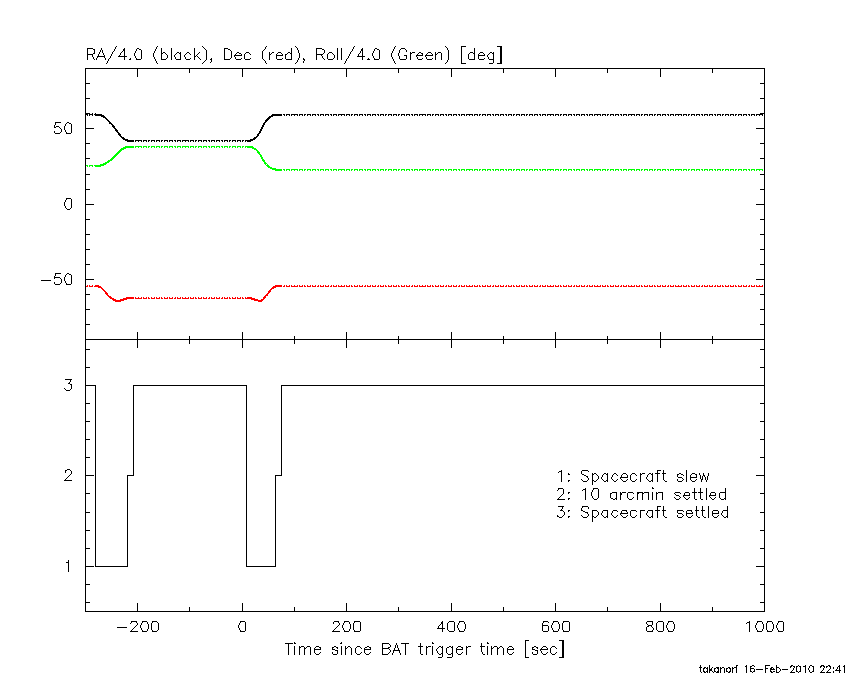
Spacecraft aspect plot
Bright source in the pre-burst/pre-slew/post-slew images
Pre-burst image of 15-350 keV band
Time interval of the image:
-219.495400 -0.084000

# RAcent  DECcent POSerr Theta    Phi  PeakCts   SNR AngSep     Name
#  [deg]    [deg]    ['] [deg]  [deg]                   [']
135.3774 -40.4237   50.8  29.4   60.4   0.0609   0.2   10.5	Vela X-1
170.2675 -60.7309    4.7   1.8  150.2   0.4164   2.4    6.6	Cen X-3
186.6158 -62.7634    0.8   8.4 -140.9   2.2211  13.7    1.2	GX 301-2
 85.0017 -65.3040    2.2  34.2  -14.6   1.0215   5.2 ------	UNKNOWN
 36.0715 -57.8907    2.4  54.3  -33.2   4.1540   4.8 ------	UNKNOWN
  7.4310 -69.9082    2.4  47.1  -53.4   3.7630   4.8 ------	UNKNOWN
305.6043 -73.4771    2.5  41.3  -79.2   3.2261   4.6 ------	UNKNOWN
  1.3516 -71.3415    3.3  46.1  -56.4   2.7745   3.5 ------	UNKNOWN
Pre-slew background subtracted image of 15-350 keV band
Time interval of the image:
-0.084000 0.392000

# RAcent  DECcent POSerr Theta    Phi  PeakCts   SNR AngSep     Name
#  [deg]    [deg]    ['] [deg]  [deg]                   [']
135.6966 -40.4481   13.0  29.2   60.8  -0.0701  -0.9   10.0	Vela X-1
170.2000 -60.8273    0.0   1.7  150.9  -0.1095  -2.0   12.7	Cen X-3
186.8823 -62.8779    7.8   8.6 -140.0   0.0877   1.5    8.9	GX 301-2
175.0384 -45.0868    3.3  17.6  133.7   0.1951   3.5 ------	UNKNOWN
 87.9705 -50.9018    2.2  42.6    4.5   0.4873   5.1 ------	UNKNOWN
 82.8489 -53.2801    2.8  43.0   -1.2   0.3629   4.2 ------	UNKNOWN
177.7287 -61.0525    2.7   4.7 -163.4   0.2456   4.2 ------	UNKNOWN
 67.2834 -46.1144    2.9  54.8   -5.8   0.7632   4.0 ------	UNKNOWN
202.4288 -57.4889    3.5  17.6 -152.5   0.1813   3.2 ------	UNKNOWN
 64.3102 -47.3435    3.1  54.9   -8.7   0.7072   3.7 ------	UNKNOWN
237.7187 -54.3097    0.1  35.5 -132.4   7.4147  78.6 ------	UNKNOWN
Post-slew image of 15-350 keV band
Time interval of the image:
64.104590 102.144000
103.004000 188.884000
190.004000 962.073500

# RAcent  DECcent POSerr Theta    Phi  PeakCts   SNR AngSep     Name
#  [deg]    [deg]    ['] [deg]  [deg]                   [']
170.3121 -60.6279 2700.0  35.1   50.4  -0.0020  -0.0    0.3	Cen X-3
186.7481 -62.7888    1.5  27.1   49.8   5.4369   7.6    2.7	GX 301-2
244.9889 -15.6516    0.4  39.1 -170.2  22.8000  30.6    0.9	Sco X-1
255.9636 -37.8257    1.2  20.7 -136.9   5.1846   9.6    1.5	4U 1700-377
256.4817 -36.4573    2.2  22.1 -137.8   2.7743   5.3    3.0	GX 349+2
263.0186 -24.7409    7.0  35.0 -138.8   1.2255   1.7    0.6	GX 1+4
264.6794 -44.6144    5.7  19.9 -109.5   1.0896   2.0   10.2	4U 1735-44
270.2920 -25.1866    4.0  37.8 -128.7   2.6481   2.8    6.5	GX 5-1
270.1434 -25.7676    6.3  37.2 -128.4   1.6108   1.8    8.7	GRS 1758-258
273.8809 -14.0009    4.5  49.2 -132.3   7.6512   2.6    7.6	GX 17+2
276.0378 -30.4671    6.8  36.3 -116.8   1.6875   1.7    8.4	H1820-303
211.6381 -78.9682    3.1  26.2    9.5   2.0150   3.7 ------	UNKNOWN
 66.2068 -68.6157    2.4  56.9    2.2  13.8575   4.7 ------	UNKNOWN
268.2339 -34.9392    3.9  28.7 -121.3   1.7348   3.0 ------	UNKNOWN
 15.1698 -62.3797    4.4  58.6  -23.0  10.8309   2.6 ------	UNKNOWN
324.6025 -54.6993    6.1  47.1  -53.4   5.2193   1.9 ------	UNKNOWN
Plot creation:
Tue Feb 16 22:50:59 EST 2010