Special notes of this burst
Image
Pre-slew 15.0-350.0 keV image (Event data)

#   RAcent    DECcent   POSerr    Theta     Phi              Peak Cts       SNR   Name
  220.9165   -27.8492   0.0170    10.6095   -28.1507         0.3474018     11.332 TRIG_00342121

Foreground time interval of the image:
 -2.920   6.624 (delta_t =   9.544 [sec])
Background time interval of the image:
-239.296  -2.920 (delta_t = 236.376 [sec])
Lightcurves
Notes:
- 1) The mask-weighted light curves are using the flight position.
- 2) Multiple plots of different time binning/intervals are shown to cover all scenarios of short/long GRBs, rate/image triggers, and real/false positives.
- 3) For all the mask-weighted lightcurves, the y-axis units are counts/sec/det where a det is 0.4 x 0.4 = 0.16 sq cm.
- 4) The verticle lines correspond to following: green dotted lines are T50 interval, black dotted lines are T90 interval, blue solid line(s) is a spacecraft slew start time, and orange solid line(s) is a spacecraft slew end time.
- 5) Time of each bin is in the middle of the bin.
1 s binning
From T0-310 s to T0+310 s
From T100_start - 20 s to T100_end + 30 s

Full time interval
64 ms binning
Full time interval

From T100_start to T100_end
From T0-5 sec to T0+5 sec

16 ms binning
From T100_start-5 s to T100_start+5 s

Blue+Cyan dotted lines: Time interval of the scaled map
From 0.000000 to 4.096000
8 ms binning
From T100_start-3 s to T100_start+3 s
Blue+Cyan dotted lines: Time interval of the scaled map
From 0.000000 to 4.096000
2 ms binning
From T100_start-1 s to T100_start+1 s

Blue+Cyan dotted lines: Time interval of the scaled map
From 0.000000 to 4.096000
SN=5 or 10 sec. binning (whichever binning is satisfied first)

SN=5 or 10 sec. binning (T < 200 sec)

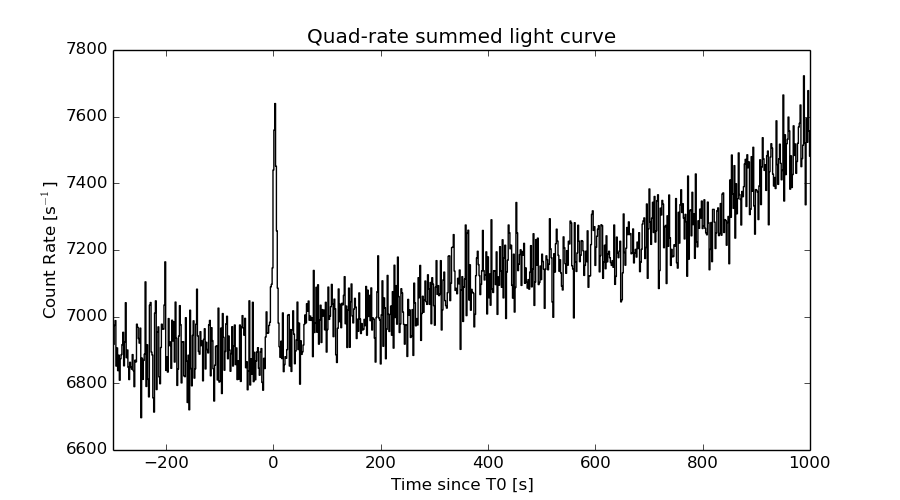
Quad-rate summed light curves (from T0-300s to T0+1000s)
Spectral Evolution

Spectra
Notes:
- 1) The fitting includes the systematic errors.
- 2) When the burst includes telescope slew time periods, the fitting uses an average response file made from multiple 5-s response files through out the slew time plus single time preiod for the non-slew times, and weighted by the total counts in the corresponding time period using addrmf. An average response file is needed becuase a spectral fit using the pre-slew DRM will introduce some errors in both a spectral shape and a normalization if the PHA file contains a lot of the slew/post-slew time interval.
- 3) For fits to more complicated models (e.g. a power-law over a cutoff power-law), the BAT team has decided to require a chi-square improvement of more than 6 for each extra dof.
Time averaged spectrum fit using the average DRM
Power-law model
Time interval is from   -2.920 sec. to    6.624 sec.

Spectral model in power-law:
------------------------------------------------------------
Parameters  : value       lower 90%   higher 90%
Photon index: 2.00539     ( -0.206298   0.218288 )
Norm@50keV  : 2.30738E-03    ( -0.000347606   0.000341427 )
------------------------------------------------------------
#Fit statistic : Chi-Squared =          68.41 using 59 PHA bins.
# Reduced chi-squared =          1.200 for     57 degrees of freedom
# Null hypothesis probability =   1.432287e-01

Photon flux (15-150 keV)    in 9.544 sec: 0.346968 ( -0.0401275  0.0401291 ) ph/cm2/s
Energy fluence (15-150 keV)             : 2.03136e-07 ( -2.84415e-08  2.92824e-08 ) ergs/cm2
Cutoff power-law model

Time interval is from   -2.920 sec. to    6.624 sec.
Spectral model in the cutoff power-law:
------------------------------------------------------------
Parameters  : value       lower 90%   higher 90%
Photon index: 0.392538     ( -1.48315   1.11738 )
Epeak [keV] : 38.4188      ( -7.62232 9.93531 )
Norm@50keV  : 2.16896E-02    ( -0.0216898   0.154543 )
------------------------------------------------------------
#Fit statistic : Chi-Squared =          61.59 using 59 PHA bins.
# Reduced chi-squared =          1.100 for     56 degrees of freedom
# Null hypothesis probability =   2.830215e-01

Photon flux (15-150 keV)    in 9.544 sec: 0.329564 ( -0.040995  0.041283 ) ph/cm2/s
Energy fluence (15-150 keV)             : 1.73588e-07 ( -2.75707e-08  3.24162e-08 ) ergs/cm2
Band function
Time interval is from   -2.920 sec. to    6.624 sec.

Spectral model in the Band function:
------------------------------------------------------------
Parameters  : value       lower 90%   higher 90%
alpha       : -0.397089   ( -0.998138   1.82468 )
beta        : -9.99999    ( 9.99999   20 )
Epeak [keV] : 38.4233      ( -6.58103 10.2549 )
Norm@50keV   : 2.15477E-02    ( -0.0215477   0.154947 )
------------------------------------------------------------
#Fit statistic : Chi-Squared =          61.59 using 59 PHA bins.
# Reduced chi-squared =          1.120 for     55 degrees of freedom
# Null hypothesis probability =   2.521842e-01

Photon flux (15-150 keV)    in 9.544 sec:  (    ) ph/cm2/s
Energy fluence (15-150 keV)             : 1.77486e-07 ( 0  0 ) ergs/cm2
Single BB

Spectral model blackbody:
------------------------------------------------------------
Parameters  : value    Lower 90%  Upper 90%
kT [keV]    : 9.57664  (-1.09526  1.24632)
R^2/D10^2   : 0.196841  (-0.0745255   0.118382)
(R is the radius in km and D10 is the distance to the source in units of 10 kpc)
------------------------------------------------------------
#Fit statistic : Chi-Squared =          66.03 using 59 PHA bins.
# Reduced chi-squared =          1.158 for     57 degrees of freedom
# Null hypothesis probability =   1.930577e-01

Energy  Fluence     90% Error
[keV]   [erg/cm2]   [erg/cm2]
15- 25  3.452e-08   7.144e-09
25- 50  8.064e-08   1.378e-08
50-150  3.708e-08   1.233e-08
15-150  1.522e-07   2.305e-08
Thermal bremsstrahlung (OTTB)

Spectral model: thermal bremsstrahlung
------------------------------------------------------------
Parameters  : value         Lower 90%    Upper 90%
kT [keV]    : 59.4585       (-16.763      27.8495)
Norm        : 1.84477       (-0.32582     0.390133)
------------------------------------------------------------
#Fit statistic : Chi-Squared =          63.33 using 59 PHA bins.
# Reduced chi-squared =          1.111 for     57 degrees of freedom
# Null hypothesis probability =   2.631161e-01

Energy  Fluence     90% Error
[keV]   [erg/cm2]   [erg/cm2]
15- 25  4.418e-08   6.996e-09
25- 50  6.706e-08   8.876e-09
50-150  7.573e-08   2.758e-08
15-150  1.870e-07   3.584e-08
Double BB

Spectral model: bbodyrad<1> + bbodyrad<2>
------------------------------------------------------------
Parameters  : value         Lower 90%    Upper 90%
kT1 [keV]   : 4.64554        (-2.64554      -4.64895)
R1^2/D10^2  : 1.30010        (-1.10705      69.2036)
kT2 [keV]   : 12.0874        (-2.61875      -12.0933)
R2^2/D10^2  : 6.45993E-02    (-0.0643658   0.131253)
------------------------------------------------------------
#Fit statistic : Chi-Squared =          61.65 using 59 PHA bins.
# Reduced chi-squared =          1.121 for     55 degrees of freedom
# Null hypothesis probability =   2.503952e-01

Energy  Fluence     90% Error
[keV]   [erg/cm2]   [erg/cm2]
15- 25  4.134e-08   2.190e-08
25- 50  7.259e-08   3.794e-08
50-150  5.375e-08   3.226e-08
15-150  1.677e-07   8.580e-08
Peak spectrum fit
Power-law model

Time interval is from    4.080 sec. to    5.080 sec.

Spectral model in power-law:
------------------------------------------------------------
Parameters  : value       lower 90%   higher 90%
Photon index: 1.97980     ( -0.436086   0.478599 )
Norm@50keV  : 3.22511E-03    ( -0.00105012   0.00102182 )
------------------------------------------------------------
#Fit statistic : Chi-Squared =          52.55 using 59 PHA bins.
# Reduced chi-squared =         0.9219 for     57 degrees of freedom
# Null hypothesis probability =   6.426421e-01

Photon flux (15-150 keV)    in 1 sec: 0.479327 ( -0.121119  0.12112 ) ph/cm2/s
Energy fluence (15-150 keV)             : 2.97148e-08 ( -8.89447e-09  9.46552e-09 ) ergs/cm2
Cutoff power-law model
Time interval is from    4.080 sec. to    5.080 sec.
Spectral model in the cutoff power-law:
------------------------------------------------------------
Parameters  : value       lower 90%   higher 90%
Photon index: -1.00527     ( -5.66656   3.14782 )
Epeak [keV] : 32.3553      (   )
Norm@50keV  : 0.325059    (     )
------------------------------------------------------------
#Fit statistic : Chi-Squared =          50.33 using 59 PHA bins.
# Reduced chi-squared =         0.8988 for     56 degrees of freedom
# Null hypothesis probability =   6.882595e-01

Photon flux (15-150 keV)    in 1 sec: 0.442273 ( -0.114448  0.1184 ) ph/cm2/s
Energy fluence (15-150 keV)             : 2.10853e-08 ( -6.0779e-09  1.25492e-08 ) ergs/cm2
Band function
Time interval is from    4.080 sec. to    5.080 sec.

Spectral model in the Band function:
------------------------------------------------------------
Parameters  : value       lower 90%   higher 90%
alpha       : 5.00000   ( -5.95219   -5 )
beta        : -2.52114    ( -2.02031   0.665093 )
Epeak [keV] : 24.7411      ( -5.90291 6.52825 )
Norm@50keV   : 651.642    ( -156.478   3141.14 )
------------------------------------------------------------
#Fit statistic : Chi-Squared =          48.03 using 59 PHA bins.
# Reduced chi-squared =         0.8733 for     55 degrees of freedom
# Null hypothesis probability =   7.357903e-01

Photon flux (15-150 keV)    in 1 sec:  (    ) ph/cm2/s
Energy fluence (15-150 keV)             : 0 ( 0  0 ) ergs/cm2
Single BB

Spectral model blackbody:
------------------------------------------------------------
Parameters  : value    Lower 90%  Upper 90%
kT [keV]    : 8.20700  (-1.74294  2.31286)
R^2/D10^2   : 0.505706  (-0.319724   0.801003)
(R is the radius in km and D10 is the distance to the source in units of 10 kpc)
------------------------------------------------------------
#Fit statistic : Chi-Squared =          50.36 using 59 PHA bins.
# Reduced chi-squared =         0.8836 for     57 degrees of freedom
# Null hypothesis probability =   7.205042e-01

Energy  Fluence     90% Error
[keV]   [erg/cm2]   [erg/cm2]
15- 25  6.273e-09   3.281e-09
25- 50  1.147e-08   6.495e-09
50-150  3.274e-09   2.365e-09
15-150  2.102e-08   1.062e-08
Thermal bremsstrahlung (OTTB)

Spectral model: thermal bremsstrahlung
------------------------------------------------------------
Parameters  : value         Lower 90%    Upper 90%
kT [keV]    : 55.4047       (-27.5519      102.059)
Norm        : 2.64205       (-0.942694     1.55597)
------------------------------------------------------------
#Fit statistic : Chi-Squared =          51.54 using 59 PHA bins.
# Reduced chi-squared =         0.9042 for     57 degrees of freedom
# Null hypothesis probability =   6.793783e-01

Energy  Fluence     90% Error
[keV]   [erg/cm2]   [erg/cm2]
15- 25  6.547e-09   2.614e-09
25- 50  9.715e-09   4.916e-09
50-150  1.033e-08   7.465e-09
15-150  2.659e-08   1.515e-08
Double BB

Spectral model: bbodyrad<1> + bbodyrad<2>
------------------------------------------------------------
Parameters  : value         Lower 90%    Upper 90%
kT1 [keV]   : 7.43773        (-7.43682      2.29753)
R1^2/D10^2  : 0.688953        (-0.689224      1.5144)
kT2 [keV]   : 55.4873        (-55.3737      -55.3737)
R2^2/D10^2  : 3.40793E-04    (-0.000342441   0.00783196)
------------------------------------------------------------
#Fit statistic : Chi-Squared =          48.15 using 59 PHA bins.
# Reduced chi-squared =         0.8755 for     55 degrees of freedom
# Null hypothesis probability =   7.316460e-01

Energy  Fluence     90% Error
[keV]   [erg/cm2]   [erg/cm2]
15- 25  6.598e-09   3.858e-09
25- 50  1.075e-08   6.490e-09
50-150  1.254e-08   6.165e-09
15-150  2.989e-08   1.422e-08
Pre-slew spectrum (Pre-slew PHA with pre-slew DRM)
Power-law model

Spectral model in power-law:
------------------------------------------------------------
Parameters  : value       lower 90%   higher 90%
Photon index: 2.00539     ( -0.206298   0.218288 )
Norm@50keV  : 2.30738E-03    ( -0.000347606   0.000341427 )
------------------------------------------------------------
#Fit statistic : Chi-Squared =          68.41 using 59 PHA bins.
# Reduced chi-squared =          1.200 for     57 degrees of freedom
# Null hypothesis probability =   1.432287e-01

Photon flux (15-150 keV)    in 9.544 sec: 0.346968 ( -0.0401275  0.0401291 ) ph/cm2/s
Energy fluence (15-150 keV)             : 2.03136e-07 ( -2.84415e-08  2.92824e-08 ) ergs/cm2
Cutoff power-law model

Spectral model in the cutoff power-law:
------------------------------------------------------------
Parameters  : value       lower 90%   higher 90%
Photon index: 0.392538     ( -1.48315   1.11738 )
Epeak [keV] : 38.4188      ( -7.62232 9.93525 )
Norm@50keV  : 2.16896E-02    ( -0.0216898   0.154543 )
------------------------------------------------------------
#Fit statistic : Chi-Squared =          61.59 using 59 PHA bins.
# Reduced chi-squared =          1.100 for     56 degrees of freedom
# Null hypothesis probability =   2.830215e-01

Photon flux (15-150 keV)    in 9.544 sec: 0.329564 ( -0.040995  0.041283 ) ph/cm2/s
Energy fluence (15-150 keV)             : 1.73588e-07 ( -2.75707e-08  3.24162e-08 ) ergs/cm2
Band function

Spectral model in the Band function:
------------------------------------------------------------
Parameters  : value       lower 90%   higher 90%
alpha       : -0.397089   ( -0.998138   1.82468 )
beta        : -9.99999    ( 9.99999   20 )
Epeak [keV] : 38.4233      ( -6.58103 10.2549 )
Norm@50keV   : 2.15477E-02    ( -0.0215477   0.154947 )
------------------------------------------------------------
#Fit statistic : Chi-Squared =          61.59 using 59 PHA bins.
# Reduced chi-squared =          1.120 for     55 degrees of freedom
# Null hypothesis probability =   2.521842e-01

Photon flux (15-150 keV)    in 9.544 sec:  (    ) ph/cm2/s
Energy fluence (15-150 keV)             : 1.77486e-07 ( 0  0 ) ergs/cm2
S(25-50 keV) vs. S(50-100 keV) plot

S(25-50 keV)  = 6.12e-08
S(50-100 keV) = 6.10e-08
T90 vs. Hardness ratio plot

T90                                   = 8.8120000064373 sec.
Hardness ratio (energy fluence ratio) = 0.996732
Color vs. Color plot

Count Ratio  (25-50 keV) / (15-25 keV) = 1.03926
Count Ratio (50-100 keV) / (15-25 keV) = 0.378532
Mask shadow pattern

IMX = 1.651591959193517E-01, IMY = 8.837470254186201E-02
TIME vs. PHA plot around the trigger time

Blue+Cyan dotted lines: Time interval of the scaled map
From 0.000000 to 4.096000
TIME vs. DetID plot around the trigger time

Blue+Cyan dotted lines: Time interval of the scaled map
From 0.000000 to 4.096000
100 us light curve (15-350 keV)

Blue+Cyan dotted lines: Time interval of the scaled map
From 0.000000 to 4.096000
Spacecraft aspect plot
Bright source in the pre-burst/pre-slew/post-slew images
Pre-burst image of 15-350 keV band
Time interval of the image:
-239.296000 -2.920000

# RAcent  DECcent POSerr Theta    Phi  PeakCts   SNR AngSep     Name
#  [deg]    [deg]    ['] [deg]  [deg]                   [']
170.2797 -60.5372    6.6  56.1    0.6   1.7050   1.7    5.3	Cen X-3
186.8535 -62.8233    5.2  51.2   -7.5   1.0728   2.2    6.3	GX 301-2
244.9670 -15.6373    0.3  23.4 -116.9   9.1958  41.4    0.7	Sco X-1
255.9805 -37.7941    1.8  37.2  -75.8   3.0398   6.4    3.0	4U 1700-377
256.4624 -36.3036   14.1  37.0  -78.3   0.3825   0.8    7.3	GX 349+2
263.1632 -24.8185   36.9  40.3  -98.2   0.2970   0.3    9.5	GX 1+4
196.4051 -26.3488    3.0  24.2   37.2   0.7688   3.8 ------	UNKNOWN
167.5647 -59.6132    3.0  56.9    2.3   3.8744   3.8 ------	UNKNOWN
221.7988 -22.4933    2.1   5.4  -38.7   0.9725   5.6 ------	UNKNOWN
250.4023  10.6094    3.0  40.6 -157.8   1.0367   3.9 ------	UNKNOWN
254.7683 -29.6631    2.5  33.6  -88.5   1.6575   4.6 ------	UNKNOWN
Pre-slew background subtracted image of 15-350 keV band
Time interval of the image:
-2.920000 6.624000

# RAcent  DECcent POSerr Theta    Phi  PeakCts   SNR AngSep     Name
#  [deg]    [deg]    ['] [deg]  [deg]                   [']
170.3808 -60.6216    4.1  56.1    0.5  -0.4436  -2.8    1.9	Cen X-3
186.7226 -62.6324   26.4  51.1   -7.3  -0.0343  -0.4    8.5	GX 301-2
244.9716 -15.4864    7.0  23.5 -117.3  -0.0629  -1.6    9.2	Sco X-1
256.0712 -37.8905    3.6  37.3  -75.7  -0.2475  -3.2    4.9	4U 1700-377
256.6043 -36.4096    2.9  37.1  -78.2  -0.2995  -3.9    8.2	GX 349+2
262.8754 -24.8359    4.9  40.0  -98.2   0.2826   2.3    9.1	GX 1+4
199.2786   4.0488    2.2  29.9  106.9   0.2609   5.2 ------	UNKNOWN
220.9165 -27.8492    1.0  10.6  -28.2   0.3475  11.3 ------	UNKNOWN
254.3822   5.9580    2.5  40.7 -148.4   0.2306   4.7 ------	UNKNOWN
227.8518 -65.6710    2.8  48.7  -30.5   0.3070   4.2 ------	UNKNOWN
Post-slew image of 15-350 keV band
Time interval of the image:
71.404590 962.775200

# RAcent  DECcent POSerr Theta    Phi  PeakCts   SNR AngSep     Name
#  [deg]    [deg]    ['] [deg]  [deg]                   [']
170.1857 -60.8082    5.6  47.1   13.3  -2.9303  -2.1   11.8	Cen X-3
186.7585 -62.7192    7.6  41.3    5.2   1.5554   1.5    4.2	GX 301-2
244.9709 -15.6459    0.2  25.4 -131.5  40.3182  62.5    0.6	Sco X-1
255.9982 -37.8216    0.8  30.9  -79.9  12.8250  14.2    1.5	4U 1700-377
256.3423 -36.4486    2.7  31.0  -82.6   4.0202   4.3    4.7	GX 349+2
263.1342 -24.6335   51.6  37.8 -102.7   0.3767   0.2    9.6	GX 1+4
264.6194 -44.4804    6.3  38.4  -70.2   2.6731   1.9    5.6	4U 1735-44
262.9114 -33.9073    5.3  36.3  -87.5   3.5469   2.2    5.8	GX 354-0
194.9534 -33.8193    3.4  23.0   50.8   2.3720   3.4 ------	UNKNOWN
225.7527  26.7976    3.9  54.9  167.6  12.0272   3.0 ------	UNKNOWN
Plot creation:
Sun May 31 04:52:17 EDT 2015