Special notes of this burst
Image
Pre-slew 15.0-350.0 keV image (Event data)
#   RAcent    DECcent   POSerr    Theta     Phi              Peak Cts       SNR   Name
  338.1424    26.6388   0.0030    35.3095   -61.9225        33.7913383     64.991 TRIG_00344582

Foreground time interval of the image:
-17.912  62.021 (delta_t =  79.933 [sec])
Background time interval of the image:
-852.379 -751.626 (delta_t = 100.753 [sec])
-239.680 -32.240 (delta_t = 207.440 [sec])
-30.680 -17.912 (delta_t =  12.768 [sec])
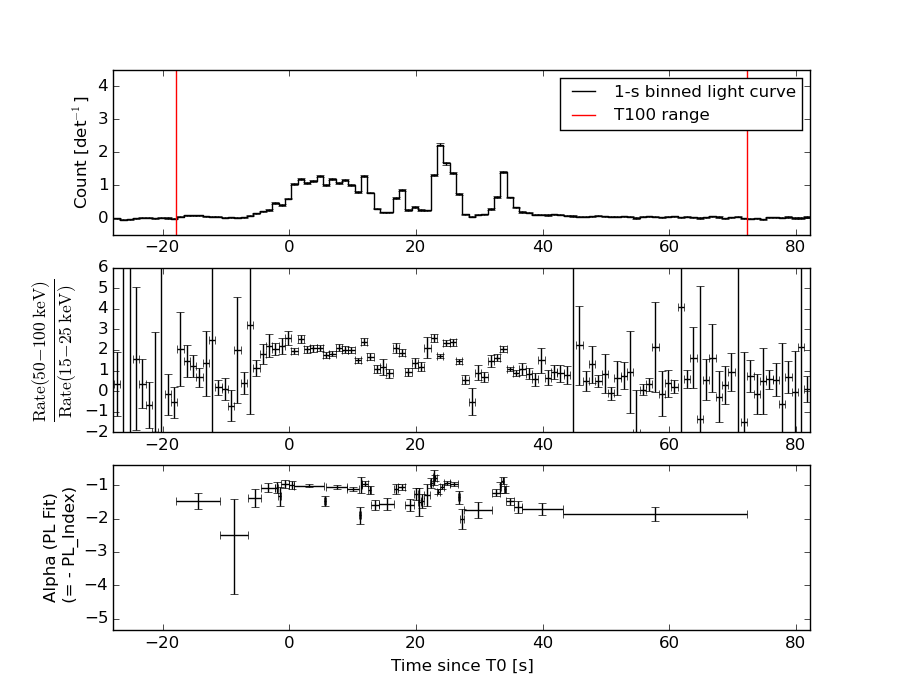
Lightcurves
Notes:
- 1) The mask-weighted light curves are using the flight position.
- 2) Multiple plots of different time binning/intervals are shown to cover all scenarios of short/long GRBs, rate/image triggers, and real/false positives.
- 3) For all the mask-weighted lightcurves, the y-axis units are counts/sec/det where a det is 0.4 x 0.4 = 0.16 sq cm.
- 4) The verticle lines correspond to following: green dotted lines are T50 interval, black dotted lines are T90 interval, blue solid line(s) is a spacecraft slew start time, and orange solid line(s) is a spacecraft slew end time.
- 5) Time of each bin is in the middle of the bin.
1 s binning
From T0-310 s to T0+310 s
From T100_start - 20 s to T100_end + 30 s
Full time interval
64 ms binning
Full time interval
From T100_start to T100_end
From T0-5 sec to T0+5 sec
16 ms binning
From T100_start-5 s to T100_start+5 s
Blue+Cyan dotted lines: Time interval of the scaled map
From 0.000000 to 1.024000
8 ms binning
From T100_start-3 s to T100_start+3 s
Blue+Cyan dotted lines: Time interval of the scaled map
From 0.000000 to 1.024000
2 ms binning
From T100_start-1 s to T100_start+1 s
Blue+Cyan dotted lines: Time interval of the scaled map
From 0.000000 to 1.024000
SN=5 or 10 sec. binning (whichever binning is satisfied first)
SN=5 or 10 sec. binning (T < 200 sec)
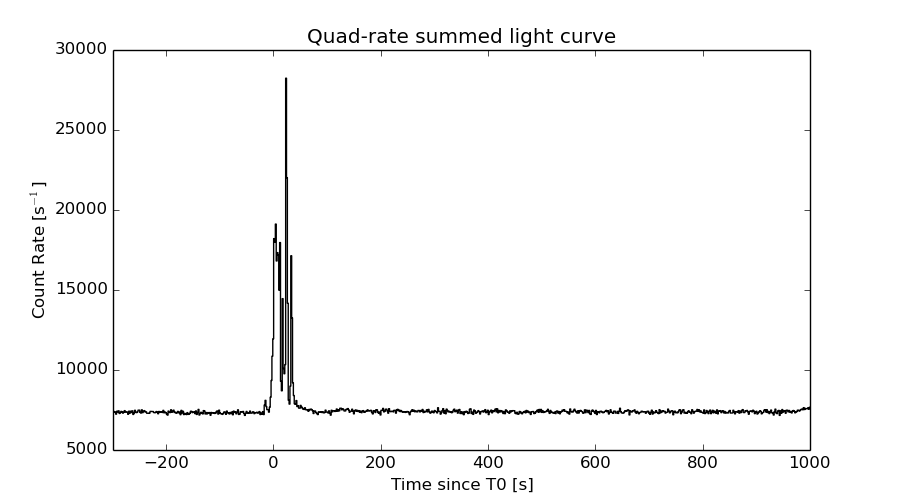
Quad-rate summed light curves (from T0-300s to T0+1000s)
Spectral Evolution
Spectra
Notes:
- 1) The fitting includes the systematic errors.
- 2) When the burst includes telescope slew time periods, the fitting uses an average response file made from multiple 5-s response files through out the slew time plus single time preiod for the non-slew times, and weighted by the total counts in the corresponding time period using addrmf. An average response file is needed becuase a spectral fit using the pre-slew DRM will introduce some errors in both a spectral shape and a normalization if the PHA file contains a lot of the slew/post-slew time interval.
- 3) For fits to more complicated models (e.g. a power-law over a cutoff power-law), the BAT team has decided to require a chi-square improvement of more than 6 for each extra dof.
Time averaged spectrum fit using the average DRM
Power-law model
Time interval is from  -17.912 sec. to   72.224 sec.

Spectral model in power-law:
------------------------------------------------------------
Parameters  : value       lower 90%   higher 90%
Photon index: 1.16042     ( -0.0282893   0.0281885 )
Norm@50keV  : 2.60302E-02    ( -0.000410704   0.000409392 )
------------------------------------------------------------
#Fit statistic : Chi-Squared =          28.94 using 59 PHA bins.
# Reduced chi-squared =         0.5077 for     57 degrees of freedom
# Null hypothesis probability =   9.992812e-01

Photon flux (15-150 keV)    in 90.14 sec: 3.03949 ( -0.0528047  0.0530267 ) ph/cm2/s
Energy fluence (15-150 keV)             : 2.40794e-05 ( -3.53387e-07  3.53446e-07 ) ergs/cm2
Cutoff power-law model
Time interval is from  -17.912 sec. to   72.224 sec.
Spectral model in the cutoff power-law:
------------------------------------------------------------
Parameters  : value       lower 90%   higher 90%
Photon index: 1.15556     ( -0.103337   0.0280231 )
Epeak [keV] : 9999.36      ( -9999.36 -9999.36 )
Norm@50keV  : 2.61609E-02    ( -0.000387787   0.00247116 )
------------------------------------------------------------
#Fit statistic : Chi-Squared =          28.96 using 59 PHA bins.
# Reduced chi-squared =         0.5171 for     56 degrees of freedom
# Null hypothesis probability =   9.989620e-01

Photon flux (15-150 keV)    in 90.14 sec: 3.03860 ( -0.05361  0.05208 ) ph/cm2/s
Energy fluence (15-150 keV)             : 2.40865e-05 ( -3.50374e-07  3.52898e-07 ) ergs/cm2
Band function
Time interval is from  -17.912 sec. to   72.224 sec.

Spectral model in the Band function:
------------------------------------------------------------
Parameters  : value       lower 90%   higher 90%
alpha       : -0.481819   ( 0.669924   5.63611 )
beta        : -1.17295    ( -0.038244   0.0340257 )
Epeak [keV] : 70.2002      ( -70.0986 175.876 )
Norm@50keV   : 7.12167E-02    ( -0.0446913   1.06514e+06 )
------------------------------------------------------------
#Fit statistic : Chi-Squared =          27.34 using 59 PHA bins.
# Reduced chi-squared =         0.4971 for     55 degrees of freedom
# Null hypothesis probability =   9.993516e-01

Photon flux (15-150 keV)    in 90.14 sec:  (    ) ph/cm2/s
Energy fluence (15-150 keV)             : 0 ( 0  0 ) ergs/cm2
Single BB
Spectral model blackbody:
------------------------------------------------------------
Parameters  : value    Lower 90%  Upper 90%
kT [keV]    : 23.4493  (  )
R^2/D10^2   : 8.25163E-02  (   )
(R is the radius in km and D10 is the distance to the source in units of 10 kpc)
------------------------------------------------------------
#Fit statistic : Chi-Squared =         885.33 using 59 PHA bins.
# Reduced chi-squared =         15.532 for     57 degrees of freedom
# Null hypothesis probability =  6.161753e-149

Energy  Fluence     90% Error
[keV]   [erg/cm2]   [erg/cm2]
15- 25  7.342e-07   2.416e-08
25- 50  4.026e-06   9.870e-08
50-150  1.652e-05   3.155e-07
15-150  2.128e-05   3.741e-07
Thermal bremsstrahlung (OTTB)
Spectral model: thermal bremsstrahlung
------------------------------------------------------------
Parameters  : value         Lower 90%    Upper 90%
kT [keV]    : 199.363       (      )
Norm        : 13.5600       (     )
------------------------------------------------------------
#Fit statistic : Chi-Squared =         739.57 using 59 PHA bins.
# Reduced chi-squared =         12.975 for     57 degrees of freedom
# Null hypothesis probability =  1.983183e-119

Energy  Fluence     90% Error
[keV]   [erg/cm2]   [erg/cm2]
15- 25  3.044e-06   5.363e-08
25- 50  5.855e-06   9.510e-08
50-150  1.284e-05   2.208e-07
15-150  2.174e-05   3.786e-07
Double BB
Spectral model: bbodyrad<1> + bbodyrad<2>
------------------------------------------------------------
Parameters  : value         Lower 90%    Upper 90%
kT1 [keV]   : 9.00143        (-0.55466      0.585533)
R1^2/D10^2  : 1.11209        (-0.203419      0.259861)
kT2 [keV]   : 38.2458        (-2.27292      2.74802)
R2^2/D10^2  : 1.48715E-02    (-0.00289773   0.0032222)
------------------------------------------------------------
#Fit statistic : Chi-Squared =          30.85 using 59 PHA bins.
# Reduced chi-squared =         0.5609 for     55 degrees of freedom
# Null hypothesis probability =   9.965299e-01

Energy  Fluence     90% Error
[keV]   [erg/cm2]   [erg/cm2]
15- 25  1.843e-06   1.086e-07
25- 50  5.120e-06   1.469e-07
50-150  1.716e-05   4.642e-07
15-150  2.413e-05   5.589e-07
Peak spectrum fit
Power-law model
Time interval is from   23.068 sec. to   24.068 sec.

Spectral model in power-law:
------------------------------------------------------------
Parameters  : value       lower 90%   higher 90%
Photon index: 1.08960     ( -0.0601893   0.0599131 )
Norm@50keV  : 0.160880    ( -0.00508904   0.00508092 )
------------------------------------------------------------
#Fit statistic : Chi-Squared =          53.15 using 59 PHA bins.
# Reduced chi-squared =         0.9325 for     57 degrees of freedom
# Null hypothesis probability =   6.200923e-01

Photon flux (15-150 keV)    in 1 sec: 18.6427 ( -0.611667  0.613098 ) ph/cm2/s
Energy fluence (15-150 keV)             : 1.68767e-06 ( -5.83509e-08  5.85659e-08 ) ergs/cm2
Cutoff power-law model

Time interval is from   23.068 sec. to   24.068 sec.
Spectral model in the cutoff power-law:
------------------------------------------------------------
Parameters  : value       lower 90%   higher 90%
Photon index: 1.08449     ( -0.0660865   0.0554358 )
Epeak [keV] : 1.00000E+04      (   )
Norm@50keV  : 0.161751    ( -0.0050674   0.00506023 )
------------------------------------------------------------
#Fit statistic : Chi-Squared =          53.38 using 59 PHA bins.
# Reduced chi-squared =         0.9533 for     56 degrees of freedom
# Null hypothesis probability =   5.745257e-01

Photon flux (15-150 keV)    in 1 sec: 18.6598 ( -0.6416  0.5927 ) ph/cm2/s
Energy fluence (15-150 keV)             : 1.68675e-06 ( 0  0 ) ergs/cm2
Band function

Time interval is from   23.068 sec. to   24.068 sec.

Spectral model in the Band function:
------------------------------------------------------------
Parameters  : value       lower 90%   higher 90%
alpha       : -0.860934   ( 0.860934   5.85905 )
beta        : -1.08961    ( -0.0641167   0.0601998 )
Epeak [keV] : 64.1665      ( -64.1665 -64.1665 )
Norm@50keV   : 0.275742    ( -0.0887626   0 )
------------------------------------------------------------
#Fit statistic : Chi-Squared =          53.15 using 59 PHA bins.
# Reduced chi-squared =         0.9665 for     55 degrees of freedom
# Null hypothesis probability =   5.454385e-01

Photon flux (15-150 keV)    in 1 sec:  (    ) ph/cm2/s
Energy fluence (15-150 keV)             : 0 ( 0  0 ) ergs/cm2
Single BB
Spectral model blackbody:
------------------------------------------------------------
Parameters  : value    Lower 90%  Upper 90%
kT [keV]    : 21.9367  (  )
R^2/D10^2   : 0.639419  (   )
(R is the radius in km and D10 is the distance to the source in units of 10 kpc)
------------------------------------------------------------
#Fit statistic : Chi-Squared =         325.91 using 59 PHA bins.
# Reduced chi-squared =         5.7178 for     57 degrees of freedom
# Null hypothesis probability =   2.407207e-39

Energy  Fluence     90% Error
[keV]   [erg/cm2]   [erg/cm2]
15- 25  5.702e-08   3.910e-09
25- 50  3.010e-07   1.525e-08
50-150  1.082e-06   5.600e-08
15-150  1.440e-06   5.700e-08
Thermal bremsstrahlung (OTTB)
Spectral model: thermal bremsstrahlung
------------------------------------------------------------
Parameters  : value         Lower 90%    Upper 90%
kT [keV]    : 199.363       (      )
Norm        : 77.4092       (     )
------------------------------------------------------------
#Fit statistic : Chi-Squared =         235.87 using 59 PHA bins.
# Reduced chi-squared =         4.1381 for     57 degrees of freedom
# Null hypothesis probability =   1.278901e-23

Energy  Fluence     90% Error
[keV]   [erg/cm2]   [erg/cm2]
15- 25  1.928e-07   6.600e-09
25- 50  3.708e-07   1.295e-08
50-150  8.132e-07   2.755e-08
15-150  1.377e-06   4.800e-08
Double BB
Spectral model: bbodyrad<1> + bbodyrad<2>
------------------------------------------------------------
Parameters  : value         Lower 90%    Upper 90%
kT1 [keV]   : 8.37273        (-0.871184      0.954584)
R1^2/D10^2  : 9.23078        (-2.6891      4.07672)
kT2 [keV]   : 44.1313        (-5.89157      8.84654)
R2^2/D10^2  : 6.79134E-02    (-0.0259816   0.0340524)
------------------------------------------------------------
#Fit statistic : Chi-Squared =          45.24 using 59 PHA bins.
# Reduced chi-squared =         0.8225 for     55 degrees of freedom
# Null hypothesis probability =   8.232505e-01

Energy  Fluence     90% Error
[keV]   [erg/cm2]   [erg/cm2]
15- 25  1.367e-07   1.420e-08
25- 50  3.398e-07   2.690e-08
50-150  1.264e-06   1.265e-07
15-150  1.740e-06   1.630e-07
Pre-slew spectrum (Pre-slew PHA with pre-slew DRM)
Power-law model
Spectral model in power-law:
------------------------------------------------------------
Parameters  : value       lower 90%   higher 90%
Photon index: 1.15688     ( -0.0279099   0.0277978 )
Norm@50keV  : 2.90703E-02    ( -0.00045406   0.000452542 )
------------------------------------------------------------
#Fit statistic : Chi-Squared =          26.16 using 59 PHA bins.
# Reduced chi-squared =         0.4590 for     57 degrees of freedom
# Null hypothesis probability =   9.998500e-01

Photon flux (15-150 keV)    in 79.93 sec: 3.39300 ( -0.0582802  0.0585286 ) ph/cm2/s
Energy fluence (15-150 keV)             : 2.38708e-05 ( -3.46055e-07  3.46117e-07 ) ergs/cm2
Cutoff power-law model
Spectral model in the cutoff power-law:
------------------------------------------------------------
Parameters  : value       lower 90%   higher 90%
Photon index: 1.15166     ( -0.028319   0.0278465 )
Epeak [keV] : 9999.36      ( -9999.36 -9999.36 )
Norm@50keV  : 2.92157E-02    ( -0.000429249   0.00290932 )
------------------------------------------------------------
#Fit statistic : Chi-Squared =          26.16 using 59 PHA bins.
# Reduced chi-squared =         0.4672 for     56 degrees of freedom
# Null hypothesis probability =   9.997748e-01

Photon flux (15-150 keV)    in 79.93 sec: 3.39160 ( -0.05853  0.05745 ) ph/cm2/s
Energy fluence (15-150 keV)             : 2.38788e-05 ( -3.44578e-07  3.44818e-07 ) ergs/cm2
Band function
Spectral model in the Band function:
------------------------------------------------------------
Parameters  : value       lower 90%   higher 90%
alpha       : -0.412580   ( 0.662283   5.63368 )
beta        : -1.16912    ( -0.0377286   0.0335804 )
Epeak [keV] : 65.7793      ( -65.7021 233.661 )
Norm@50keV   : 8.87027E-02    ( -0.0890474   1.42672e+06 )
------------------------------------------------------------
#Fit statistic : Chi-Squared =          24.46 using 59 PHA bins.
# Reduced chi-squared =         0.4448 for     55 degrees of freedom
# Null hypothesis probability =   9.998821e-01

Photon flux (15-150 keV)    in 79.93 sec:  (    ) ph/cm2/s
Energy fluence (15-150 keV)             : 0 ( 0  0 ) ergs/cm2
S(25-50 keV) vs. S(50-100 keV) plot
S(25-50 keV)  = 4.94e-06
S(50-100 keV) = 8.84e-06
T90 vs. Hardness ratio plot
T90                                   = 41.3720000088215 sec.
Hardness ratio (energy fluence ratio) = 1.78947
Color vs. Color plot
Count Ratio  (25-50 keV) / (15-25 keV) = 1.72628
Count Ratio (50-100 keV) / (15-25 keV) = 1.7319
Mask shadow pattern
IMX = 3.333670761331051E-01, IMY = 6.249313085092625E-01
TIME vs. PHA plot around the trigger time
Blue+Cyan dotted lines: Time interval of the scaled map
From 0.000000 to 1.024000
TIME vs. DetID plot around the trigger time
Blue+Cyan dotted lines: Time interval of the scaled map
From 0.000000 to 1.024000
100 us light curve (15-350 keV)
Blue+Cyan dotted lines: Time interval of the scaled map
From 0.000000 to 1.024000
Spacecraft aspect plot
Bright source in the pre-burst/pre-slew/post-slew images
Pre-burst image of 15-350 keV band
Time interval of the image:
-852.379410 -751.626300
-239.680000 -32.240000
-30.680000 -17.912000

# RAcent  DECcent POSerr Theta    Phi  PeakCts   SNR AngSep     Name
#  [deg]    [deg]    ['] [deg]  [deg]                   [']
308.0974  40.9564    2.6  52.0  -27.5   2.7134   4.5    0.6	Cyg X-3
326.1696  38.3304  147.3  39.8  -37.6  -0.0270  -0.1    0.5	Cyg X-2
284.2822  74.4954    2.6  53.5   17.2   5.1513   4.4 ------	UNKNOWN
 46.3315  -8.0134    3.0  54.0 -179.0   2.8132   3.9 ------	UNKNOWN
 47.7178 -10.7624    2.6  57.1 -179.0   5.7548   4.5 ------	UNKNOWN
 10.9445  -1.3094    2.5  40.9 -132.7   2.0616   4.7 ------	UNKNOWN
Pre-slew background subtracted image of 15-350 keV band
Time interval of the image:
-17.912000 62.020620

# RAcent  DECcent POSerr Theta    Phi  PeakCts   SNR AngSep     Name
#  [deg]    [deg]    ['] [deg]  [deg]                   [']
308.1104  40.9523   25.2  52.0  -27.5   0.4398   0.5    0.0	Cyg X-3
326.1752  38.3281    9.3  39.8  -37.6   0.5710   1.2    0.4	Cyg X-2
 55.7002  49.7321    3.3  28.6   92.4   0.9878   3.5 ------	UNKNOWN
 48.3945  -8.8128    4.2  55.7  179.2   2.9351   2.7 ------	UNKNOWN
 22.9349   8.8580    2.8  30.6 -153.2   1.1660   4.1 ------	UNKNOWN
 19.6921  -2.1126    3.1  41.3 -146.1   1.7476   3.7 ------	UNKNOWN
338.1424  26.6388    0.2  35.3  -61.9  33.7862  65.0 ------	UNKNOWN
Post-slew image of 15-350 keV band
Time interval of the image:
151.220600 961.920600

# RAcent  DECcent POSerr Theta    Phi  PeakCts   SNR AngSep     Name
#  [deg]    [deg]    ['] [deg]  [deg]                   [']
 83.6348  22.0106    0.2  40.9 -179.4  33.9935  47.2    0.2	Crab
126.5255  59.3439    2.5   9.6   46.3   2.1301   4.6 ------	UNKNOWN
 80.7427  16.2908    2.4  47.2 -178.3   4.3366   4.8 ------	UNKNOWN
301.8168  78.5655    3.2  42.0  -38.7   3.0955   3.6 ------	UNKNOWN
 52.6174  19.7904    5.2  55.4 -145.2   5.9193   2.3 ------	UNKNOWN
Plot creation:
Sun May 31 04:50:28 EDT 2015