Special notes of this burst
Image
Pre-slew 15.0-350.0 keV image (Event data)
#   RAcent    DECcent   POSerr    Theta     Phi              Peak Cts       SNR   Name
  284.9826   -25.2778   0.0205    24.6667   -92.9612         0.2295110      9.369 TRIG_00345945

Foreground time interval of the image:
 -0.824   2.176 (delta_t =   3.000 [sec])
Background time interval of the image:
-530.623 -493.713 (delta_t =  36.910 [sec])
-239.824  -0.824 (delta_t = 239.000 [sec])
Lightcurves
Notes:
- 1) The mask-weighted light curves are using the flight position.
- 2) Multiple plots of different time binning/intervals are shown to cover all scenarios of short/long GRBs, rate/image triggers, and real/false positives.
- 3) For all the mask-weighted lightcurves, the y-axis units are counts/sec/det where a det is 0.4 x 0.4 = 0.16 sq cm.
- 4) The verticle lines correspond to following: green dotted lines are T50 interval, black dotted lines are T90 interval, blue solid line(s) is a spacecraft slew start time, and orange solid line(s) is a spacecraft slew end time.
- 5) Time of each bin is in the middle of the bin.
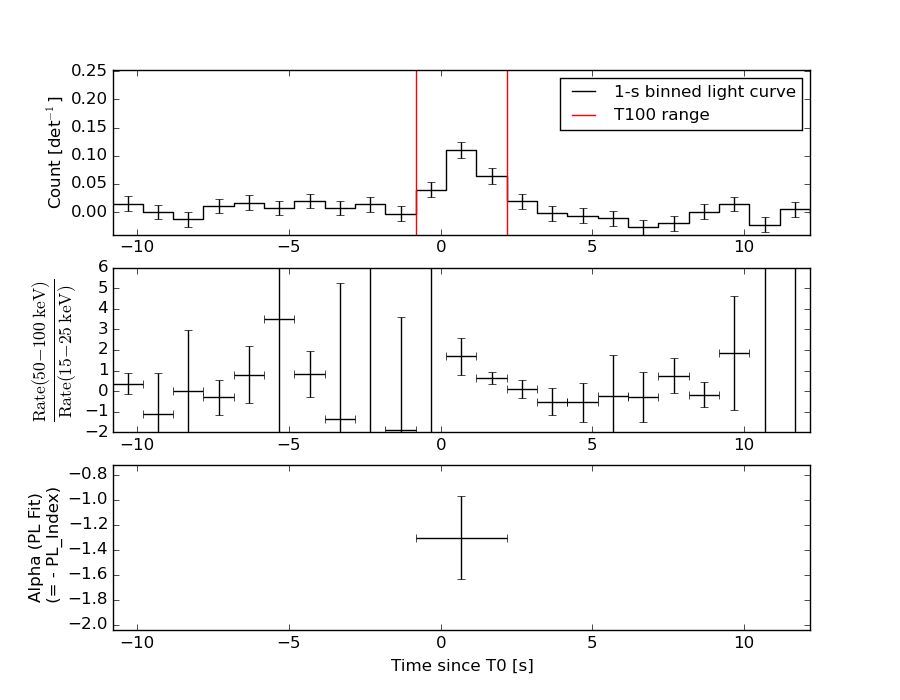
1 s binning
From T0-310 s to T0+310 s
From T100_start - 20 s to T100_end + 30 s

Full time interval
64 ms binning
Full time interval
From T100_start to T100_end
From T0-5 sec to T0+5 sec
16 ms binning
From T100_start-5 s to T100_start+5 s
Blue+Cyan dotted lines: Time interval of the scaled map
From 0.000000 to 1.024000
8 ms binning
From T100_start-3 s to T100_start+3 s
Blue+Cyan dotted lines: Time interval of the scaled map
From 0.000000 to 1.024000
2 ms binning
From T100_start-1 s to T100_start+1 s
Blue+Cyan dotted lines: Time interval of the scaled map
From 0.000000 to 1.024000
SN=5 or 10 sec. binning (whichever binning is satisfied first)
SN=5 or 10 sec. binning (T < 200 sec)
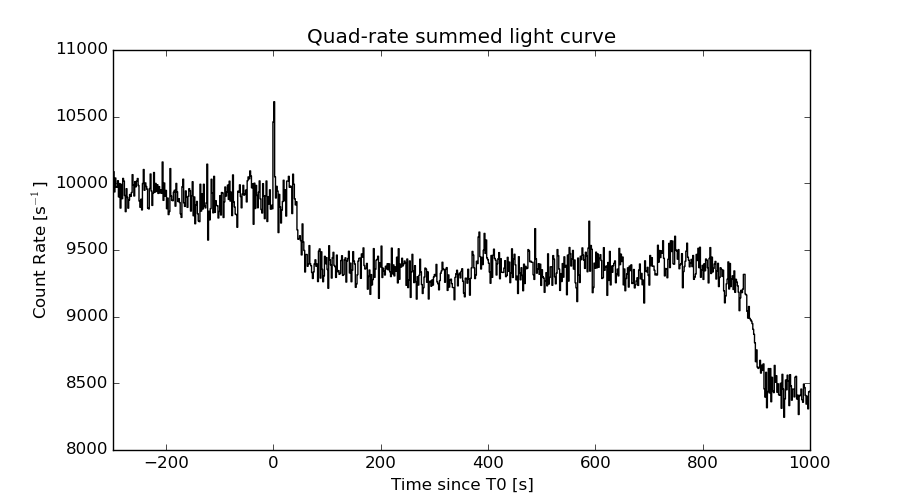
Quad-rate summed light curves (from T0-300s to T0+1000s)
Spectral Evolution
Spectra
Notes:
- 1) The fitting includes the systematic errors.
- 2) When the burst includes telescope slew time periods, the fitting uses an average response file made from multiple 5-s response files through out the slew time plus single time preiod for the non-slew times, and weighted by the total counts in the corresponding time period using addrmf. An average response file is needed becuase a spectral fit using the pre-slew DRM will introduce some errors in both a spectral shape and a normalization if the PHA file contains a lot of the slew/post-slew time interval.
- 3) For fits to more complicated models (e.g. a power-law over a cutoff power-law), the BAT team has decided to require a chi-square improvement of more than 6 for each extra dof.
Time averaged spectrum fit using the average DRM
Power-law model

Time interval is from   -0.824 sec. to    2.176 sec.

Spectral model in power-law:
------------------------------------------------------------
Parameters  : value       lower 90%   higher 90%
Photon index: 1.30577     ( -0.337747   0.328298 )
Norm@50keV  : 4.61142E-03    ( -0.000808615   0.000807891 )
------------------------------------------------------------
#Fit statistic : Chi-Squared =          41.36 using 59 PHA bins.
# Reduced chi-squared =         0.7256 for     57 degrees of freedom
# Null hypothesis probability =   9.408054e-01

Photon flux (15-150 keV)    in 3 sec: 0.550742 ( -0.100741  0.101308 ) ph/cm2/s
Energy fluence (15-150 keV)             : 1.36516e-07 ( -2.63687e-08  2.6774e-08 ) ergs/cm2
Cutoff power-law model

Time interval is from   -0.824 sec. to    2.176 sec.
Spectral model in the cutoff power-law:
------------------------------------------------------------
Parameters  : value       lower 90%   higher 90%
Photon index: 2.46824     (     )
Epeak [keV] : 153.904      (   )
Norm@50keV  : 1.02682E-03    (     )
------------------------------------------------------------
#Fit statistic : Chi-Squared =          41.04 using 59 PHA bins.
# Reduced chi-squared =         0.7328 for     56 degrees of freedom
# Null hypothesis probability =   9.331370e-01

Photon flux (15-150 keV)    in 3 sec: 0.550889 ( -0.100785  0.099862 ) ph/cm2/s
Energy fluence (15-150 keV)             : 1.36136e-07 ( -2.72343e-08  2.6805e-08 ) ergs/cm2
Band function
Time interval is from   -0.824 sec. to    2.176 sec.

Spectral model in the Band function:
------------------------------------------------------------
Parameters  : value       lower 90%   higher 90%
alpha       : -0.970257   ( 0.978971   0.978971 )
beta        : -1.35281    ( 1.34839   0.380762 )
Epeak [keV] : 116.682      ( -118.485 -118.485 )
Norm@50keV   : 7.27058E-03    ( -0.00313102   0 )
------------------------------------------------------------
#Fit statistic : Chi-Squared =          41.36 using 59 PHA bins.
# Reduced chi-squared =         0.7521 for     55 degrees of freedom
# Null hypothesis probability =   9.133265e-01

Photon flux (15-150 keV)    in 3 sec:  (    ) ph/cm2/s
Energy fluence (15-150 keV)             : 0 ( 0  0 ) ergs/cm2
Single BB
Spectral model blackbody:
------------------------------------------------------------
Parameters  : value    Lower 90%  Upper 90%
kT [keV]    : 16.6006  (-3.63854  5.39045)
R^2/D10^2   : 4.42598E-02  (-0.027037   0.0599303)
(R is the radius in km and D10 is the distance to the source in units of 10 kpc)
------------------------------------------------------------
#Fit statistic : Chi-Squared =          49.57 using 59 PHA bins.
# Reduced chi-squared =         0.8696 for     57 degrees of freedom
# Null hypothesis probability =   7.471850e-01

Energy  Fluence     90% Error
[keV]   [erg/cm2]   [erg/cm2]
15- 25  7.499e-09   2.902e-09
25- 50  3.255e-08   1.134e-08
50-150  6.354e-08   2.457e-08
15-150  1.036e-07   2.880e-08
Thermal bremsstrahlung (OTTB)
Spectral model: thermal bremsstrahlung
------------------------------------------------------------
Parameters  : value         Lower 90%    Upper 90%
kT [keV]    : 200.000       (      )
Norm        : 2.28962       (-0.405604     0.405557)
------------------------------------------------------------
#Fit statistic : Chi-Squared =          43.31 using 59 PHA bins.
# Reduced chi-squared =         0.7598 for     57 degrees of freedom
# Null hypothesis probability =   9.096647e-01

Energy  Fluence     90% Error
[keV]   [erg/cm2]   [erg/cm2]
15- 25  1.711e-08   9.990e-09
25- 50  3.290e-08   1.847e-08
50-150  7.216e-08   4.118e-08
15-150  1.222e-07   6.999e-08
Double BB
R1^2/D10^2  : 0.145064        (      )
kT2 [keV]   : 200.000        (      )
R2^2/D10^2  : 8.69046E-05    (-4.34668e-05   0.000486525)
------------------------------------------------------------
#Fit statistic : Chi-Squared =          40.73 using 59 PHA bins.
#Fit statistic : Chi-Squared =          40.61 using 59 PHA bins.
#Fit statistic : Chi-Squared =          40.52 using 59 PHA bins.
# Reduced chi-squared =         0.7406 for     55 degrees of freedom
# Reduced chi-squared =         0.7384 for     55 degrees of freedom
# Reduced chi-squared =         0.7367 for     55 degrees of freedom
# Null hypothesis probability =   9.243360e-01
# Null hypothesis probability =   9.263168e-01
# Null hypothesis probability =   9.278372e-01

Energy  Fluence     90% Error
[keV]   [erg/cm2]   [erg/cm2]
15- 25  1.209e-08   7.062e-09
25- 50  3.425e-08   1.943e-08
50-150  9.342e-08   4.649e-08
15-150  1.398e-07   6.682e-08
Peak spectrum fit
Power-law model
Time interval is from    0.176 sec. to    1.176 sec.

Spectral model in power-law:
------------------------------------------------------------
Parameters  : value       lower 90%   higher 90%
Photon index: 1.43346     ( -0.35699   0.355693 )
Norm@50keV  : 7.27682E-03    ( -0.00145737   0.00145068 )
------------------------------------------------------------
#Fit statistic : Chi-Squared =          71.64 using 59 PHA bins.
# Reduced chi-squared =          1.257 for     57 degrees of freedom
# Null hypothesis probability =   9.173337e-02

Photon flux (15-150 keV)    in 1 sec: 0.893149 ( -0.182327  0.183359 ) ph/cm2/s
Energy fluence (15-150 keV)             : 6.98499e-08 ( -1.5182e-08  1.54721e-08 ) ergs/cm2
Cutoff power-law model
Time interval is from    0.176 sec. to    1.176 sec.
Spectral model in the cutoff power-law:
------------------------------------------------------------
Parameters  : value       lower 90%   higher 90%
Photon index: 0.202137     ( -4.42854   1.54521 )
Epeak [keV] : 71.1208      ( -22.692 -70.6859 )
Norm@50keV  : 3.05828E-02    ( -0.0316388   4.53807 )
------------------------------------------------------------
#Fit statistic : Chi-Squared =          70.91 using 59 PHA bins.
# Reduced chi-squared =          1.266 for     56 degrees of freedom
# Null hypothesis probability =   8.660177e-02

Photon flux (15-150 keV)    in 1 sec: 0.833706 ( -0.23513  0.216344 ) ph/cm2/s
Energy fluence (15-150 keV)             : 6.22217e-08 ( -1.96252e-08  2.07594e-08 ) ergs/cm2
Band function

Time interval is from    0.176 sec. to    1.176 sec.

Spectral model in the Band function:
------------------------------------------------------------
Parameters  : value       lower 90%   higher 90%
alpha       : 1.01136   ( -0.969837   3.90267 )
beta        : -2.39442    ( 2.37668   1.16722 )
Epeak [keV] : 57.1662      ( -57.735 135.618 )
Norm@50keV   : 0.130620    ( -0.110817   18.0433 )
------------------------------------------------------------
#Fit statistic : Chi-Squared =          70.04 using 59 PHA bins.
# Reduced chi-squared =          1.273 for     55 degrees of freedom
# Null hypothesis probability =   8.328432e-02

Photon flux (15-150 keV)    in 1 sec:  (    ) ph/cm2/s
Energy fluence (15-150 keV)             : 6.31589e-08 ( 0  0 ) ergs/cm2
Single BB
Spectral model blackbody:
------------------------------------------------------------
Parameters  : value    Lower 90%  Upper 90%
kT [keV]    : 14.6587  (-2.66182  3.64222)
R^2/D10^2   : 0.113445  (-0.062399   0.119711)
(R is the radius in km and D10 is the distance to the source in units of 10 kpc)
------------------------------------------------------------
#Fit statistic : Chi-Squared =          71.45 using 59 PHA bins.
# Reduced chi-squared =          1.253 for     57 degrees of freedom
# Null hypothesis probability =   9.435378e-02

Energy  Fluence     90% Error
[keV]   [erg/cm2]   [erg/cm2]
15- 25  5.121e-09   1.988e-09
25- 50  1.992e-08   6.474e-09
50-150  2.882e-08   1.248e-08
15-150  5.386e-08   1.684e-08
Thermal bremsstrahlung (OTTB)
Spectral model: thermal bremsstrahlung
------------------------------------------------------------
Parameters  : value         Lower 90%    Upper 90%
kT [keV]    : 199.363       (-103.18      -199.363)
Norm        : 3.69000       (-0.728552     0.728617)
------------------------------------------------------------
#Fit statistic : Chi-Squared =          71.62 using 59 PHA bins.
# Reduced chi-squared =          1.257 for     57 degrees of freedom
# Null hypothesis probability =   9.201708e-02

Energy  Fluence     90% Error
[keV]   [erg/cm2]   [erg/cm2]
15- 25  9.188e-09   5.370e-09
25- 50  1.768e-08   1.006e-08
50-150  3.876e-08   2.236e-08
15-150  6.563e-08   3.751e-08
Double BB
R1^2/D10^2  : 1.04341E+06        (      )
kT2 [keV]   : 15.4650        (-2.91376      4.08126)
R2^2/D10^2  : 9.11976E-02    (-0.0518996   0.0564698)
------------------------------------------------------------
#Fit statistic : Chi-Squared =          71.45 using 59 PHA bins.
#Fit statistic : Chi-Squared =          64.43 using 59 PHA bins.
#Fit statistic : Chi-Squared =          64.21 using 59 PHA bins.
# Reduced chi-squared =          1.299 for     55 degrees of freedom
# Reduced chi-squared =          1.171 for     55 degrees of freedom
# Reduced chi-squared =          1.167 for     55 degrees of freedom
# Null hypothesis probability =   6.724499e-02
# Null hypothesis probability =   1.800401e-01
# Null hypothesis probability =   1.851305e-01

Energy  Fluence     90% Error
[keV]   [erg/cm2]   [erg/cm2]
15- 25  0.000e+00   0.000e+00
25- 50  0.000e+00   0.000e+00
50-150  0.000e+00   0.000e+00
15-150  0.000e+00   0.000e+00
Pre-slew spectrum (Pre-slew PHA with pre-slew DRM)
Power-law model

Spectral model in power-law:
------------------------------------------------------------
Parameters  : value       lower 90%   higher 90%
Photon index: 1.30577     ( -0.337747   0.328298 )
Norm@50keV  : 4.61142E-03    ( -0.000808615   0.000807891 )
------------------------------------------------------------
#Fit statistic : Chi-Squared =          41.36 using 59 PHA bins.
# Reduced chi-squared =         0.7256 for     57 degrees of freedom
# Null hypothesis probability =   9.408054e-01

Photon flux (15-150 keV)    in 3 sec: 0.550742 ( -0.100741  0.101308 ) ph/cm2/s
Energy fluence (15-150 keV)             : 1.36516e-07 ( -2.63687e-08  2.6774e-08 ) ergs/cm2
Cutoff power-law model
Spectral model in the cutoff power-law:
------------------------------------------------------------
Parameters  : value       lower 90%   higher 90%
Photon index: 2.46824     (     )
Epeak [keV] : 153.904      (   )
Norm@50keV  : 1.02682E-03    (     )
------------------------------------------------------------
#Fit statistic : Chi-Squared =          41.04 using 59 PHA bins.
# Reduced chi-squared =         0.7328 for     56 degrees of freedom
# Null hypothesis probability =   9.331370e-01

Photon flux (15-150 keV)    in 3 sec: 0.550889 ( -0.100785  0.099862 ) ph/cm2/s
Energy fluence (15-150 keV)             : 1.36136e-07 ( -2.72343e-08  2.6805e-08 ) ergs/cm2
Band function

Spectral model in the Band function:
------------------------------------------------------------
Parameters  : value       lower 90%   higher 90%
alpha       : -0.970257   ( 0.978971   0.978971 )
beta        : -1.35281    ( 1.34839   0.380762 )
Epeak [keV] : 116.682      ( -118.485 -118.485 )
Norm@50keV   : 7.27058E-03    ( -0.00313102   0 )
------------------------------------------------------------
#Fit statistic : Chi-Squared =          41.36 using 59 PHA bins.
# Reduced chi-squared =         0.7521 for     55 degrees of freedom
# Null hypothesis probability =   9.133265e-01

Photon flux (15-150 keV)    in 3 sec:  (    ) ph/cm2/s
Energy fluence (15-150 keV)             : 0 ( 0  0 ) ergs/cm2
S(25-50 keV) vs. S(50-100 keV) plot
S(25-50 keV)  = 3.05e-08
S(50-100 keV) = 4.93e-08
T90 vs. Hardness ratio plot
T90                                   = 3 sec.
Hardness ratio (energy fluence ratio) = 1.61639
Color vs. Color plot
Count Ratio  (25-50 keV) / (15-25 keV) = 1.91808
Count Ratio (50-100 keV) / (15-25 keV) = 1.47483
Mask shadow pattern
IMX = -2.372420022187639E-02, IMY = 4.586306671253991E-01
TIME vs. PHA plot around the trigger time
Blue+Cyan dotted lines: Time interval of the scaled map
From 0.000000 to 1.024000
TIME vs. DetID plot around the trigger time
Blue+Cyan dotted lines: Time interval of the scaled map
From 0.000000 to 1.024000
100 us light curve (15-350 keV)
Blue+Cyan dotted lines: Time interval of the scaled map
From 0.000000 to 1.024000
Spacecraft aspect plot

Bright source in the pre-burst/pre-slew/post-slew images
Pre-burst image of 15-350 keV band
Time interval of the image:
-530.623390 -493.713500
-239.824000 -0.824000

# RAcent  DECcent POSerr Theta    Phi  PeakCts   SNR AngSep     Name
#  [deg]    [deg]    ['] [deg]  [deg]                   [']
244.9847 -15.6414    0.3  16.4  127.8  10.5688  45.9    0.3	Sco X-1
256.0356 -37.8392    1.7  10.7    1.7   1.5435   7.0    2.3	4U 1700-377
256.6187 -36.4360    4.4   9.2   -0.2   0.6013   2.6    8.9	GX 349+2
262.8669 -24.7116    7.8   5.4 -121.3   0.3467   1.5    8.0	GX 1+4
264.7332 -44.4607   13.9  18.2  -21.4   0.1968   0.8    0.8	4U 1735-44
268.4149  -1.4529    3.5  27.8 -160.7   0.7678   3.3    2.8	SW J1753.5-0127
270.2604 -25.1417    4.5  11.6 -102.2   0.5950   2.6    4.0	GX 5-1
270.2828 -25.7019    3.7  11.5  -99.5   0.8299   3.6    2.7	GRS 1758-258
273.9654 -14.0647    1.8  20.2 -132.0   1.5950   6.4    2.9	GX 17+2
275.9790 -30.2807    5.6  16.5  -79.7   0.4881   2.1    5.9	H1820-303
284.8512 -24.8043    0.0  24.6  -94.1  -0.2220  -0.7   12.2	HT1900.1-2455
288.8195  10.9040    2.8  48.8 -141.9   2.7832   4.2    2.8	GRS 1915+105
263.1547 -33.8252   11.5   8.2  -39.7   0.2233   1.0    8.3	GX 354-0
255.6566 -48.8179    1.8  21.6   -1.3   1.5191   6.5 ------	UNKNOWN
266.3549  30.4418    2.4  58.3 -175.7   6.6839   4.8 ------	UNKNOWN
277.4108 -23.7352    2.2  18.3 -101.3   1.2967   5.3 ------	UNKNOWN
Pre-slew background subtracted image of 15-350 keV band
Time interval of the image:
-0.824000 2.176000

# RAcent  DECcent POSerr Theta    Phi  PeakCts   SNR AngSep     Name
#  [deg]    [deg]    ['] [deg]  [deg]                   [']
244.8734 -15.7143    5.8  16.5  127.3   0.0400   2.0    7.6	Sco X-1
256.1556 -37.9997    4.1  10.8    1.1  -0.0505  -2.8   12.3	4U 1700-377
256.3611 -36.5585   10.7   9.4    1.1  -0.0194  -1.1    8.9	GX 349+2
262.9529 -24.8325   11.0   5.5 -119.8  -0.0189  -1.0    6.0	GX 1+4
264.6350 -44.3018    8.5  18.0  -21.3  -0.0238  -1.3   10.0	4U 1735-44
268.5041  -1.6106    0.0  27.7 -160.4   0.0054   0.3   12.5	SW J1753.5-0127
270.3539 -25.2253    3.9  11.7 -101.7  -0.0553  -2.9    9.6	GX 5-1
270.1382 -25.8388   22.4  11.4  -98.9   0.0098   0.5   10.6	GRS 1758-258
274.0059 -14.0360  170.0  20.3 -132.0   0.0013   0.1    0.0	GX 17+2
275.7987 -30.5206   15.2  16.3  -78.8   0.0148   0.8   11.3	H1820-303
285.1790 -24.7667    0.0  24.9  -94.1  -0.0316  -1.3   12.1	HT1900.1-2455
288.9034  10.8639    6.6  48.8 -141.8   0.0960   1.8    7.9	GRS 1915+105
263.1750 -33.6894    0.0   8.1  -40.4  -0.0403  -2.3   12.7	GX 354-0
317.8854 -81.6741    2.5  58.9  -13.1   0.5543   4.6 ------	UNKNOWN
Post-slew image of 15-350 keV band
Time interval of the image:
63.676600 855.476590

# RAcent  DECcent POSerr Theta    Phi  PeakCts   SNR AngSep     Name
#  [deg]    [deg]    ['] [deg]  [deg]                   [']
244.9961 -15.6376    1.0  38.5  103.8   8.4799  11.1    1.0	Sco X-1
255.9739 -37.7963    1.6  27.5   63.1   2.1752   7.4    2.9	4U 1700-377
256.4314 -36.3566    4.0  26.8   65.9   0.8298   2.9    4.0	GX 349+2
263.0514 -24.6404    4.9  19.9   94.4   0.5775   2.4    6.7	GX 1+4
264.9433 -44.4286    4.6  25.1   42.4   0.5635   2.5    8.7	4U 1735-44
268.4129  -1.4515    2.3  28.7  150.8   1.2861   5.0    2.7	SW J1753.5-0127
270.2736 -25.1351    4.5  13.3   94.7   0.4792   2.6    3.4	GX 5-1
270.4700 -25.8005    5.0  13.1   91.8  -0.4317  -2.3    9.7	GRS 1758-258
274.0138 -14.0329    1.6  15.2  142.7   1.5498   7.1    0.5	GX 17+2
275.9489 -30.2438    4.5   9.4   63.3   0.5087   2.5    7.5	H1820-303
285.1010 -24.9764    3.4   0.3 -150.4   0.6731   3.4    4.9	HT1900.1-2455
288.8049  10.9246    0.9  36.4 -166.4   3.1046  12.3    1.3	GRS 1915+105
262.9782 -33.8453  178.5  20.9   67.9  -0.0159  -0.1    0.8	GX 354-0
293.0685 -46.5519    4.1  22.2   -7.6   0.6007   2.8 ------	UNKNOWN
296.2178 -11.7049    2.8  17.2 -132.6   0.8840   4.1 ------	UNKNOWN
304.2121  17.5524    3.3  46.8 -147.2   1.5061   3.5 ------	UNKNOWN
340.6517 -40.5120    3.0  48.3  -50.0   5.2826   3.8 ------	UNKNOWN
314.3968  16.8845    4.0  51.0 -135.5   3.6403   2.9 ------	UNKNOWN
Plot creation:
Sun May 31 04:42:26 EDT 2015